Open Journal of Internal Medicine
Vol.2 No.2(2012), Article ID:19623,5 pages DOI:10.4236/ojim.2012.22023
Racial variation of aerobic and anaerobic performances in sedentary men
![]()
1Department of Physiology, Sousse Faculty of Medicine, Sousse, Tunisia
2Research Unit (EM2S), High Institute of Sport and Physical Education, Sfax University, Sfax, Tunisia
3Research Laboratory “Sports Performance Optimization” National Center of Medicine and Science in Sports (CNMSS), Tunis, Tunisia
4High Institute of Sport and Physical Education, Ksar-Saïd, University of Manouba, Manouba, Tunisia
Email: *h_chtourou@yahoo.fr
Received 16 March 2012; revised 15 April 2012; accepted 5 May 2012
Keywords: anaerobic performance; aerobic performance; ethnicity
ABSTRACT
The present study was designed to compare the effect of racial variations on shortand incremental maximal exercises in sedentary men whites (WT) and blacks (BT) Tunisian and South African (SA). In a randomized order, thirty-six physically sedentary men including 12 BT, 12 WT, and 12 SA were asked to perform a force-velocity (i.e., determination of maximal power (Pmax), F0, and V0) and a treadmill maximal aerobic (i.e., determination of maximal oxygen uptake (VO2max)) tests. Pmax and F0 were significantly higher in SA than WT (p < 0.01 and p < 0.05 respectively). However, no significant difference was observed between WT and BT and between SA and BT. Likewise, racial variations didn’t affect the V0 values. Moreover, VO2max was significantly higher in SA and BT than WT (p < 0.001). However, no significant difference was observed between SA and BT. Compared to white subjects, the present study’ results suggest the superiority of blacks races on aerobic and anaerobic exercises in physically sedentary men.
1. INTRODUCTION
In children and adolescents, large inter-individual variation in work capacities and power are reported in the literature [1]. These variations are mainly attributed to factors including age, sex, maturation, exercise training, environment, and socioeconomic status. A racial/ethic origin as a putative causal factor of such variation also has been considered [2,3]. However, differences between racial groups in muscle power performance are generally small, and genuine racial differences in peak power output and field tests are lacking, especially when allowance is made for other factors such as environment and socioeconomic status in developing countries [4]; motor learning before the final cycling peak power test [5] or anatomical stature and muscle architecture [6,7]. In adults, Ama et al. [8] demonstrated the superiority of black individuals that was due to higher percentage of fast twitch fibres. Consequently, male black individuals are, in terms of skeletal muscle, histochemical, and biochemical characteristics, well endowed for sports events of short duration. Environment factors, socioeconomic status, and cycling skills are most often cited as underlying racial or ethnic variation [3,4-8], but they have not systematically been investigated. In a recent study, Rahmani [9] indicated that Senegalese and Italian sprinters were similar in terms of the muscle abilities involved in slow maximal contractions; however, Senegalese demonstrated lower values in high-speed contractions.
On the others hand, blacks Africans have achieved the best international records and the majority of medals on activities soliciting highly the aerobic metabolism [10]. In addition, African long-distance runners, accumulate less lactate compared to white for the same exercise intensity [11]. The blacks are characterized also by a better resistance to fatigue than whites [12]. Likewise, elite black runners are more intensively and sustain a higher percentage of maximal oxygen uptake (VO2max) during competition due to lower blood lactate concentrations. Fitzpatrick et al. [13] indicated that the geographical divide between different groups of people, a partial consequence of racial and economic residential segregation, and environmental background are the main causes of the difference on physical performance.
To the best of our knowledge, few data are available with respect to short-term muscle power and aerobic exercise performance in trained subjects from different racial groups. It is crucial for athletes, coaches, and researchers, to know the differences in aerobic and anaerobic exercise performance in blacks and whites subjects. Thus, the aim of the present study to investigate the effect of ethnicity (i.e., blacks (BT) and whites (WT) Tunisian and South African (SA) subjects ) on shortand incremental maximal exercises.
2. MATERIALS AND METHODS
2.1. Participants
Thirty-six physically sedentary men, i.e., 14 BT, 15 WT, from the same Berber descent [14] and 15 SA (from Cameroon, Senegal, Zaire, Ivory, and Burundi) participated in this study after having a thorough explanation of the protocol and signing a consent document. Participants known to be sedentary by means of questionnaire and who had only sedentary activities at the time of the study gave their written consent to participate in this study. Subjects were matched of age, height, body weight, and body mass index (BMI). Subjects’ characteristics are presented in table 1. Subjects were non-smokers, do not consume caffeine or any alcoholic beverages and none of them was taking any medication. The study protocol complied with the Helsinki declaration for human experimentation and was approved by the University Ethics Committee.
2.2. Experimental Design
Before the start of the experimental period, the subjects were familiarized with the high-velocity cycling exercises and treadmill test so as to minimize potential learning effects during the period of the investigation [15,16]. In a randomized order, subjects perform a force-velocity test and a treadmill maximal test on separate days in order to evaluate the anaerobic and the aerobic performances. Test sessions were conducted in the evening to contract the effect of time of day on both aerobic and anaerobic performances [17-23]. Body weight was measured to the nearest of 0.1 kg using a Tanita digital scale (Tanita, Tokyo, Japan).
2.3. Exercise Testing
2.3.1. Force-Velocity (F-V) Test
The F-V test involved repetitive 6-s maximal sprints against increasing braking forces set before the start of the exercise. Seat height was adjusted for each subject. This height was recorded and kept the same for each subject in each trial. The feet were held in the pedals with toe-clips. The subject remained in a sitting position during each F-V test and was vigorously encouraged to reach the maximal pedalling rate as quickly as possible. The test began with a braking force of 1 kg. Sprints are separated by 5 min of recovery and the braking force increased by 1 kg from a sprint to another. Sprints was repeated until the subjects were unable to reach a peak velocity higher than 100 rev∙min−1. The subjects generally performed six or seven short all-out sprints. Peak velocity (V) was measured during each sprint for each braking force (F) and used to calculate the F-V relationship according to the least-squares method.
An estimate of maximal velocity at zero braking force is presented by V0. It is assumed that F0 is the braking force corresponding to zero velocity. Given the linear F-V relationship in cycling, the optimal braking force and the optimal velocity are equal to 0.5 F0 and 0.5 V0 [24]. Therefore, Pmax is equal to:
Pmax (W) = 0.25 × V0 × F0
2.3.2. Treadmill Test (Bruce, 1984)
The Bruce test [25] is a maximal running test performed on a treadmill for the estimation of the VO2max. The protocol of the test consists of 10 stages lasting 3 min with increasing both speed and slope in-between. The subject stops because when it cannot go beyond. The Bruce Treadmill Test is an indirect test that estimates VO2max using the formula:
VO2max (ml/kg∙min) = 14.8 − (1.379 × T)
+ (0.451 × T2) − (0.012 × T3)
“T” is the total time of the test expressed as a fraction of a min.
2.4. Statistical Analysis
Statistical tests were processed using STATISTICA Software (StatSoft, France). Data are reported as mean ± SD. Once the assumption of normality was confirmed using the Shapiro-Wilk W-test, data was analyzed using a one-way (group) analysis of variance (ANOVA). When appropriate, significant differences among means were
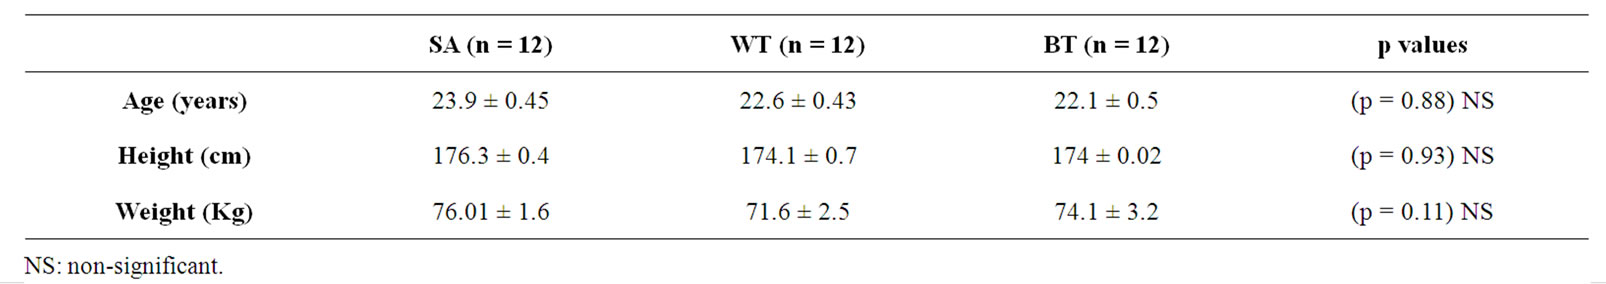
Table 1. Subjects characteristics.
NS: non-significant.
tested using the Tukey post-hoc test. The level of statistical significance was set at p < 0.05.
3. RESULTS
3.1. Force-Velocity Test
There was a significant group effect indicating that Pmax (F(2.22) = 6.11; p < 0.01; figure 1) and F0 (F(2.22) = 3.95, p < 0.05; figure 2) were significantly higher in SA than WT subjects (p < 0.01 and p < 0.05 respectively). However, no-significant difference was observed between WT and BT and between SA and BT.
For V0, the main effect of group (F(2.22) = 2.12, p > 0.05; figure 3) was not-significant.
3.2. The Maximal Oxygen Uptake (VO2max)
There was a significant group effect (F(2.22) = 10.6, p < 0.01; figure 4) for the VO2max. The post-hoc analysis showed a significant higher VO2max in SA and BT than WT subjects (p < 0.01 and p < 0.05 respectively). However, no significant difference between BT and SA was observed.
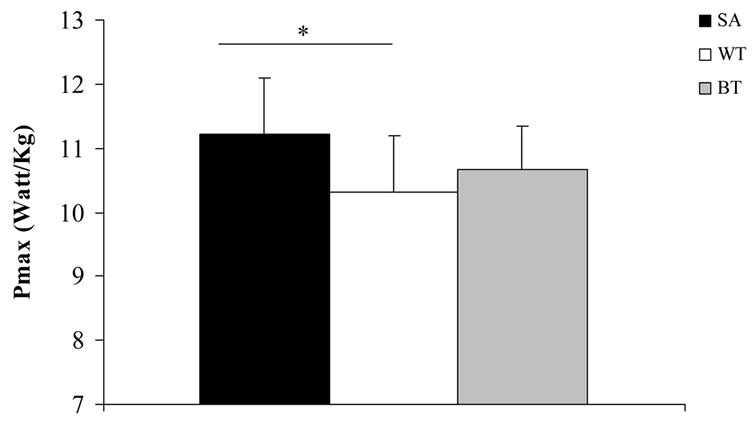
Figure 1. Pmax in the three groups of subjects (i.e., SA: South Africans; BT: Black Tunisian; WT: White Tunisian) during the force-velocity test. *Significant difference in comparison with WT.
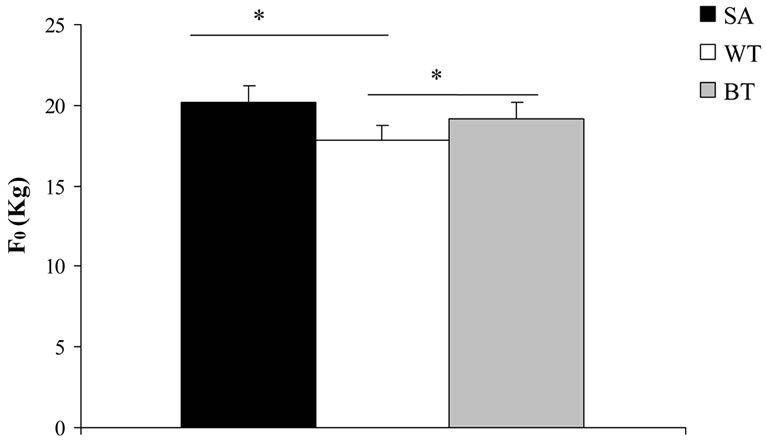
Figure 2. F0 in the three groups of subjects (i.e., SA: South Africans; BT: Black Tunisian; WT: White Tunisian) during the force-velocity test. *Significant difference in comparison with WT.
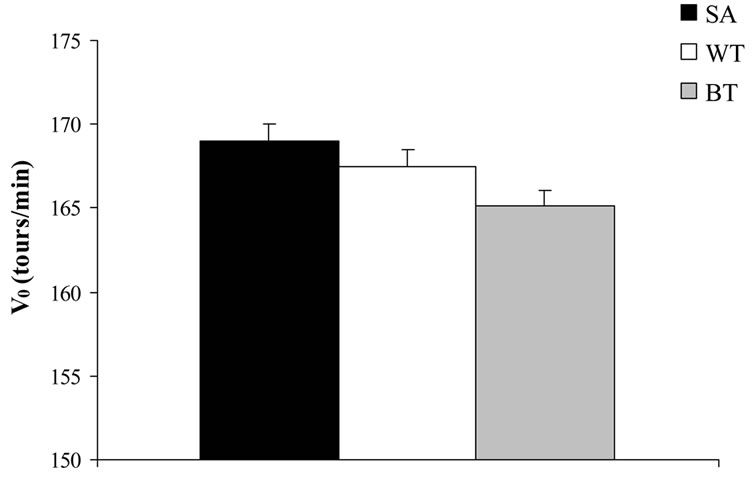
Figure 3. V0 in the three groups of subjects (i.e., SA: South Africans; BT: Black Tunisian; WT: White Tunisian) during the force-velocity test.
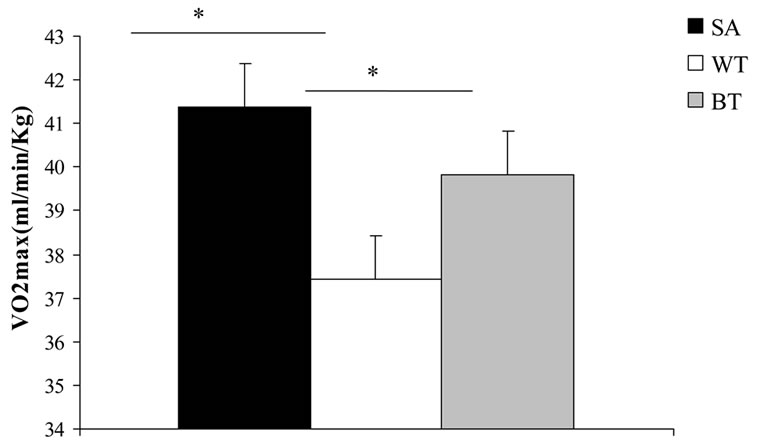
Figure 4. VO2max in the three groups of subjects (i.e., SA: South Africans; BT: Black Tunisian; WT: White Tunisian) during the treadmill test. *Significant difference in comparison with WT.
4. DISCUSSION
The purpose of this study was to explore the effect of racial variation on short-term and incremental maximal exercise in WT, BT, and SA sedentary men. The results showed that aerobic and anaerobic performances were different between ethnic groups. Indeed, compared to white subjects, the present study suggests the supremacy of black race on both aerobic and anaerobic performance.
4.1. The Anaerobic Maximal Power
The present data and those of previous study showed the dominance of blacks in short-term maximal exercises [3]. The superiority of blacks on anaerobic power is explained by differences in Pmax, F0, and V0. Indeed, our results show that the theoretical maximum force (F0) of blacks is higher compared to whites. However, the maximum theoretical speed (V0) showed no differences between the three groups. This deduction can be made as justified by the Pmax depends more than F0 to V0 [26]. Since, F0, known as a strength index, is strongly correlated with the isometric and isokinetic performance [26], it is likely that the isometric and isokinetic forces are higher among blacks compared to whites.
To explain this superiority, previous studies have suggested that Africans have a higher percentage of fast twitch fibres [7-26] and greater glycolytic enzyme activity responsible for the anaerobic production of energy [2].
However, Ama et al. [7] do not confirm our results in a test of voluntary isometric contraction of knee extensors. These results showed that knee extensor muscles of black and white males have similar anaerobic power and capacity. In addition, the results revealed that black subjects experience a greater degree of fatigue than whites during an anaerobic exercise.
Primary outcomes of this study showed significant differences between anaerobic performances measured by the force-velocity test of SA and BT. This superiority can be explained physiologically, by better coordination between and within muscles in black subjects [3]. Moreover, blacks may have a higher percentage of fast fiber compared to whites [2]. In addition, the mobilization of fast muscle fiber can also be better for blacks [2-27]. In turn, enzymes catalyzing reactions in phosphagenic, glycolytic, and lactate dehydrogenase metabolic pathways had significantly higher activities (about 30% - 40%) in the black than white. From this point of view, the results of the present study suggest that SA are on the average well endowed for high-intensity performance of short duration with respect to muscle characteristics. Terjung et al. [28] showed that the largest difference between the two racial groups was found at the level of Creatine kinase activity and this fits well with a presumed advantage of Black males in events of short duration.
4.2. The Maximal Oxygen Uptake (VO2max)
The present study’ results confirm those of previous studies Coetzer et al. [12] demonstrating the superiority of blacks compared to whites during exercises seeking highly aerobic metabolism. These differences may be explained by environmental, genetic, morphological, and geographical factors. Indeed, blacks have longer lower and upper body-limbs [29] that could reduce the energy cost during treadmill running. Moreover, Coetzer et al. [12] suggested that the higher VO2max observed can be explained by a higher percentage of fiber type I and IIa and higher resistance to fatigue. Indeed, the dominance of black subjects may be explained by a low accumulation of lactate, factor limiting the exercise, during long duration exercises [27]. During the same exercise intensity, Bosch et al. [30] showed that black males have a better ability to mobilize a higher percentage of VO2max than whites. Moreover, the better aerobic system in blacks could be explained by the maximum activity of enzymes of the Krebs cycle [26], which could limit the ability of muscle to use oxygen. Ama et al. [27] concluded that the main limitation of VO2max is the numbers of mitochondria which may be lower in white subjects.
5. CONCLUSION
The present study showed higher aerobic and anaerobic performances in blacks than whites sedentary males. These observations may be useful for coaches to organize specific training sessions with taking into account the race differences. Moreover, the findings of the current study can be used for the selection of talent in sports practices.
6. ACKNOWLEDGEMENTS
This study was supported by the Ministry of Higher Teaching and Scientific Research, Tunisia. We are grateful to all of the players who participated so willingly in the study.
REFERENCES
- Ben Ayed, K., Latiri, I., Dore, E. and Tabka, Z. (2011) Leg muscle power in 12-year-old black and white Tunisian football players. Research in Sports Medicine, 19, 103-117. doi:10.1080/15438627.2011.556527
- Boulay, M.R., Ama, P.F. and Bouchard, C. (1988) Racial variation in work capacities and powers. Canadian Journal of Applied Sports Sciences, 13, 127-135.
- Malina, R.M. (1988) Racial/ethnic variation in the motor development and performance children. Canadian Journal of Sport Science, 13, 136-143.
- De Jonge, R., Bedu, M., Fellmann, N., Blonc, S., et al. (1996) Effect of anthropometric characteristics and socioeconomic status on physical performance of prepubertal children living in Bolivia at low altitude. European. Journal of Applied Physiology, 74, 367-374. doi:10.1007/BF02226934
- De Franca, N.M., Doré, E., Bedu, M. and Van Praagh, E. (2002) Comparison of peak muscle power between Brazilian and French girls. American Journal of Human Biology, 14, 364-371. doi:10.1002/ajhb.10046
- Abe, T., Brown, J.B. and Brechue, W.F. (1999) Architectural characteristics of muscle in black and white college football players. Medicine & Science in Sports & Exercise, 31, 1448-1452. doi:10.1097/00005768-199910000-00014
- Ama, P.F.M., Lagasse, P., Bouchard, C. and Simoneau, J.A. (1990) Anaerobic performances in black and white subjects. Medicine & Science in Sports & Exercise, 22, 508-511. doi:10.1249/00005768-199008000-00015
- Himes, J.H. (1988) Racial variation in physique and body composition. Canadian Journal of Applied Sports Sciences, 13, 117-126.
- Rahmani, A., Locatelli, E. and Lacour, J.R. (2004) Differences in morphology and force/velocity relationship between Senegalese and Italian sprinters. European Journal of Applied Physiology, 91, 399-405. doi:10.1007/s00421-003-0989-x
- Samson, J. and Yerles, V. (1988) Racial differences in sports performance. Canadian Journal of Sports Science, 13, 109-116.
- Saltin, B., Larsen, H. and Terrados, N. (1995) Aerobic exercise capacity at sea level and at altitude in Kenyan boys, junior and senior runners compared with Scandinavian runners. Scandinavian Journal of Medicine Science and Sports, 5, 209-221. doi:10.1111/j.1600-0838.1995.tb00037.x
- Coetzer, P., Noakes, T.D., Sanders, B., Lambert, M.I., et al. (1993). Superior fatigue resistance of elite black South African distance runners. Journal of Applied Physiology, 75, 1822-1827.
- Fitzpatrick, K. and LaGory, M. (2003) Placing health in an urban sociology: Cities as mosaics of risk and protecttion. City and Community, 2, 33-46. doi:10.1111/1540-6040.00037
- Hajjej, A., Hmida, S., Kaabi, H., Dridi, A., et al. (2006) HLA genes in southern Tunisian (Ghannouch Area) and their relationship with other mediterraneans. European Journal of Medical Genetics, 49, 43-56. doi:10.1016/j.ejmg.2005.01.001
- Chtourou, H., Hammouda, O., Souissi, H., Chamari, K., et al. (2011) The effect of Ramadan fasting on physical performances, mood state and perceived exertion in young footballers. Asian Journal of Sports Medicine, 2, 177-185.
- Chtourou, H., Jarraya, M., Aloui, A., Hammouda, O., et al. (2012) The effects of music during warm-up on anaerobic performances of young sprinters. Science & Sports, in press. doi:10.1016/j.scispo.2012.02.006
- Chtourou, H., Chaouachi, A., Driss, T., Dogui, M., et al. (2012) The effect of training at the same time of day and tapering period on the diurnal variation of short exercise performances. Journal of Strength and Conditioning Research, 26, 697-708.
- Chtourou, H., Chaouachi, A., Hammouda, O., Chamari, K., et al. (2012) Listening to music affects diurnal variation in muscle power output. International Journal of Sports Medicine, 33, 43-47. doi:10.1055/s-0031-1284398
- Chtourou, H., Driss, T., Souissi, S., Gam, A., et al. (2012) The effect of strength training at the same time of the day on the diurnal fluctuations of muscular anaerobic performances. Journal of Strength and Conditioning Research, 26, 217-225. doi:10.1519/JSC.0b013e31821d5e8d
- Chtourou, H., Hammouda, O., Chaouachi, A., Chamari, K., et al. (2012) The effect of time-of-day and Ramadan fasting on anaerobic performances. International Journal of Sports Medicine, 33, 142-147. doi:10.1055/s-0031-1286251
- Chtourou, H., Zarrouk, N., Chaouachi, A., Dogui, M., et al. (2011) Diurnal variation in Wingate-test performance and associated electromyographic parameters. Chronobiology International, 28, 706-713. doi:10.3109/07420528.2011.596295
- Chtourou, H. and Souissi, N. (2012) The effect of training at a specific time-of-day: A review. Journal of Strength and Conditioning Research, in press. doi:10.1519/JSC.0b013e31825770a7
- Chtourou, H., Hammouda, O., Souissi, H., Chamari, K., et al. (2012) Diurnal variations in physical performances related to football in adolescent soccer players. Asian Journal of Sports Medicine, (in press).
- Vandewalle, H., Pores, G. and Monod, H. (1987) Standard anaerobic exercise tests. Sports Medicine, 4, 268- 289. doi:10.2165/00007256-198704040-00004
- Bruce, R.A. (1984) Normal values for VO2 and the VO2- HR relationship. The American Review of Respiratory Disease, 129, 41-43.
- Driss, T., Vandewalle, H., Le Chevalier, J.M. and Monod, H. (2002) Force-velocity relationship on a cycle ergometer and knee-extensor strength indices. Canadian Journal of Applied Physiology, 27, 250-262. doi:10.1139/h02-015
- Ama, P.F., Simoneau, J.A., Boulay, M.R., et al. (1986) Skeletal muscle characteristics in sedentary black and Caucasian males. Journal of Applied Physiology, 61, 1758- 1761.
- Terjung, R.L., Dudley, G.A. and Meyer, R.A. (1985) Metabolic and circulatory limitations to muscular performance at the organ level. Journal of Experimental Biology, 115, 307-318.
- Eveleth, P.B. and Tanner, J.M. (1976) Worldwide variation in human growth. Cambridge University Press, Cambridge.
- Bosch, A., Goslin, R., Noakes, T.D. and Dennis, S.C. (1990) Physiological differences between black and white runners during a treadmill marathon. European Journal of Applied Physiology, 61, 68-72. doi:10.1007/BF00236696
NOTES
*Corresponding author.