Y. C. Xue et al. / Natural Science 2 (2010) 120-123
Copyright © 2010 SciRes. OPEN ACCESS
121
ability, since the interval of log sample density is 0.125m,
and performance permeability calculated by actual pro-
duction files is located in some production interval, there
is asymmetry between them. Logging permeability in
target stratum must be averaged by actual production
intervals, in order to build corresponding relationship
with the permeability of actual production intervals. The
permeability expression of actual production intervals
calculated by average method of logging permeability is
described below:
1
2sh
1
11
L
,,
n
nj
j
i
i
KMzV
h
n
Kh
(2)
where L
is the average logging permeability of res-
ervoir production intervals, μm2;
sh
,,
KMzV
is the
permeability of j sample site in i sublayer, μm2; φ, Mz,
Vsh is the porosity, the median grain diameter, the shale
content of j sample site in i sublayer; hi is the thickness
of reservoir production intervals, m; n1 is the number of
logging permeability point in i sublayer; n2 is the num-
ber of sublayer in piezometric intervals.
2.3. The Correction of Logging Permeability
Reservoir performance permeability, calculated by
primiparity data files, could reflect the actual flow char-
acteristics in reservoir, which is closer to the true one.
Because there is great distinction between logging per-
meability and performance permeability in fractural
low-permeability reservoir, when logging permeability is
corrected by performance permeability, the correction
coefficient
has to be introduced, the
can be cal-
culated by Formula 3:
1
2
e
w
T
L
sh
1
11
ln
2
,,
n
nj
j
i
i
r
Qr
KhP
KKMzV
h
n
h
π (3)
where
is correction coefficient which is revise log-
ging permeability to performance permeability, the val-
ues varies by wells. The greater of
, the more differ-
ence between logging permeability and performance
permeability, the logging permeability can’t reflect res-
ervoir effluent seepage characteristic. The less of
, the
less difference between logging permeability and per-
formance permeability, the logging permeability can
approximately reflect reservoir effluent seepage charac-
teristic.
As to every production well, only one
value can
be calculated by Formula 3, but, when building 3D per-
meability model, the every point logging permeability
need to be revised. Only using every point revised per-
meability, the 3D permeability model can better reflect
reservoir actually effluent seepage characteristic. So the
Formula 4, dynamic correction model of logging per-
meability, can be used to correction every point logging
permeability.
sh
(,, )PermKMz V
(4)
where Perm is logging permeability after performance
correction, for reservoir permeability model, μm2;
With the value of
, logging permeability of each
well could be corrected to performance permeability
point by point, then performance permeability model,
which is closer to the true reservoir, would be estab-
lished for the research of reservoir engineering and nu-
merical simulation.
When using this method, the problems below should
be noticed. 1) In order to ensure that only single phase
flow occurs, initial production should be taken as possi-
ble; 2) Well flow rate must be conversed to sand face
one by volume factor; 3) Don’t use multiple zones
commingled test data; 4) If the area of reservoir is large,
fluid viscosity varies , it needs to be treated zone by
zone.
3. APPLICATION
In this paper, Chang 4+5 reservoir in Baiyushan area of
Jing’An oil field is chosen as an example. Baiyushan
area of Jing’An oil field is situated at NE-SW nose like
structure on the Shanbei slope of Ordos basin, Chang
4+5 reservoir is generally delta front subfacies deposite,
major reservoir is subsea distributary channel sand, most
of reservoir lithology are fine sandstone, siltstone and
argillaceous siltstone; Major reservoir sand type is lithic
arkose; The average porosity of reservoir is 12.4%, the
average permeability of reservoir is 1.05×10⁻³μm2, it’s a
typical sand reservoir with low porosity and permeability.
Structural microfracture developed in reservoir has been
discovered during production. When production history
is matched with the model established by logging per-
meability, no matter how to regulate relative permeabil-
ity, it’s shown that match water injection is smaller than
true one, match oil production is smaller than true one.
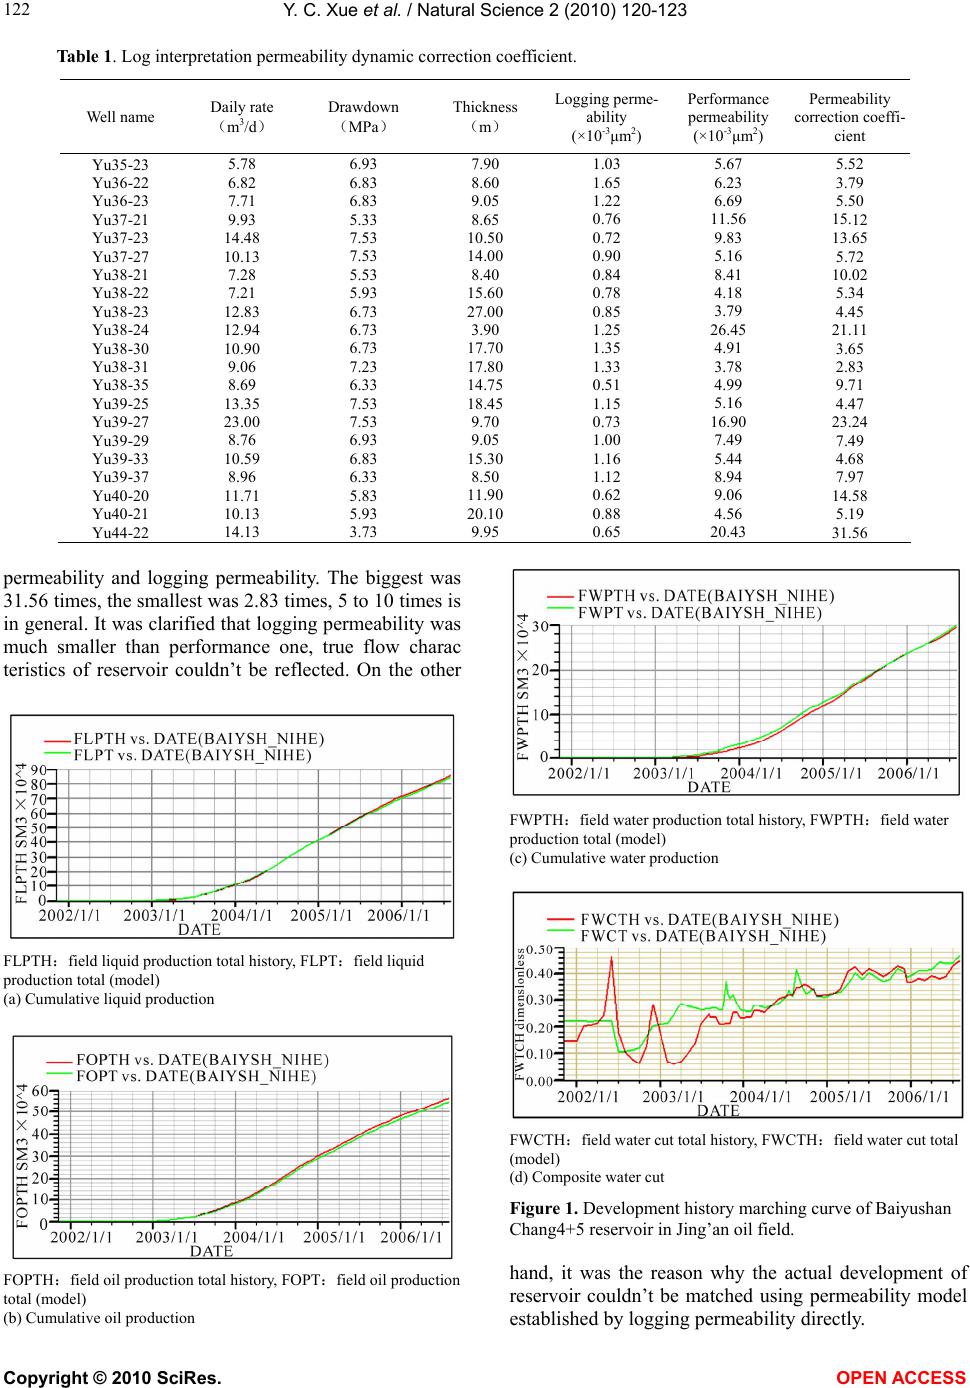
According to logging permeability correction method
above, logging permeability performance correction co-
efficient
of wells in region of interest were calcu-
lated (Table 1, partial wells shown). From Table 1: it’s
seen that great difference exists between performance