Paper Menu >>
Journal Menu >>
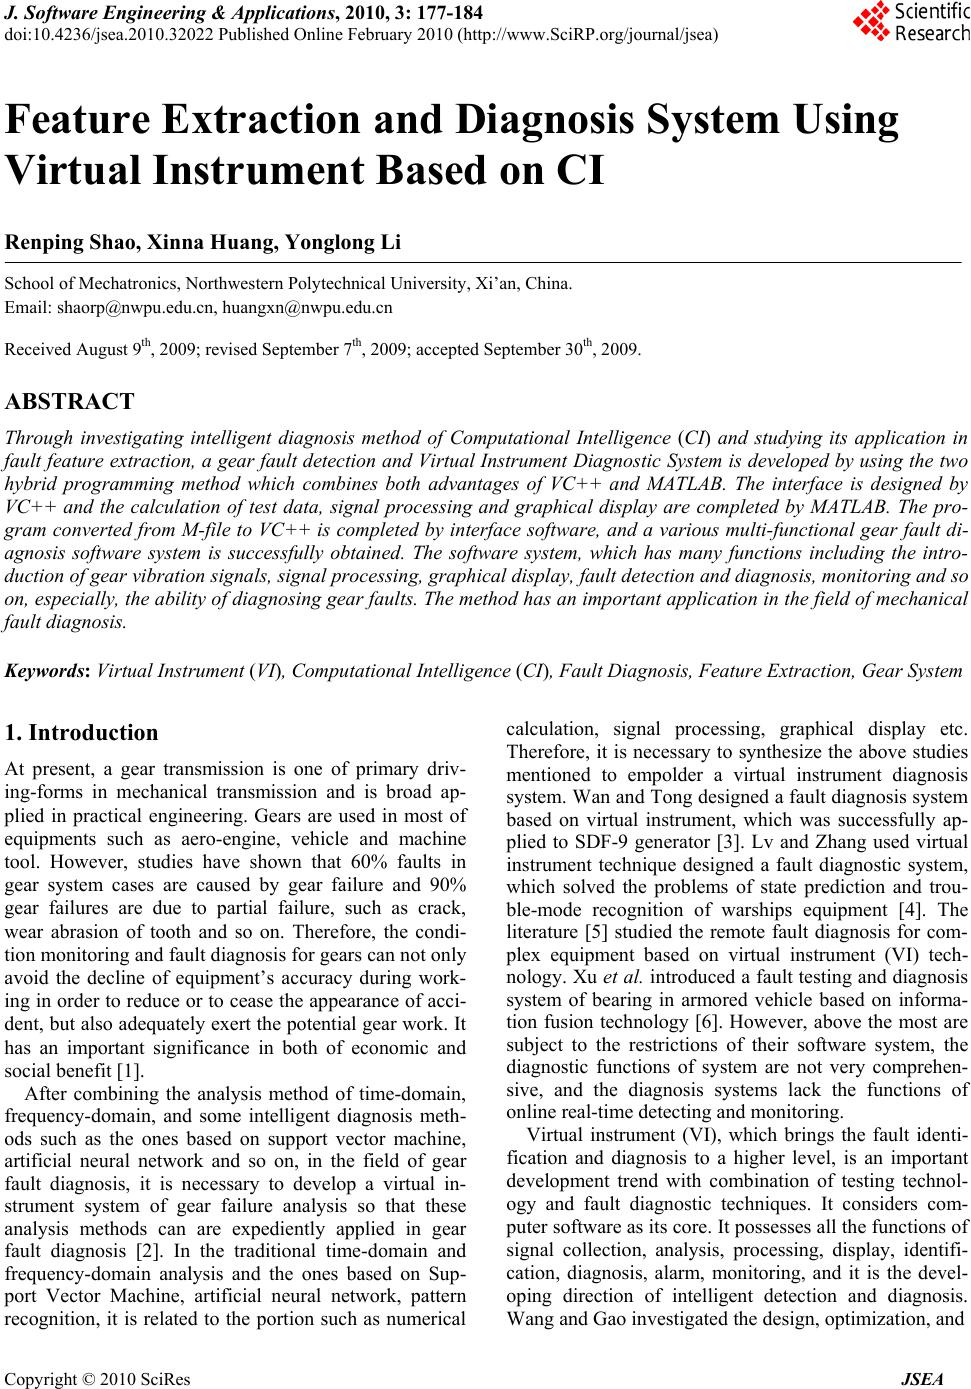 J. Software Engineering & Applications, 2010, 3: 177-184 doi:10.4236/jsea.2010.32022 Published Online February 2010 (http://www.SciRP.org/journal/jsea) Copyright © 2010 SciRes JSEA Feature Extraction and Diagnosis System Using Virtual Instrument Based on CI Renping Shao, Xinna Huang, Yonglong Li School of Mechatronics, Northwestern Polytechnical University, Xi’an, China. Email: shaorp@nwpu.edu.cn, huangxn@nwpu.edu.cn Received August 9th, 2009; revised September 7th, 2009; accepted September 30th, 2009. ABSTRACT Through investigating intelligent diagnosis method of Computational Intelligence (CI) and studying its application in fault feature extraction, a gear fault detection and Virtual Instrument Diagnostic System is developed by using the two hybrid programming method which combines both advantages of VC++ and MATLAB. The interface is designed by VC++ and the calculation of test data, signal processing and graphical display are completed by MATLAB. The pro- gram converted from M-file to VC++ is completed by interface software, and a various multi-functional gear fault di- agnosis software system is successfully obtained. The software system, which has many functions including the intro- duction of gear vibration signals, signal processing, graphical display, fault detection and diagnosis, monitoring and so on, especially, the ab ility of diagnosing gear faults. Th e method has an impor tant application in the field of mechanical fault diagnosis. Keywords: Virtual Instrument (VI), Computational Intelligence (CI), Fault Diagnosis, Feature Extraction, Gear System 1. Introduction At present, a gear transmission is one of primary driv- ing-forms in mechanical transmission and is broad ap- plied in practical engineering. Gears are used in most of equipments such as aero-engine, vehicle and machine tool. However, studies have shown that 60% faults in gear system cases are caused by gear failure and 90% gear failures are due to partial failure, such as crack, wear abrasion of tooth and so on. Therefore, the condi- tion monitoring and fault diagnosis for gears can not only avoid the decline of equipment’s accuracy during work- ing in order to reduce or to cease the appearance of acci- dent, but also adequately ex ert the potential gear work. It has an important significance in both of economic and social benefit [1]. After combining the analysis method of time-domain, frequency-domain, and some intelligent diagnosis meth- ods such as the ones based on support vector machine, artificial neural network and so on, in the field of gear fault diagnosis, it is necessary to develop a virtual in- strument system of gear failure analysis so that these analysis methods can are expediently applied in gear fault diagnosis [2]. In the traditional time-domain and frequency-domain analysis and the ones based on Sup- port Vector Machine, artificial neural network, pattern recognition, it is related to the portion such as numerical calculation, signal processing, graphical display etc. Therefore, it is necessary to synthesize the above studies mentioned to empolder a virtual instrument diagnosis system. Wan and Tong designed a fault diagnosis system based on virtual instrument, which was successfully ap- plied to SDF-9 generator [3]. Lv and Zhang used virtual instrument technique designed a fault diagnostic system, which solved the problems of state prediction and trou- ble-mode recognition of warships equipment [4]. The literature [5] studied the remote fault diagnosis for com- plex equipment based on virtual instrument (VI) tech- nology. Xu et al. introduced a fault testing and diagnosis system of bearing in armored vehicle based on informa- tion fusion technology [6]. However, above the most are subject to the restrictions of their software system, the diagnostic functions of system are not very comprehen- sive, and the diagnosis systems lack the functions of online real-time detecting and monitoring. Virtual instrument (VI), which brings the fault identi- fication and diagnosis to a higher level, is an important development trend with combination of testing technol- ogy and fault diagnostic techniques. It considers com- puter software as its core. It possesses all the function s of signal collection, analysis, processing, display, identifi- cation, diagnosis, alarm, monitoring, and it is the devel- oping direction of intelligent detection and diagnosis. Wang and Gao investigated the design, optimization, and 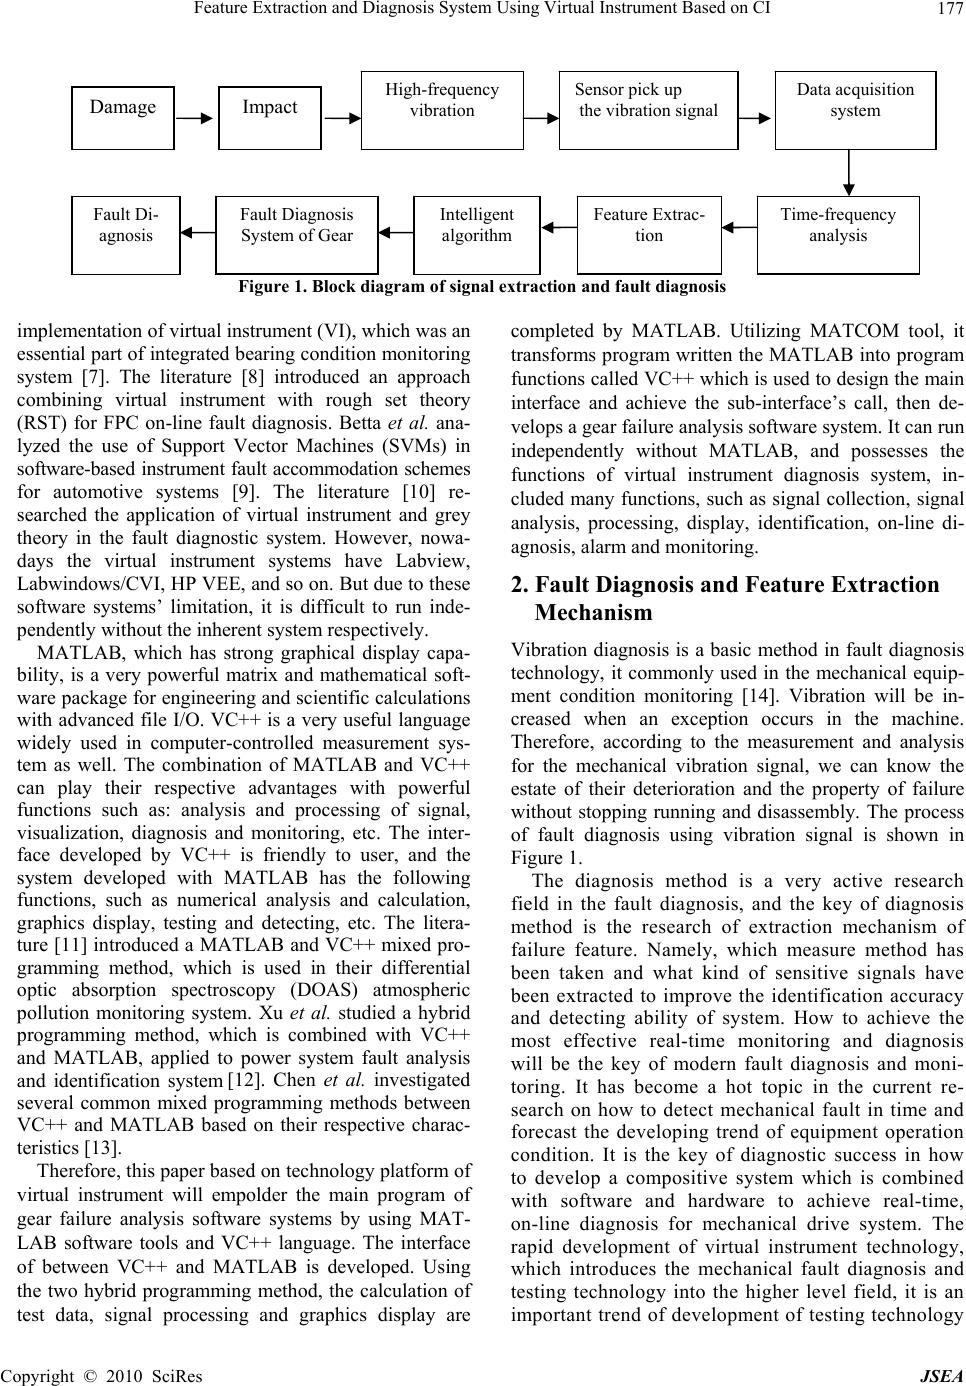 Feature Extraction and Diagnosis System Using Virtual Instrument Based on CI177 Figure 1. Block diagram of signal extraction and fault diagnosis implementation of virtual instrument (VI), which was an essential part of integrated bearing condition monito ring system [7]. The literature [8] introduced an approach combining virtual instrument with rough set theory (RST) for FPC on-line fault diagnosis. Betta et al. ana- lyzed the use of Support Vector Machines (SVMs) in software-based instrument fault accommodation schemes for automotive systems [9]. The literature [10] re- searched the application of virtual instrument and grey theory in the fault diagnostic system. However, nowa- days the virtual instrument systems have Labview, Labwindows/CVI, HP VEE, and so on. But due to these software systems’ limitation, it is difficult to run inde- pendently without the inherent system respectively. MATLAB, which has strong graphical display capa- bility, is a very powerful matrix and mathematical soft- ware package for engineering and scientific calculations with advanced file I/O. VC++ is a very useful language widely used in computer-controlled measurement sys- tem as well. The combination of MATLAB and VC++ can play their respective advantages with powerful functions such as: analysis and processing of signal, visualization, diagnosis and monitoring, etc. The inter- face developed by VC++ is friendly to user, and the system developed with MATLAB has the following functions, such as numerical analysis and calculation, graphics display, testing and detecting, etc. The litera- ture [11] introduced a MATLAB and VC++ mixed pro- gramming method, which is used in their differential optic absorption spectroscopy (DOAS) atmospheric pollution monitoring system. Xu et al. studied a hybrid programming method, which is combined with VC++ and MATLAB, applied to power system fault analysis and identification system [12]. Chen et al. investigated several common mixed programming methods between VC++ and MATLAB based on their respective charac- teristics [13]. Therefore, this paper based on technology platform of virtual instrument will empolder the main program of gear failure analysis software systems by using MAT- LAB software tools and VC++ language. The interface of between VC++ and MATLAB is developed. Using the two hybrid programming method, the calculation of test data, signal processing and graphics display are completed by MATLAB. Utilizing MATCOM tool, it transforms program written the MATLAB into program functions called VC++ which is us ed to design the main interface and achieve the sub-interface’s call, then de- velops a gear failure analysis software system. It can run independently without MATLAB, and possesses the functions of virtual instrument diagnosis system, in- cluded many functions, such as signal collection, signal analysis, processing, display, identification, on-line di- agnosis, alarm and monitoring. 2. Fault Diagnosis and Feature Extraction Mechanism Vibration diagnosis is a basic method in fault diagnosis technology, it commonly used in the mechanical equip- ment condition monitoring [14]. Vibration will be in- creased when an exception occurs in the machine. Therefore, according to the measurement and analysis for the mechanical vibration signal, we can know the estate of their deterioration and the property of failure without stopping running and disassembly. The process of fault diagnosis using vibration signal is shown in Figure 1. The diagnosis method is a very active research field in the fault diagnosis, and the key of diagnosis method is the research of extraction mechanism of failure feature. Namely, which measure method has been taken and what kind of sensitive signals have been extracted to improve the identification accuracy and detecting ability of system. How to achieve the most effective real-time monitoring and diagnosis will be the key of modern fault diagnosis and moni- toring. It has become a hot topic in the current re- search on how to detect mechanical fault in time and forecast the developing trend of equipment operation condition. It is the key of diagnostic success in how to develop a compositive system which is combined with software and hardware to achieve real-time, on-line diagnosis for mechanical drive system. The rapid development of virtual instrument technology, which introduces the mechanical fault diagnosis and testing technology into the higher level field, it is an important trend of development of testing technology Damage Fault Diagnosis System of Gear Feature Extrac- tion Time-frequency analysis High-frequency vibration Sensor pick up Data acquisition system the vibration signal Fault Di- agnosis Intelligent algorithm Impact Copyright © 2010 SciRes JSEA  Feature Extraction and Diagnosis System Using Virtual Instrument Based on CI 178 and fault diagnosis technology [15,16]. Computational Intelligence (CI), which developed from Fuzzy, AI, Neuron (a joint name “FAN”), is a burgeoning modern signal processing and control the- ory with decennary development. It is a strongly all-around advanced theory with a unique advantage which is related to many fields such as AI (artificial intelligence), Fuzzy, Neural Network, GA (genetic algorithm), Chaos, Fractal, Granular Computing, and Biomedicine. Using CI can extract coupling highly order useful features from random non-linear and non- stationary data and remove the effect of adscititious noise. It has become a brand-new method for pattern recognition and fault diagnosis of complex dynamic system, and a hot spot in current international research [17] as well. Virtual instrument (VI), a new instrument concept put forward in early 90s of 20th century, is a combi- nation of computer and instrument with a break- through for traditional instrument concept. Using ade- quately the intelligent computer-function such as com- puting, storage, playback, call, display and document management, complex information processing, it has achieved the specialized function of traditional in- strument by software. The new instrument, whose appearance and function are completely identical with the traditional hardware instruments, fully share the computer intelligence resources. It has become the developing direction of instruments and equipment. Therefore, software development is the key of the virtual instrument exploiture [18,19]. To establish a fault detection system needs to do as follows: including modern signal processing technol- ogy with artificial neural networks, support vector machines, genetic algorithms and other computational intelligence methods to extract failure feature of me- chanical systems, then diagnose the typical fault of mechanical system and establish the fault detection system [20,21]. With the investigation of fault diag- nosis system based on the virtual instrument technol- ogy and establishment of the software and hardware system of virtual instrument, which can collect signal, analyze and diagnose signal, the development of en- tire fault diagnosis system is completed. It can also achieve the on-line detection and diagnosis of failure for mechanical drive system. Consequently, a low- cost, highly intelligent, detection and diagnosis sys- tem is introduced to meet the needs of practical engi- neering. In this paper, the detection and diagnosis system based on the VI platform include two major parts, hardware and software are developed. Hardware takes PC (or platform) and I/O interface devices, as well as data acquisition cards to complete the task of signal acquisition. Software is the primary part of entire sys- temic develo pmen t to co mple te th e sign al an alys is and detection, fault diagnosis and results display. Under the support of hardware platform considering com- puter as the core, the instrument function is achieved by software programming (such as the use of MAT- LAB and C++ language, etc.) design, and multifarious testing and fault diagnosis analysis functions are achieved by the combination of different software modules of the test function. 3. Conceiving of Virtual Instrument Diagnosis System The two major characteristics of MATLAB are pow- erful matrix calculation and graphical display. It inte- grates numerical analysis, matrix computation, signal processing and graphical display into a convenient, user-friendly environment. However, some shortcom- ings of MATLAB itself restrict its application: 1) MATLAB is an interpretative language, so its real-time efficiency is very poor. 2) MATLAB program cannot run without their en- vironment, so it can not be used for commercial soft- ware development. 3) The source code of MATLAB can be seen di- rectly, so it doesn’t avail to confidentiality of algo- rithm and data. The object-oriented visual programming of VC++ is used to develop software applications from the bottom to the user-oriented software and other. By utilizing its various practical tools, developers can easily de- velop powerful high-performance Windows applica- tions program. However, in practical engineering de- velopment, compared with MATLAB: 1) VC++ is not as good as MATLAB in numerical disposal analysis and algorithms tool and other as- pects. 2) VC++ is not as good as MATLAB in accurately and expediently mapping data Graphics (data visuali- zation). Therefore, if we combine the advantage of MAT- LAB in numerical calculation, algorithm design and data visualization and other areas with VC++ applica- tion system, it can not only fully meet the need in data calculation and display of system, but also improve system efficiency and stability to reduce the difficul- ties of achieving algorithm, shorten the cycle of soft- ware development and improve software quality. It has highly valuable in practice. This system design- edly makes use of its two major characteristics to achieve analysis process, diagnose and related graph- ics display of gear vibration signal. The software, which could be run without MAT- LAB, can be developed by MATCOM transform method. VC++ is responsible to open the document Copyright © 2010 SciRes JSEA  Feature Extraction and Diagnosis System Using Virtual Instrument Based on CI179 and for the main interface, while MATLAB is respon- sible for numerical computation, signal processing and graphics display and other functions. The M-file can be converted into transferable cpp-file and relevant h-file of VC++ by MATCOM. Finally, the develop- ment of system is completed. The system, which has multi-functional interfaces, includes its chief: the main function interface, the various interfaces of gear vibration signal analysis, the various interfaces of gear vibration signal diagnosis and identification, the in- terfaces of gear vibration signal detection and moni- toring. Each interface includes corresponding sub- interface possessing functions of analysis and diagno- sis, as shown in Figure 2. 4. Exploitation of Virtual Instrument Diagnosis System The software supports to collect the vibration accel- eration signal data of gear system, including 4-channel data and 2-channel data. Because the program in sig- nal analysis interface has been converted into cpp-file and corresponding h-file, so the software can run without MATLAB software environment in the Win- dows operating system and has been successfully tested under Windows XP. 4.1 Data Acquisition System Gear system testing device is shown in Figure 3. In the figure, electromotor drive the entire system, and the coupling transfer the power to reducer gear, and after reducer export the power which pass the gear- Figure 2. Software system structure coupling and torque speed sensor, the power is trans- mitted to the magnetic loader. The common experi- ment method is via testing the vibration signal of gear box, which the sensor stick on, to test the dynamic characteristics of system and gear, however, with a large system noise, the characteristics of gear fault signal will be weakened when it reach gear box. To highlight the characteristics of test signals to minimize the effects of noise on gear failure signal, in this ex- periment the acceleration sensors should be fixed on the gear and the sensors should be near the symmetri- cal location of gear fault. Driving-gear is set as fault-gear with the use of transmission ring, because of which the signal acquired from the rotary accelera- tion sensor is transmitted out fully. Because the signal acquired from the acceleration sensor is comparatively faintly, the signal has to be amplified by amplifier to collect. In the test, by using control cabinet, we ob- serve and control the magnitude of the torque and speed, and observe the magnetic loader to control the magnitude of load given by system. The running of gear system has four levels of speed: no-load with speed of 300r/min, load 10N.m with 300r/min, load 8N.m with 900r/min, load 6N.m with 1200r/min, load 6N.m with 1500r / min. Three typical failures (crack at the gear root, crack at the gear’s ref- erence circle and the wear abrasion fault on tooth sur- face) and various composite faults are set on driv- ing-gear and tested at above four levels of speed. CRAS signal acquisition software system is used for signal acquisition and analysis, and the algorithms mentioned above are used for feature extraction and diagnosis. 4.2 The Introduction and Test of Signal The main interface is shown in Figure 4. It mainly achieves the signal acquired from the actual gear transmission testing system in order to facilitate sub- sequent analysis, identification, and diagnosis. The top column is used to show the physical address of imported data; “ChannelNum” is used to set the total channel number of data files; “Channel” is used to set the channel sequence of importing data; “DataLength” is used to display imported data length; “Fs (Hz)” is used to set the sampling frequency. After the parame- ters have been set, pressing the “InputData” button, we can open the dialog frame of data file to select the data which will be analyzed. If the data format is cor- rect, the bottom graph-displayed frame will display the waveform of the imported data, so it shows the success of importing data. The right column of buttons, whose functions and manipulations would be intro- duced one by one in the latter parts, is used for signal processing, calculation and analysis, diagnostic tests. Copyright © 2010 SciRes JSEA 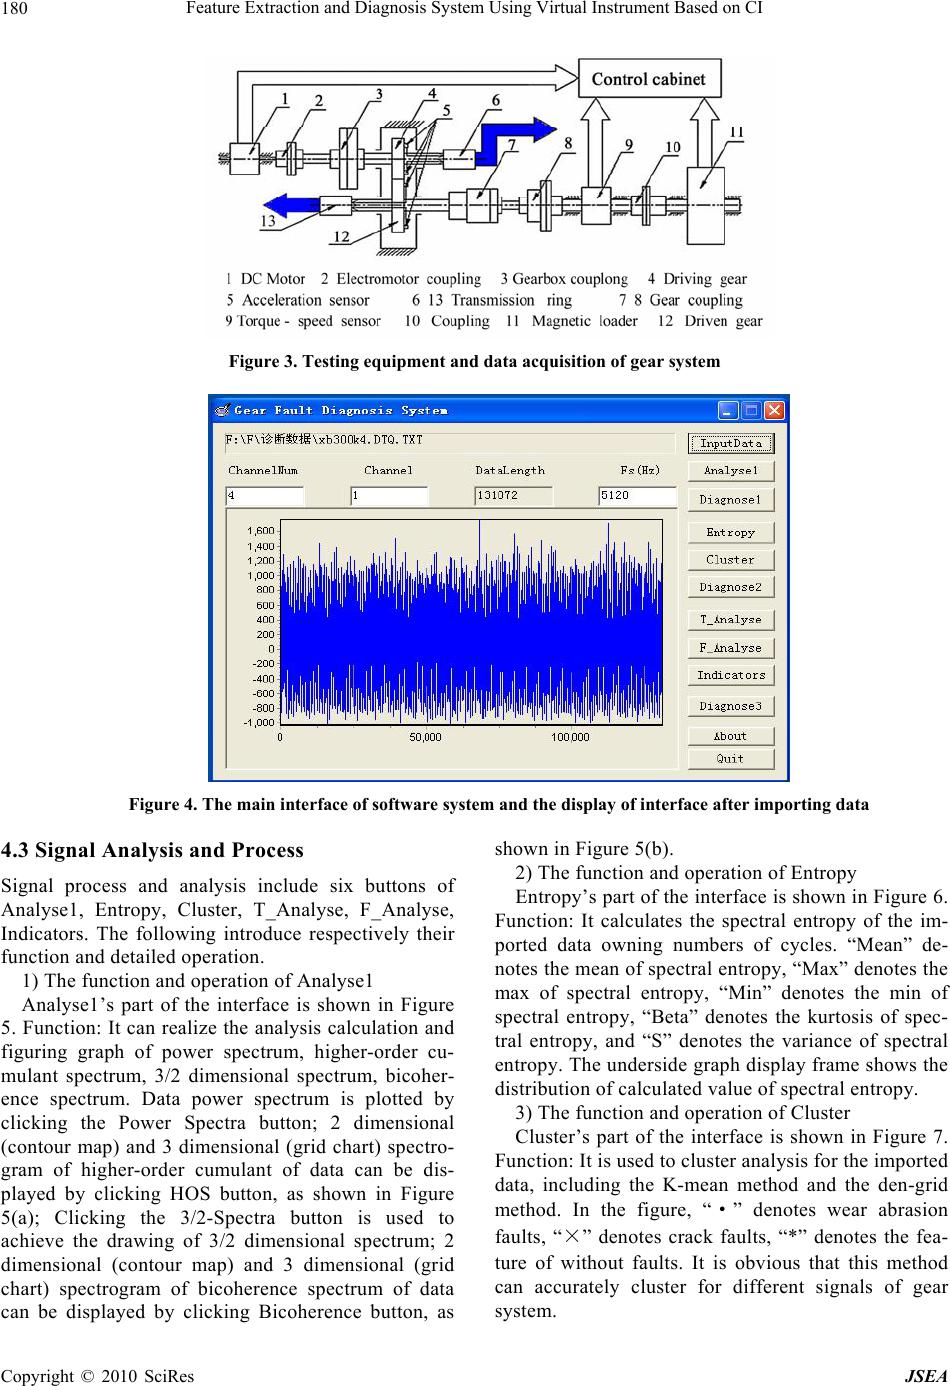 Feature Extraction and Diagnosis System Using Virtual Instrument Based on CI Copyright © 2010 SciRes JSEA 180 Figure 3. Testing equipment and data acquisition of gear system Figure 4. The main interface of software system and the display of interface after importing data 4.3 Signal Analysis and Process Signal process and analysis include six buttons of Analyse1, Entropy, Cluster, T_Analyse, F_Analyse, Indicators. The following introduce respectively their function and detailed operation. 1) The function and operation of Analyse1 Analyse1’s part of the interface is shown in Figure 5. Function: It can realize the analysis calculation and figuring graph of power spectrum, higher-order cu- mulant spectrum, 3/2 dimensional spectrum, bicoher- ence spectrum. Data power spectrum is plotted by clicking the Power Spectra button; 2 dimensional (contour map) and 3 dimensional (grid chart) spectro- gram of higher-order cumulant of data can be dis- played by clicking HOS button, as shown in Figure 5(a); Clicking the 3/2-Spectra button is used to achieve the drawing of 3/2 dimensional spectrum; 2 dimensional (contour map) and 3 dimensional (grid chart) spectrogram of bicoherence spectrum of data can be displayed by clicking Bicoherence button, as shown in Figure 5(b). 2) The function and operation of Entropy Entropy’s part of the interface is shown in Figure 6. Function: It calculates the spectral entropy of the im- ported data owning numbers of cycles. “Mean” de- notes the mean of spectral entropy, “Max” denotes the max of spectral entropy, “Min” denotes the min of spectral entropy, “Beta” denotes the kurtosis of spec- tral entropy, and “S” denotes the variance of spectral entropy. The underside graph display frame shows the distribution of calculated value of spectral entropy. 3) The function and operation of Cluster Cluster’s part of the interface is shown in Figure 7. Function: It is used to cluster analysis for the imported data, including the K-mean method and the den-grid method. In the figure, “·” denotes wear abrasion faults, “×” denotes crack faults, “*” denotes the fea- ture of without faults. It is obvious that this method can accurately cluster for different signals of gear system.  Feature Extraction and Diagnosis System Using Virtual Instrument Based on CI181 (a) Three-dimensional grid spectrum of higher-order cumulant (b) Two-dimensional con tour line of bicoherence spectrum Figure 5. The display interface of Analyse1 Figure 6. The display interface of Entropy 4) The function and operation of T_Analyse T_Analyse’s part of the interface is shown in Figure 8. Function: It displays the time-domain waveforms and probability density histogram after that the im- ported data have been amplified. 5) The function and operation of F_Analyse F_Analyse’s part of the interface is shown in Fig- ure 9. Function: To display amplitude-frequency diagram of the imported data of gear vibration signal (abscissa is the frequency, unit is Hz, ordinate is the amplitude of vibration acceleration), Power spec- trum diagram (abscissa is the frequency, unit is Hz, (a) The analysis results by K_Mean method (b) The analysis results by Den_Grid method Figure 7. The display interface of Cluster (a) Time-domain waveform (b) Probability density histogram Figure 8. The display interface of T_Analyse Copyright © 2010 SciRes JSEA 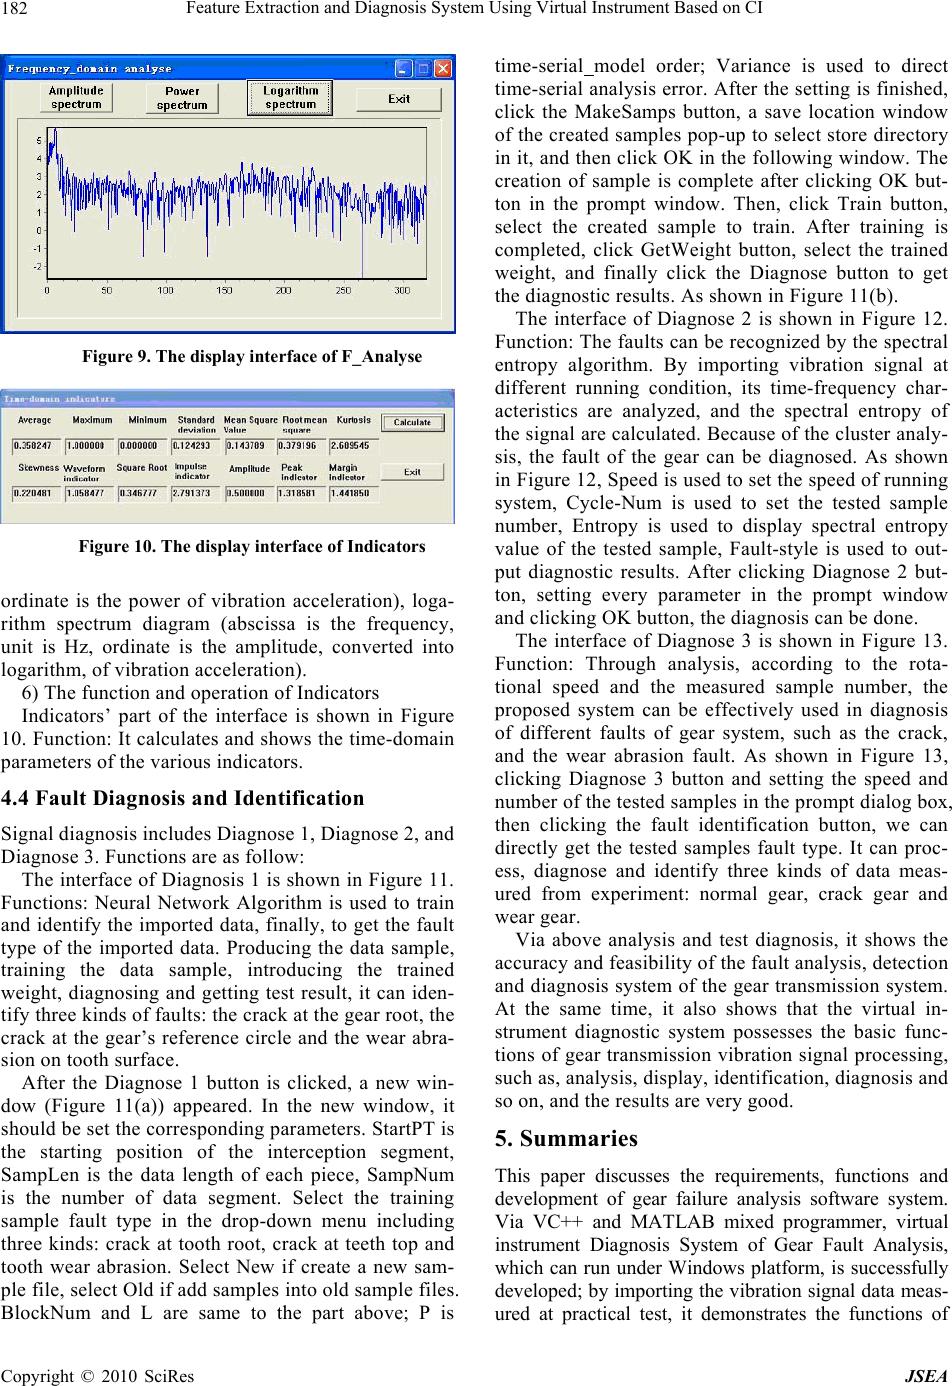 Feature Extraction and Diagnosis System Using Virtual Instrument Based on CI Copyright © 2010 SciRes JSEA 182 Figure 9. The display interface of F_Analyse Figure 10. The display interface of Indicators ordinate is the power of vibration acceleration), loga- rithm spectrum diagram (abscissa is the frequency, unit is Hz, ordinate is the amplitude, converted into logarithm, of vibration acceleration). 6) The function and operation of Indicators Indicators’ part of the interface is shown in Figure 10. Function: It calculates and shows the time-domain parameters of the various indicators. 4.4 Fault Diagnosis and Identification Signal diagnosis includes Diagnose 1, Diagnose 2, and Diagnose 3. Functions are as follow: The interface of Diagnosis 1 is shown in Figure 11. Functions: Neural Network Algorithm is used to train and identify the imported data, finally, to get the fault type of the imported data. Producing the data sample, training the data sample, introducing the trained weight, diagnosing and getting test result, it can iden- tify three kinds of faults: the crack at the gear root, the crack at the gear’s reference circle and the wear abra- sion on tooth surface. After the Diagnose 1 button is clicked, a new win- dow (Figure 11(a)) appeared. In the new window, it should be set the corresponding parameters. StartPT is the starting position of the interception segment, SampLen is the data length of each piece, SampNum is the number of data segment. Select the training sample fault type in the drop-down menu including three kinds: crack at tooth root, crack at teeth top and tooth wear abrasion. Select New if create a new sam- ple file, se lect Old if ad d sample s into old sa mple fi les. BlockNum and L are same to the part above; P is time-serial model order; Variance is used to direct time-serial analysis error. After the setting is finished, click the MakeSamps button, a save location window of the created samples pop-up to select store directory in it, and then click OK in the following window. The creation of sample is complete after clicking OK but- ton in the prompt window. Then, click Train button, select the created sample to train. After training is completed, click GetWeight button, select the trained weight, and finally click the Diagnose button to get the diagnostic results. As shown in Figure 11(b). The interface of Diagnose 2 is shown in Figure 12. Function: The faults can be recognized by the spectral entropy algorithm. By importing vibration signal at different running condition, its time-frequency char- acteristics are analyzed, and the spectral entropy of the signal are calculated. Because of the cluster analy- sis, the fault of the gear can be diagnosed. As shown in Figure 12, Speed is used to set the speed of running system, Cycle-Num is used to set the tested sample number, Entropy is used to display spectral entropy value of the tested sample, Fault-style is used to out- put diagnostic results. After clicking Diagnose 2 but- ton, setting every parameter in the prompt window and clicking OK button, the diagnosis can be done. The interface of Diagnose 3 is shown in Figure 13. Function: Through analysis, according to the rota- tional speed and the measured sample number, the proposed system can be effectively used in diagnosis of different faults of gear system, such as the crack, and the wear abrasion fault. As shown in Figure 13, clicking Diagnose 3 button and setting the speed and number of the tested samples in the prompt dialog box, then clicking the fault identification button, we can directly get the tested samples fault type. It can proc- ess, diagnose and identify three kinds of data meas- ured from experiment: normal gear, crack gear and wear gear. Via above analysis and test diagnosis, it shows the accuracy and feasibility of the fault analysis, detection and diagnosis system of the gear transmission system. At the same time, it also shows that the virtual in- strument diagnostic system possesses the basic func- tions of gear transmission vibration signal processing, such as, analysis, display, identification, diagnosis and so on, and the results are very good. 5. Summaries This paper discusses the requirements, functions and development of gear failure analysis software system. Via VC++ and MATLAB mixed programmer, virtual instrument Diagnosis System of Gear Fault Analysis, which can run under Windows platform, is successfully developed; by importing the vibration signal data meas- ured at practical test, it demonstrates the functions of 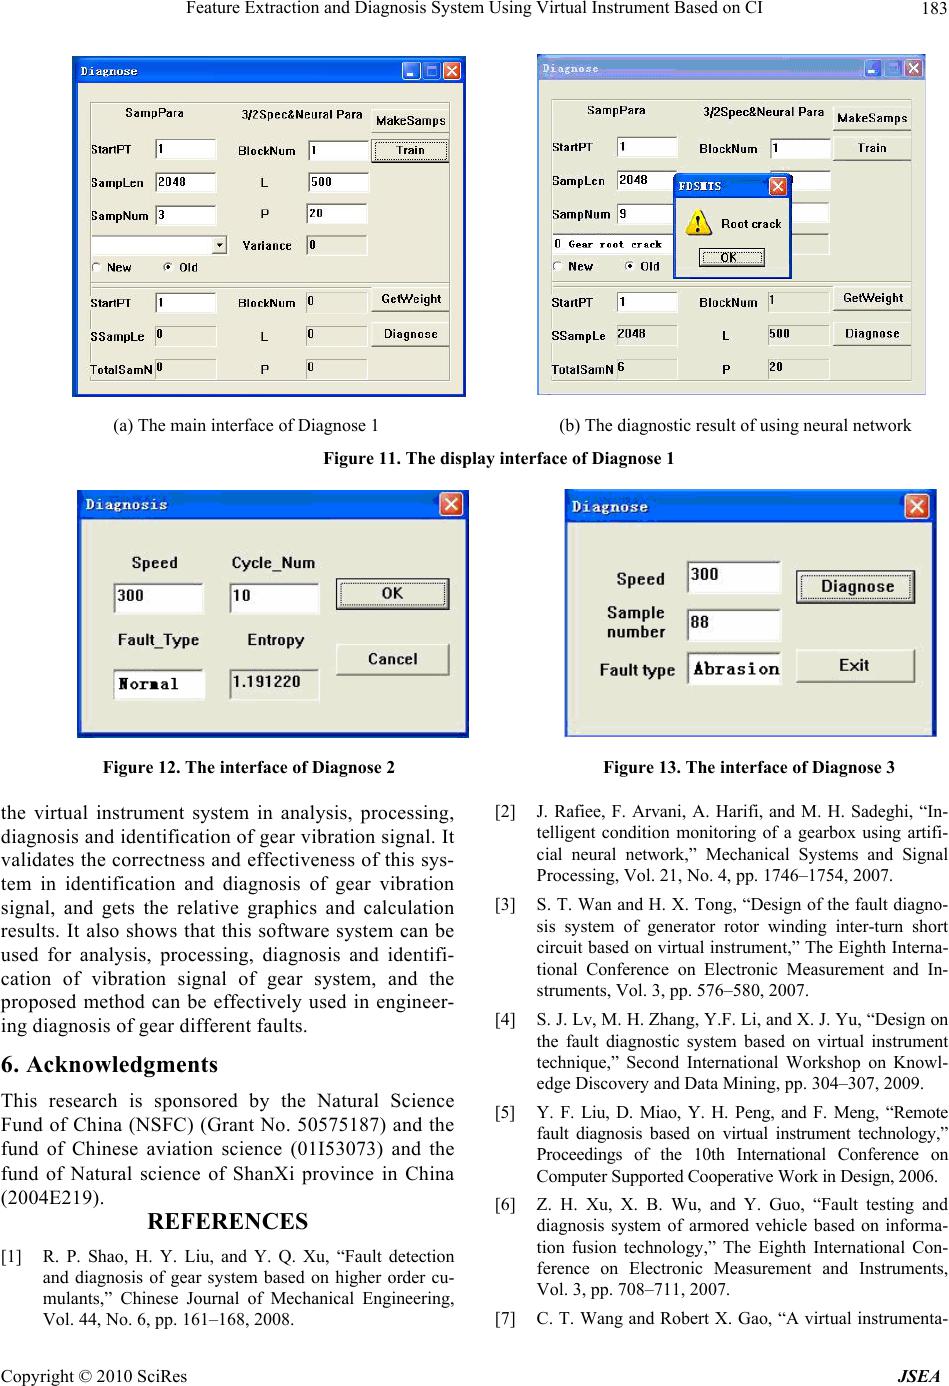 Feature Extraction and Diagnosis System Using Virtual Instrument Based on CI183 (a) The main interface of Diagnose 1 (b) The diagnostic result of using neural network Figure 11. The display interface of Diagnose 1 Figure 12. The interface of Diagnose 2 Figure 13. The interface of Diagnose 3 the virtual instrument system in analysis, processing, diagnosis and identification of gear vibration signal. It validates the correctness and effectiv eness of this sys- tem in identification and diagnosis of gear vibration signal, and gets the relative graphics and calculation results. It also shows that this software system can be used for analysis, processing, diagnosis and identifi- cation of vibration signal of gear system, and the proposed method can be effectively used in engineer- ing diagnosis of gear different faults. 6. Acknowledgments This research is sponsored by the Natural Science Fund of China (NSFC) (Grant No. 50575187) and the fund of Chinese aviation science (01I53073) and the fund of Natural science of ShanXi province in China (2004E219). REFERENCES [1] R. P. Shao, H. Y. Liu, and Y. Q. Xu, “Fault detection and diagnosis of gear system based on higher order cu- mulants,” Chinese Journal of Mechanical Engineering, Vol. 44, No. 6, pp. 161–168, 2008. [2] J. Rafiee, F. Arvani, A. Harifi, and M. H. Sadeghi, “In- telligent condition monitoring of a gearbox using artifi- cial neural network,” Mechanical Systems and Signal Processing, Vol. 21, No. 4, pp. 1746–1754, 2007. [3] S. T. Wan and H. X. Tong, “Design of the fault diagno- sis system of generator rotor winding inter-turn short circuit based on virtual instrument,” The Eighth Interna- tional Conference on Electronic Measurement and In- struments, Vol. 3, pp. 576–580, 2007. [4] S. J. Lv, M. H. Zhang, Y.F. Li, and X. J. Yu, “Design on the fault diagnostic system based on virtual instrument technique,” Second International Workshop on Knowl- edge Discovery and Data Mining, pp. 304–307, 2009. [5] Y. F. Liu, D. Miao, Y. H. Peng, and F. Meng, “Remote fault diagnosis based on virtual instrument technology,” Proceedings of the 10th International Conference on Computer Supported Cooperative Work in Design, 2006. [6] Z. H. Xu, X. B. Wu, and Y. Guo, “Fault testing and diagnosis system of armored vehicle based on informa- tion fusion technology,” The Eighth International Con- ference on Electronic Measurement and Instruments, Vol. 3, pp. 708–711, 2007. [7] C. T. Wang and Robert X. Gao, “A virtual instrumenta- Copyright © 2010 SciRes JSEA 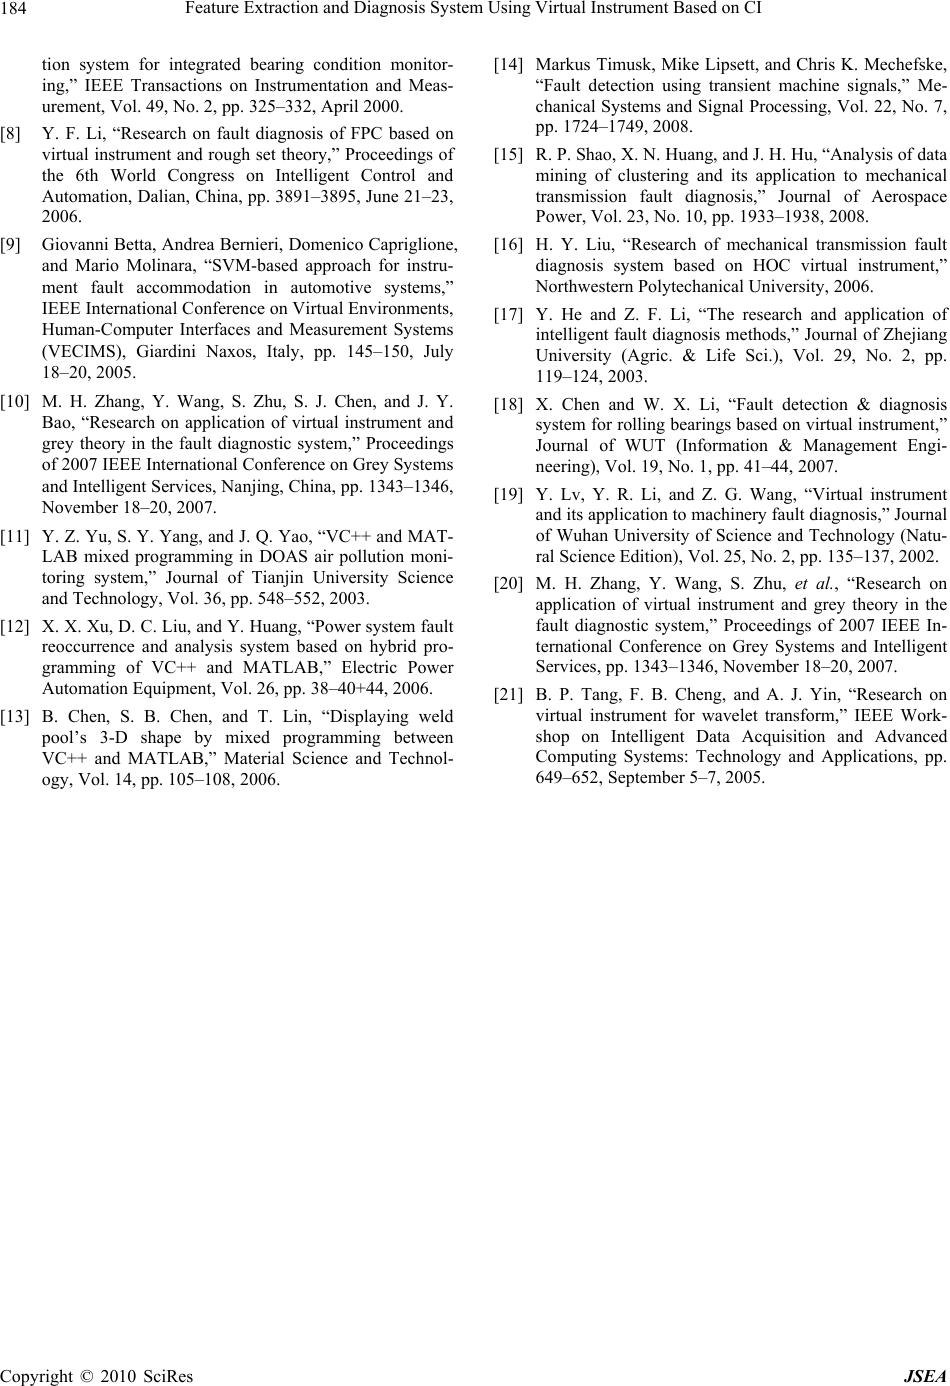 Feature Extraction and Diagnosis System Using Virtual Instrument Based on CI 184 tion system for integrated bearing condition monitor- ing,” IEEE Transactions on Instrumentation and Meas- urement, Vol. 49, No. 2, pp. 325–332, April 2000. [8] Y. F. Li, “Research on fault diagnosis of FPC based on virtual instrument and rough set theory,” Proceedings of the 6th World Congress on Intelligent Control and Automation, Dalian, China, pp. 3891–3895, June 21–23, 2006. [9] Giovanni Betta, Andrea Bernieri, Domenico Capriglione, and Mario Molinara, “SVM-based approach for instru- ment fault accommodation in automotive systems,” IEEE International Conference on Virtual Environments, Human-Computer Interfaces and Measurement Systems (VECIMS), Giardini Naxos, Italy, pp. 145–150, July 18–20, 2005. [10] M. H. Zhang, Y. Wang, S. Zhu, S. J. Chen, and J. Y. Bao, “Research on application of virtual instrument and grey theory in the fault diagnostic system,” Proceedings of 2007 IEEE International Conference on Grey Systems and Intelligent Services, Nanjing, China, pp. 1343–1346, November 18–20, 2007. [11] Y. Z. Yu, S. Y. Yang, and J. Q. Yao, “VC++ and MAT- LAB mixed programming in DOAS air pollution moni- toring system,” Journal of Tianjin University Science and Technology, Vol. 36, pp. 548–552, 2003. [12] X. X. Xu, D. C. Liu, and Y. Huang, “Power system fault reoccurrence and analysis system based on hybrid pro- gramming of VC++ and MATLAB,” Electric Power Automation Equipment, Vol. 26, pp. 38–40+44, 2006. [13] B. Chen, S. B. Chen, and T. Lin, “Displaying weld pool’s 3-D shape by mixed programming between VC++ and MATLAB,” Material Science and Technol- ogy, Vol. 14, pp. 105–108, 2006. [14] Markus Timusk, Mike Lipsett, and Chris K. Mechefske, “Fault detection using transient machine signals,” Me- chanical Systems and Signal Processing, Vol. 22, No. 7, pp. 1724–1749, 2008. [15] R. P. Shao, X. N. Huang, and J. H. Hu, “Analysis of data mining of clustering and its application to mechanical transmission fault diagnosis,” Journal of Aerospace Power, Vol. 23, No. 10, pp. 1933–1938, 2008. [16] H. Y. Liu, “Research of mechanical transmission fault diagnosis system based on HOC virtual instrument,” Northwestern Polytechanical University, 2006. [17] Y. He and Z. F. Li, “The research and application of intelligent fault diagnosis methods,” Journal of Zhejiang University (Agric. & Life Sci.), Vol. 29, No. 2, pp. 119–124, 2003. [18] X. Chen and W. X. Li, “Fault detection & diagnosis system for rolling bearings based on virtual instrument,” Journal of WUT (Information & Management Engi- neering), Vol. 19, No. 1, pp. 41–44, 2007. [19] Y. Lv, Y. R. Li, and Z. G. Wang, “Virtual instrument and its application to machinery fault diagnosis,” Journal of Wuhan University of Science and Technology (Natu- ral Science Edition), Vol. 25, No. 2, pp. 135–137, 2002. [20] M. H. Zhang, Y. Wang, S. Zhu, et al., “Research on application of virtual instrument and grey theory in the fault diagnostic system,” Proceedings of 2007 IEEE In- ternational Conference on Grey Systems and Intelligent Services, pp. 1343–1346, November 18–20, 2007. [21] B. P. Tang, F. B. Cheng, and A. J. Yin, “Research on virtual instrument for wavelet transform,” IEEE Work- shop on Intelligent Data Acquisition and Advanced Computing Systems: Technology and Applications, pp. 649–652, September 5–7, 2005. Copyright © 2010 SciRes JSEA |