Paper Menu >>
Journal Menu >>
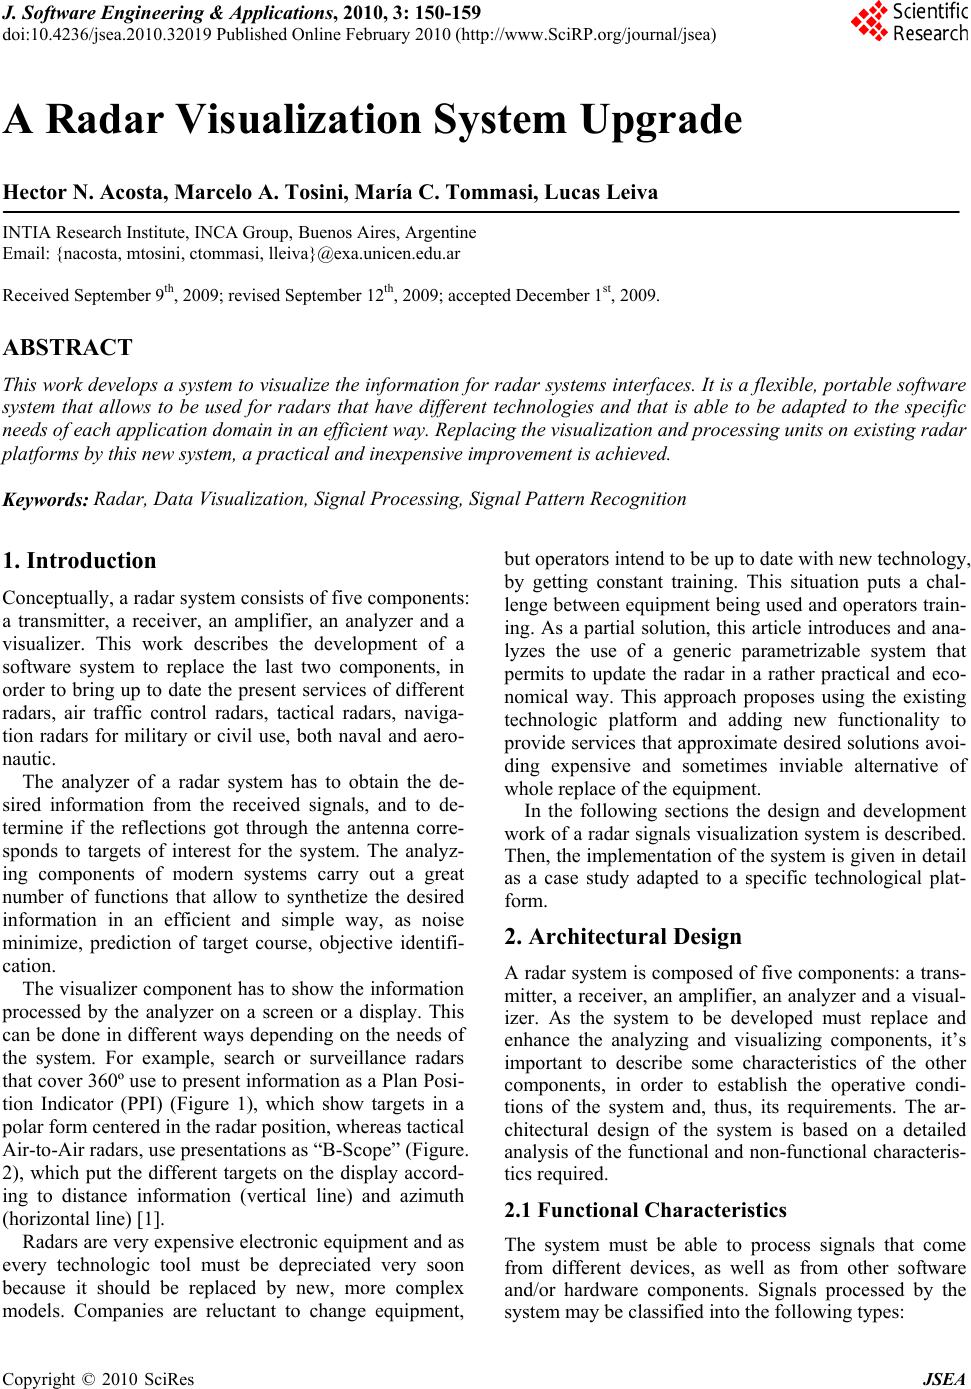 J. Software Engineering & Applications, 2010, 3: 150-159 doi:10.4236/jsea.2010.32019 Published Online February 2010 (http://www.SciRP.org/journal/jsea) Copyright © 2010 SciRes JSEA A Radar Visualization System Upgrade Hector N. Acosta, Marcelo A. Tosini, María C. Tommasi, Lucas Leiva INTIA Research Institute, INCA Group, Buenos Aires, Argentine Email: {nacosta, mtosini, ctommasi, lleiva}@exa.unicen.edu.ar Received September 9th, 2009; revised September 12th, 2009; accepted December 1st, 2009. ABSTRACT This work develops a system to visualize the information for radar systems interfaces. It is a flexible, portable software system that allows to be used for radars that have different technologies and that is able to be adapted to the specific needs of each application domain in an efficient way. Replacing the visualization and processing units on existing radar platforms by this new system, a practical and inexpensive improvement is achieved. Keywords: Radar, Data Visualization, Signal Processing, Signal Pattern Recognition 1. Introduction Conceptually, a radar system consists of five components: a transmitter, a receiver, an amplifier, an analyzer and a visualizer. This work describes the development of a software system to replace the last two components, in order to bring up to date the present services of different radars, air traffic control radars, tactical radars, naviga- tion radars for military or civil use, both naval and aero- nautic. The analyzer of a radar system has to obtain the de- sired information from the received signals, and to de- termine if the reflections got through the antenna corre- sponds to targets of interest for the system. The analyz- ing components of modern systems carry out a great number of functions that allow to synthetize the desired information in an efficient and simple way, as noise minimize, prediction of target course, objective identifi- cation. The visualizer component has to show the information processed by the analyzer on a screen or a display. This can be done in different ways depending on the needs of the system. For example, search or surveillance radars that cover 360º use to present information as a Plan Posi- tion Indicator (PPI) (Figure 1), which show targets in a polar form centered in the radar position, whereas tactical Air-to-Air radars, use presentations as “B-Scope” (Figure. 2), which put the different targets on the display accord- ing to distance information (vertical line) and azimuth (horizontal line) [1]. Radars are very expensive electronic equipment and as every technologic tool must be depreciated very soon because it should be replaced by new, more complex models. Companies are reluctant to change equipment, but operators intend to be up to date with new technology, by getting constant training. This situation puts a chal- lenge between equipment being used and operators train- ing. As a partial solution, this article introduces and ana- lyzes the use of a generic parametrizable system that permits to update the radar in a rather practical and eco- nomical way. This approach proposes using the existing technologic platform and adding new functionality to provide services that approximate desired solutions avoi- ding expensive and sometimes inviable alternative of whole replace of the equipment. In the following sections the design and development work of a radar signals visualization system is described. Then, the implementation of the system is given in detail as a case study adapted to a specific technological plat- form. 2. Architectural Design A radar system is composed of five components: a trans- mitter, a receiver, an amplifier, an analyzer and a visual- izer. As the system to be developed must replace and enhance the analyzing and visualizing components, it’s important to describe some characteristics of the other components, in order to establish the operative condi- tions of the system and, thus, its requirements. The ar- chitectural design of the system is based on a detailed analysis of the functional and non-functional characteris- tics required. 2.1 Functional Characteristics The system must be able to process signals that come from different devices, as well as from other software and/or hardware components. Signals processed by the system may be classified into the following types: 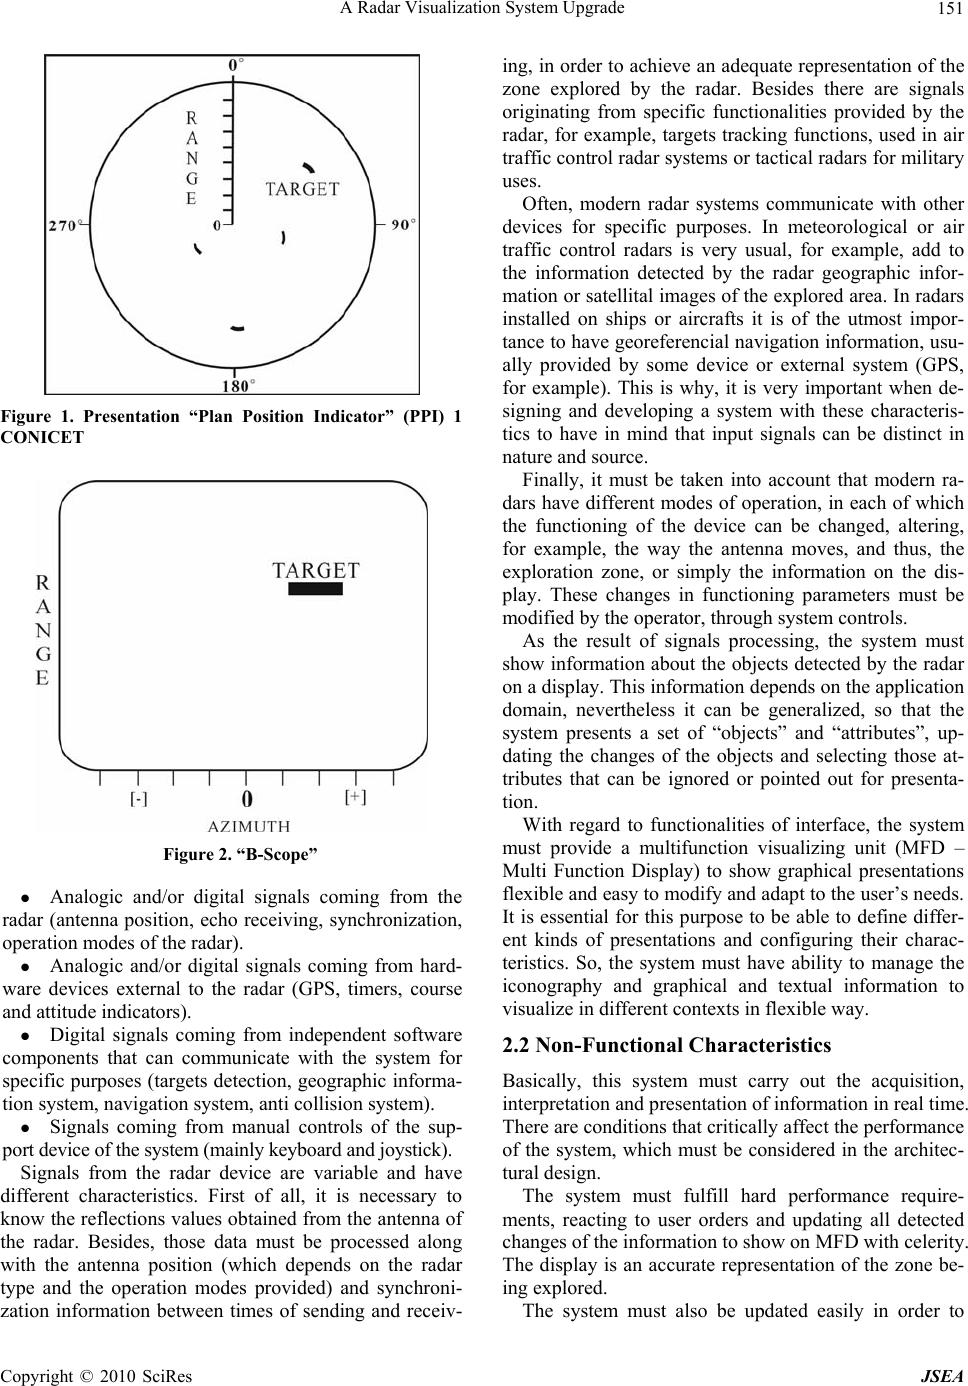 A Radar Visualization System Upgrade151 Figure 1. Presentation “Plan Position Indicator” (PPI) 1 CONICET Figure 2. “B-Scope” Analogic and/or digital signals coming from the radar (antenna position, echo receiving, synchronization, operation modes of the radar). Analogic and/or digital signals coming from hard- ware devices external to the radar (GPS, timers, course and attitude indicators). Digital signals coming from independent software components that can communicate with the system for specific purposes (targets detection, geographic informa- tion system, navigation system, anti collision system). Signals coming from manual controls of the sup- port device of the system (mainly keyboard and joystick). Signals from the radar device are variable and have different characteristics. First of all, it is necessary to know the reflections values obtained from the antenna of the radar. Besides, those data must be processed along with the antenna position (which depends on the radar type and the operation modes provided) and synchroni- zation information between times of sending and receiv- ing, in order to achieve an adequate representation of the zone explored by the radar. Besides there are signals originating from specific functionalities provided by the radar, for example, targets tracking functions, used in air traffic control radar systems or tactical radars for military uses. Often, modern radar systems communicate with other devices for specific purposes. In meteorological or air traffic control radars is very usual, for example, add to the information detected by the radar geographic infor- mation or satellital images of the explored area. In radars installed on ships or aircrafts it is of the utmost impor- tance to have georeferencial navigation information, usu- ally provided by some device or external system (GPS, for example). This is why, it is very important when de- signing and developing a system with these characteris- tics to have in mind that input signals can be distinct in nature and source. Finally, it must be taken into account that modern ra- dars have different modes of operation, in each of which the functioning of the device can be changed, altering, for example, the way the antenna moves, and thus, the exploration zone, or simply the information on the dis- play. These changes in functioning parameters must be modified by the operator, through system controls. As the result of signals processing, the system must show information about the objects detected by the radar on a display. This information depends on the application domain, nevertheless it can be generalized, so that the system presents a set of “objects” and “attributes”, up- dating the changes of the objects and selecting those at- tributes that can be ignored or pointed out for presenta- tion. With regard to functionalities of interface, the system must provide a multifunction visualizing unit (MFD – Multi Function Display) to show graphical presentations flexible and easy to modify and adapt to the user’s needs. It is essential for this purpose to be able to define differ- ent kinds of presentations and configuring their charac- teristics. So, the system must have ability to manage the iconography and graphical and textual information to visualize in different contexts in flexible way. 2.2 Non-Functional Characteristics Basically, this system must carry out the acquisition, interpretation and presentation of information in real time. There are conditions that critically affect the performance of the system, which must be considered in the architec- tural design. The system must fulfill hard performance require- ments, reacting to user orders and updating all detected changes of the information to show on MFD with celerity. The display is an accurate representation of the zone be- ing explored. The system must also be updated easily in order to Copyright © 2010 SciRes JSEA 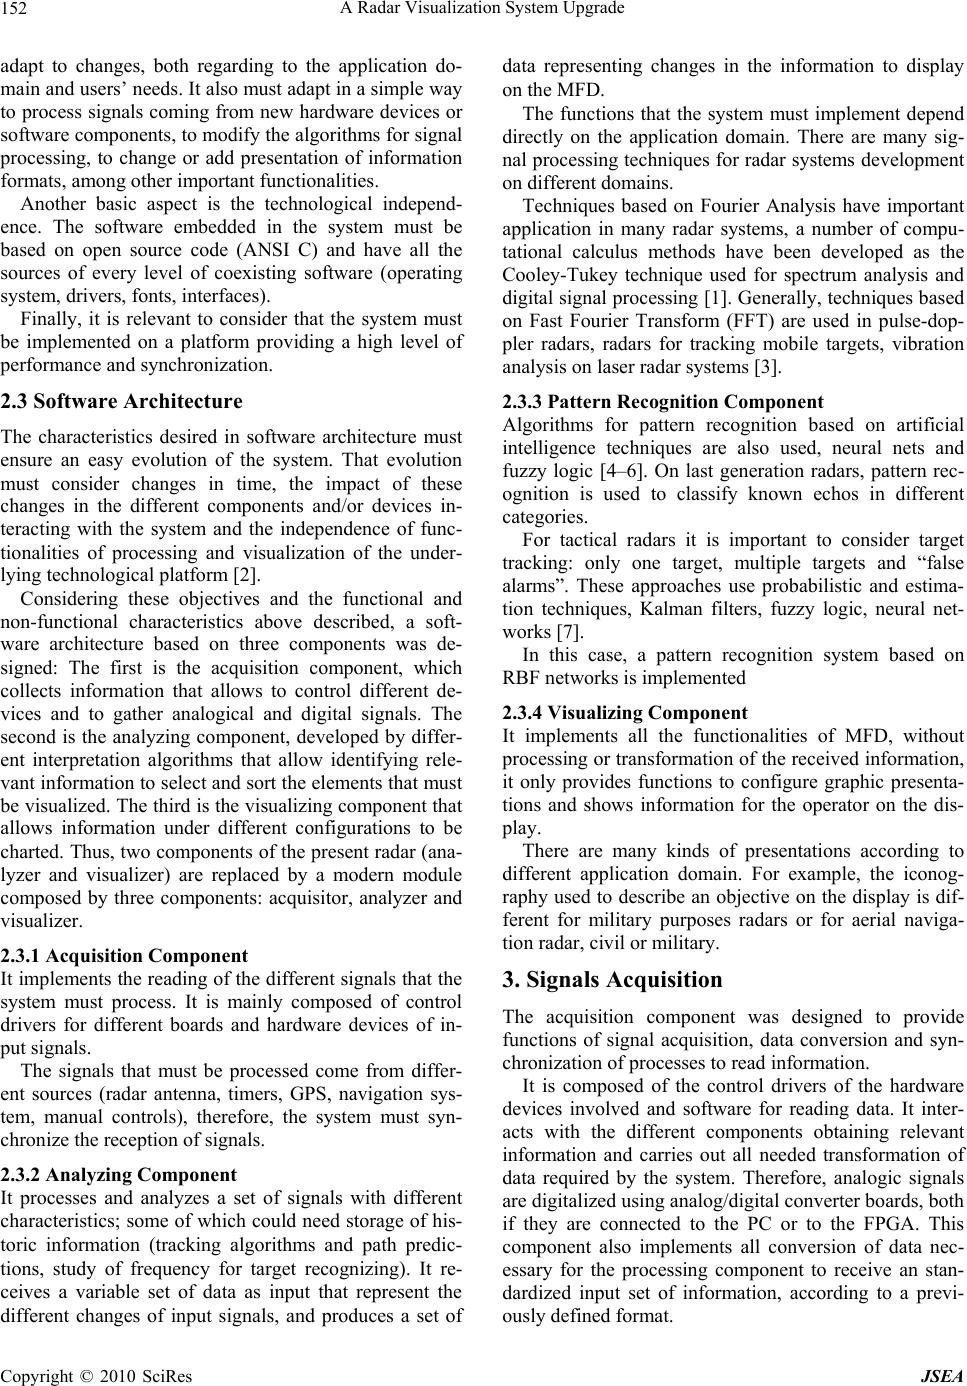 A Radar Visualization System Upgrade 152 adapt to changes, both regarding to the application do- main and users’ needs. It also must adapt in a simple way to process signals coming from new hardware devices or software components, to modify the algorithms for signal processing, to change or add presentation of information formats, among other important functionalities. Another basic aspect is the technological independ- ence. The software embedded in the system must be based on open source code (ANSI C) and have all the sources of every level of coexisting software (operating system, drivers, fonts, interfaces). Finally, it is relevant to consider that the system must be implemented on a platform providing a high level of performance and synchronization. 2.3 Software Architecture The characteristics desired in software architecture must ensure an easy evolution of the system. That evolution must consider changes in time, the impact of these changes in the different components and/or devices in- teracting with the system and the independence of func- tionalities of processing and visualization of the under- lying technological platform [2]. Considering these objectives and the functional and non-functional characteristics above described, a soft- ware architecture based on three components was de- signed: The first is the acquisition component, which collects information that allows to control different de- vices and to gather analogical and digital signals. The second is the analyzing component, developed by differ- ent interpretation algorithms that allow identifying rele- vant information to select and sort the elements that must be visualized. The third is the visualizing component that allows information under different configurations to be charted. Thus, two components of the present radar (ana- lyzer and visualizer) are replaced by a modern module composed by three components: acquisitor, analyzer and visualizer. 2.3.1 Acquisition Component It implements the reading of the different signals that the system must process. It is mainly composed of control drivers for different boards and hardware devices of in- put signals. The signals that must be processed come from differ- ent sources (radar antenna, timers, GPS, navigation sys- tem, manual controls), therefore, the system must syn- chronize the reception of signals. 2.3.2 Anal yzing Component It processes and analyzes a set of signals with different characteristics; some of which could need storage of his- toric information (tracking algorithms and path predic- tions, study of frequency for target recognizing). It re- ceives a variable set of data as input that represent the different changes of input signals, and produces a set of data representing changes in the information to display on the MFD. The functions that the system must implement depend directly on the application domain. There are many sig- nal processing techniques for radar systems development on different domains. Techniques based on Fourier Analysis have important application in many radar systems, a number of compu- tational calculus methods have been developed as the Cooley-Tukey technique used for spectrum analysis and digital signal processing [1]. Generally, techniques based on Fast Fourier Transform (FFT) are used in pulse-dop- pler radars, radars for tracking mobile targets, vibration analysis on laser radar systems [3]. 2.3.3 Pattern Recognition Component Algorithms for pattern recognition based on artificial intelligence techniques are also used, neural nets and fuzzy logic [4–6]. On last generation radars, pattern rec- ognition is used to classify known echos in different categories. For tactical radars it is important to consider target tracking: only one target, multiple targets and “false alarms”. These approaches use probabilistic and estima- tion techniques, Kalman filters, fuzzy logic, neural net- works [7]. In this case, a pattern recognition system based on RBF networks is implemented 2.3.4 Visualizing Component It implements all the functionalities of MFD, without processing or transformation of the received information, it only provides functions to configure graphic presenta- tions and shows information for the operator on the dis- play. There are many kinds of presentations according to different application domain. For example, the iconog- raphy used to describe an objective on the display is dif- ferent for military purposes radars or for aerial naviga- tion radar, civil or military. 3. Signals Acquisition The acquisition component was designed to provide functions of signal acquisition, data conversion and syn- chronization of processes to read information. It is composed of the control drivers of the hardware devices involved and software for reading data. It inter- acts with the different components obtaining relevant information and carries out all needed transformation of data required by the system. Therefore, analogic signals are digitalized using analog/digital converter boards, both if they are connected to the PC or to the FPGA. This component also implements all conversion of data nec- essary for the processing component to receive an stan- dardized input set of information, according to a previ- ously defined format. Copyright © 2010 SciRes JSEA 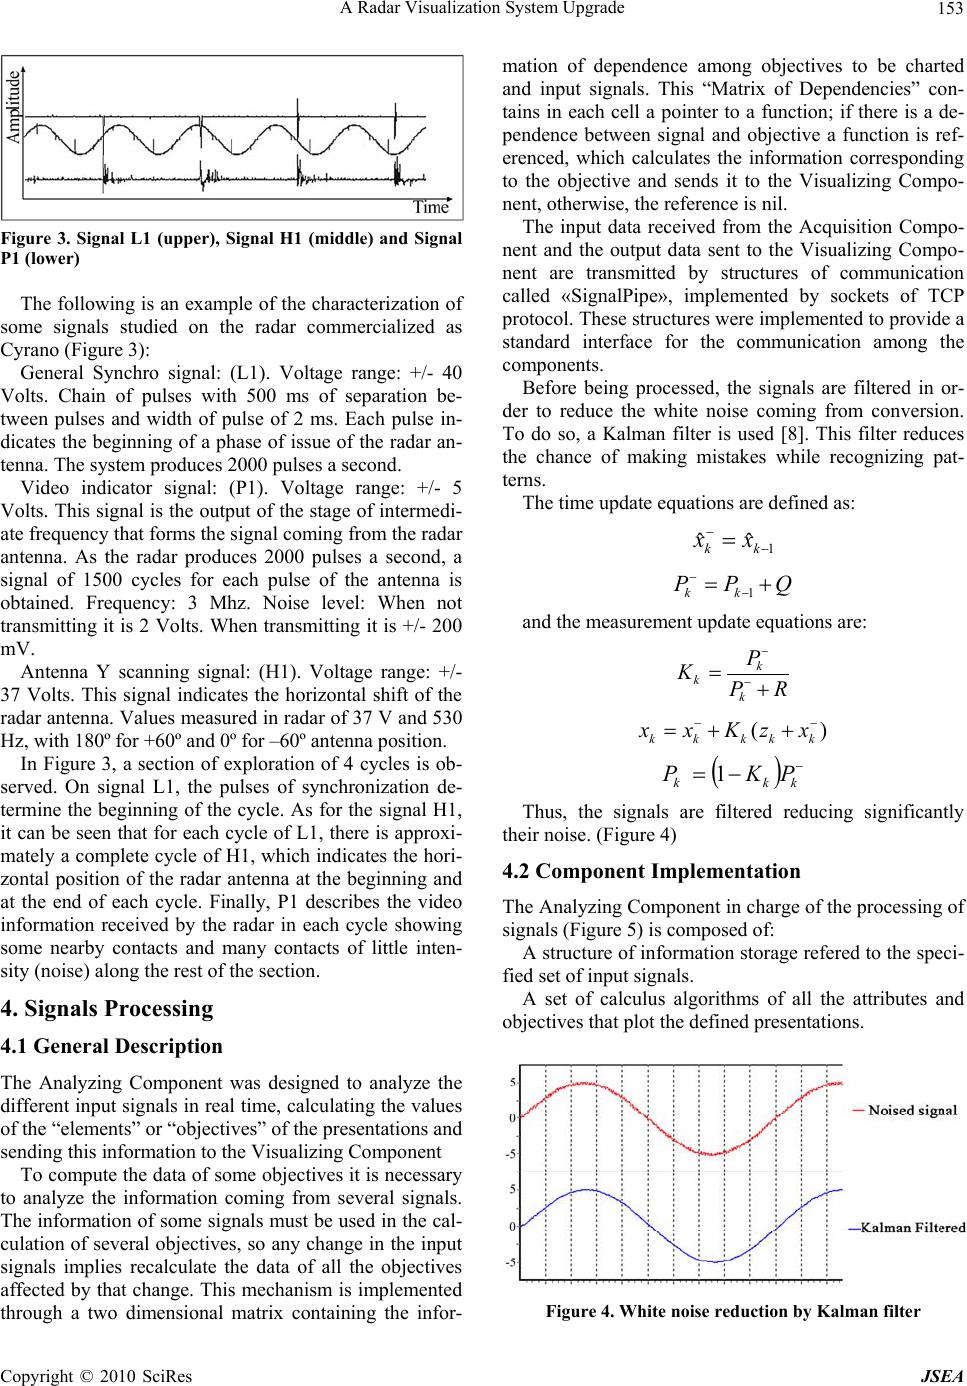 A Radar Visualization System Upgrade153 Figure 3. Signal L1 (upper), Signal H1 (middle) and Signal P1 (lower) The following is an example of the characterization of some signals studied on the radar commercialized as Cyrano (Figure 3): General Synchro signal: (L1). Voltage range: +/- 40 Volts. Chain of pulses with 500 ms of separation be- tween pulses and width of pulse of 2 ms. Each pulse in- dicates the beginning of a phase of issue of the radar an- tenna. The system produces 2000 pulses a second. Video indicator signal: (P1). Voltage range: +/- 5 Volts. This signal is the output of the stage of intermedi- ate frequency that forms the signal coming from the radar antenna. As the radar produces 2000 pulses a second, a signal of 1500 cycles for each pulse of the antenna is obtained. Frequency: 3 Mhz. Noise level: When not transmitting it is 2 Volts. When transmitting it is +/- 200 mV. Antenna Y scanning signal: (H1). Voltage range: +/- 37 Volts. This signal indicates the horizontal shift of the radar antenna. Values measured in radar of 37 V and 530 Hz, with 180º for +60º and 0º for –60º antenna position. In Figure 3, a section of exploration of 4 cycles is ob- served. On signal L1, the pulses of synchronization de- termine the beginning of the cycle. As for the signal H1, it can be seen that for each cycle of L1, there is approxi- mately a complete cycle of H1, which indicates the hori- zontal position of the radar antenna at the beginning and at the end of each cycle. Finally, P1 describes the video information received by the radar in each cycle showing some nearby contacts and many contacts of little inten- sity (noise) along the rest of the section. 4. Signals Processing 4.1 General Description The Analyzing Component was designed to analyze the different input signals in real time, calculating the values of the “elements” or “objectives” of the presentations and sending this information to the Visualizing Component To compute the data of some objectives it is necessary to analyze the information coming from several signals. The information of some signals must be used in the cal- culation of several objectives, so any change in the input signals implies recalculate the data of all the objectives affected by that change. This mechanism is implemented through a two dimensional matrix containing the infor- mation of dependence among objectives to be charted and input signals. This “Matrix of Dependencies” con- tains in each cell a pointer to a function; if there is a de- pendence between signal and objective a function is ref- erenced, which calculates the information corresponding to the objective and sends it to the Visualizing Compo- nent, otherwise, the reference is nil. The input data received from the Acquisition Compo- nent and the output data sent to the Visualizing Compo- nent are transmitted by structures of communication called «SignalPipe», implemented by sockets of TCP protocol. These structures were implemented to provide a standard interface for the communication among the components. Before being processed, the signals are filtered in or- der to reduce the white noise coming from conversion. To do so, a Kalman filter is used [8]. This filter reduces the chance of making mistakes while recognizing pat- terns. The time update equations are defined as: 1 ˆˆ kk xx QPP kk 1 and the measurement update equations are: RP P K k k k )( kkkkk xzKxx kkk PKP 1 Thus, the signals are filtered reducing significantly their noise. (Figure 4) 4.2 Component Implementation The Analyzing Component in charge of the processing of signals (Figure 5) is composed of: A structure of information storage refered to the speci- fied set of input signals. A set of calculus algorithms of all the attributes and objectives that plot the defined presentations. Figure 4. White noise reduction by Kalman filter Copyright © 2010 SciRes JSEA 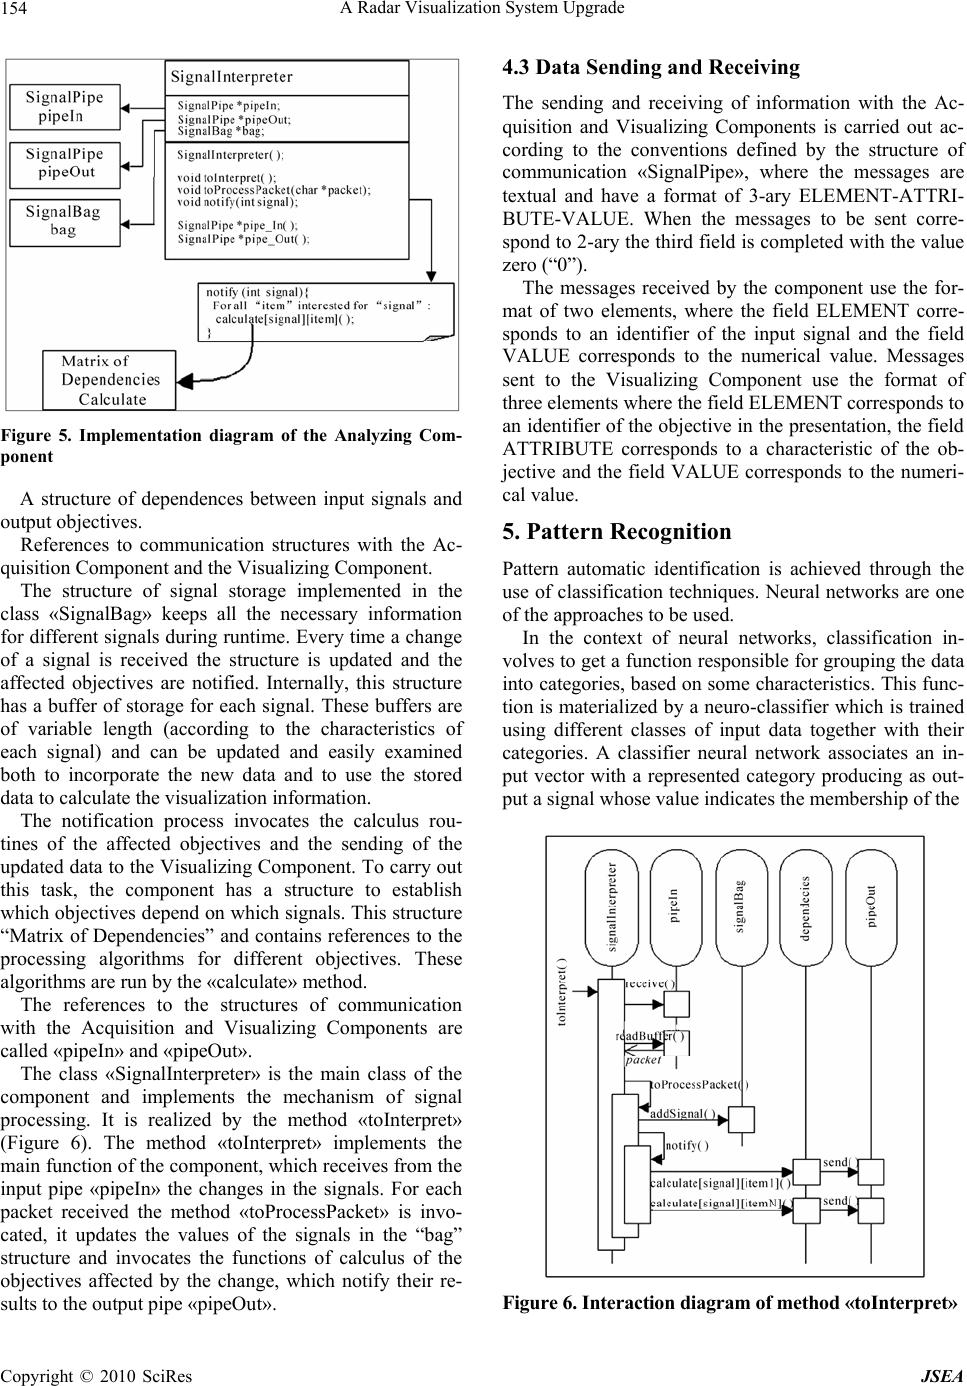 A Radar Visualization System Upgrade 154 Figure 5. Implementation diagram of the Analyzing Com- ponent A structure of dependences between input signals and output objectives. References to communication structures with the Ac- quisition Component and the Visualizing Component. The structure of signal storage implemented in the class «SignalBag» keeps all the necessary information for different signals during runtime. Every time a change of a signal is received the structure is updated and the affected objectives are notified. Internally, this structure has a buffer of storage for each signal. These buffers are of variable length (according to the characteristics of each signal) and can be updated and easily examined both to incorporate the new data and to use the stored data to calculate the visualization information. The notification process invocates the calculus rou- tines of the affected objectives and the sending of the updated data to the Visualizing Component. To carry out this task, the component has a structure to establish which objectives depend on which signals. This structure “Matrix of Dependencies” and contains references to the processing algorithms for different objectives. These algorithms are run by the «calculate» method. The references to the structures of communication with the Acquisition and Visualizing Components are called «pipeIn» and «pipeOut». The class «SignalInterpreter» is the main class of the component and implements the mechanism of signal processing. It is realized by the method «toInterpret» (Figure 6). The method «toInterpret» implements the main function of the component, which receives from the input pipe «pipeIn» the changes in the signals. For each packet received the method «toProcessPacket» is invo- cated, it updates the values of the signals in the “bag” structure and invocates the functions of calculus of the objectives affected by the change, which notify their re- sults to the output pipe «pipeOut». 4.3 Data Sending and Receiving The sending and receiving of information with the Ac- quisition and Visualizing Components is carried out ac- cording to the conventions defined by the structure of communication «SignalPipe», where the messages are textual and have a format of 3-ary ELEMENT-ATTRI- BUTE-VALUE. When the messages to be sent corre- spond to 2-ary the third field is completed with the value zero (“0”). The messages received by the component use the for- mat of two elements, where the field ELEMENT corre- sponds to an identifier of the input signal and the field VALUE corresponds to the numerical value. Messages sent to the Visualizing Component use the format of three elements where the field ELEMENT corresponds to an identifier of the objective in the presentation, the field ATTRIBUTE corresponds to a characteristic of the ob- jective and the field VALUE corresponds to the numeri- cal value. 5. Pattern Recogniti on Pattern automatic identification is achieved through the use of classification techniques. Neural networks are one of the approaches to be used. In the context of neural networks, classification in- volves to get a function responsible for grouping the data into categories, based on some characteristics. This func- tion is materialized by a neuro-classifier which is trained using different classes of input data together with their categories. A classifier neural network associates an in- put vector with a represented category producing as out- put a signal whose value indicates the membership of the Figure 6. Interaction diagram of method «toInterpret» Copyright © 2010 SciRes JSEA 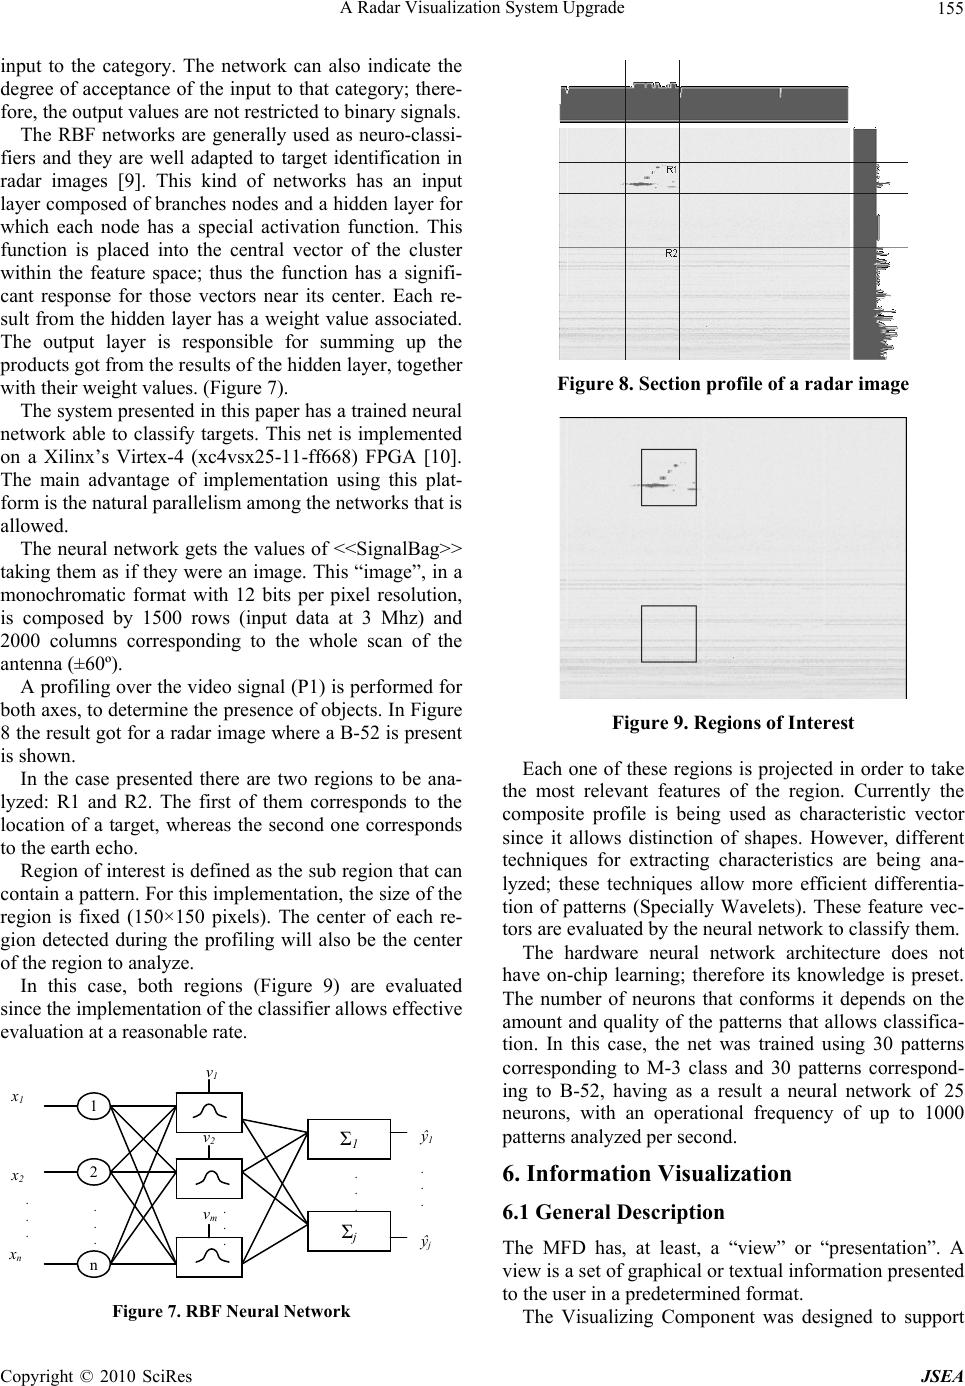 A Radar Visualization System Upgrade Copyright © 2010 SciRes JSEA 155 input to the category. The network can also indicate the degree of acceptance of the input to that category; there- fore, the output values are not restricted to binary signals. The RBF networks are generally used as neuro-classi- fiers and they are well adapted to target identification in radar images [9]. This kind of networks has an input layer composed of branches nodes and a hidden layer for which each node has a special activation function. This function is placed into the central vector of the cluster within the feature space; thus the function has a signifi- cant response for those vectors near its center. Each re- sult from the hidden layer has a weight value associated. The output layer is responsible for summing up the products got from the results of the hidden layer, together with their weight values. (Figure 7). The system presented in this paper has a trained neural network able to classify targets. This net is implemented on a Xilinx’s Virtex-4 (xc4vsx25-11-ff668) FPGA [10]. The main advantage of implementation using this plat- form is the natural parallelism among the networks that is allowed. The neural network gets the values of <<SignalBag>> taking them as if they were an image. This “image”, in a monochromatic format with 12 bits per pixel resolution, is composed by 1500 rows (input data at 3 Mhz) and 2000 columns corresponding to the whole scan of the antenna (±60º). A profiling over the video signal (P1) is performed for both axes, to determine the presence of objects. In Figure 8 the result got for a radar image where a B-52 is present is shown. In the case presented there are two regions to be ana- lyzed: R1 and R2. The first of them corresponds to the location of a target, whereas the second one corresponds to the earth echo. Region of interest is defined as the sub region that can contain a pattern. For this implementation, the size of the region is fixed (150×150 pixels). The center of each re- gion detected during the profiling will also be the center of the region to analyze. In this case, both regions (Figure 9) are evaluated since the implementation of the classifier allows effective evaluation at a reasonable rate. . . . 1 2 n . . . Σ1 Σ j . . . x1 x2 xn . . . ŷ1 ŷj . . . vm v1 v2 Figure 7. RBF Neural Network Figure 8. Section profile of a radar image Figure 9. Regions of Interest Each one of these regions is projected in order to take the most relevant features of the region. Currently the composite profile is being used as characteristic vector since it allows distinction of shapes. However, different techniques for extracting characteristics are being ana- lyzed; these techniques allow more efficient differentia- tion of patterns (Specially Wavelets). These feature vec- tors are evaluated by the neural network to classify them. The hardware neural network architecture does not have on-chip learning; therefore its knowledge is preset. The number of neurons that conforms it depends on the amount and quality of the patterns that allows classifica- tion. In this case, the net was trained using 30 patterns corresponding to M-3 class and 30 patterns correspond- ing to B-52, having as a result a neural network of 25 neurons, with an operational frequency of up to 1000 patterns analyzed per second. 6. Information Visualization 6.1 General Description The MFD has, at least, a “view” or “presentation”. A view is a set of graphical or textual information presented to the user in a predetermined format. The Visualizing Component was designed to support  A Radar Visualization System Upgrade 156 several parallel views with different formats and conven- tions that can be modified or replaced in a flexible man- ner. Two elements were defined for this purpose: «GraphicalItem» «Presentation». A «GraphicalItem» is any graphical element or textual information that must be presented in the MFD; for ex- ample, a contact, the scale rule, information of the scan- ning of the radar. A «Presentation» is basically a set of graphicable items. A presentation can be a sinusoidal graph to de- scribe the values of certain signal of the radar, a diagram of the zone explored by the radar, or else a list of nu- merical data for the operator. Those examples can be different presentations for a same situation. Each kind of presentation is more or less useful according to needs. The present design makes it possible to develop each kind of presentation in an easy and efficient way, be- cause a new presentation only takes three steps: Write an specification of the view in a file, write the code for the graphicable item and set a presentation that includes the specifications and items previously defined. 6.2 Component Implementation The Visualizing Component was developed to handle efficiently graphical and textual information given by «GraphicalItem» and organized as different kinds of screens called «Presentation» whose format is configur- able. The visual parameters that represent attributes (color, size, position) of the «GraphicalItem» must be updated in real time. These functionalities are implemented as follows: The class «RadarView» is in charge of all functions of the presentation. The class «GraphicalItem» is in charge of all functions of the items to be displayed. The formats of the presentations are specified in con- figuration files to be able to change the presentation with no need to modify or recompile the system. The changes in the information to show on the display are received through the structure of communication «SignalPipe» with the component of processing «Ana- lyzer». The class «RadarView» (Figure 10) sets the visualiz- ing format of the view obtaining the information from a previously defined configuration file. The aim of the con- figuration file is to define the formats of the representa- tion system and the iconography to be used. In runtime the configuration of the presentation is stored in an inner 2-dimensional structure called «Con- figuration» which also stores information of the modifi- cations of the presentation when there are changes in the system (change in the mode of operation of the radar, or detection of a specific objective). It is also possible to alter the format of representation in runtime by only up- dating the matrix from another configuration file. Figure 10. Implementation diagram of the class «Ra- darView» The graphical items are stored in an array called «Presentation» (Figure 6) defined from the configuration matrix, and as the data of the updating of the different graphical items are modified to provide an inner repre- sentation of the view to be presented in the MFD (changes in the location of a contact or in the mode of operation of the radar). 6.3 View Implementation A presentation is composed of a set of objective elements called “Graphical Items”. Each item is represented as an instance of the abstract class «GraphicalItem». As many of the elements to be presented on the MFD are textual information, an abstract class which defines the specific behavior of a textual graphicable item called «GText». The class «GraphicalItem» defines the behavior and properties characterizing an element of the presentation. To model a presentation it is necessary to design a class for each type of item that will compose it and these must be sub classes of «GraphicalItem». Thus, each sub class implements the behavior defined by the super class and a unified mechanism of treatment of the different graphi- cable elements is obtained. Each graphicable item is defined by a set of attributes common to all of them (name, position in the axis X, axis Y, colour) whose values are initialized from the format of representation set in the configuration matrix and they are updated in real time from the information of changes coming from the interpretation component. 6.4 View Configuration The aim of configuration mechanism through files is to offer flexibility to handle the presentation formats. This mechanism allows the system to receive all the necessary Copyright © 2010 SciRes JSEA  A Radar Visualization System Upgrade157 Figure 11. Diagram of interaction between files of configu- ration and the system information to display a presentation on the screen from a file independent from the system (Figure 11). Thus, it is possible to modify the system through the configura- tion files with no need to recompile the code. For each representation it is necessary to code an asso- ciated configuration file that includes a clear definition of the graphicable item including a predetermined presenta- tion and the values corresponding to its inner attributes. These items of the presentations enable to define views according to specific needs of each application domain. For example, an item to be defined in each pre- sentation is its background which can be a color, a map, or a satellital photograph both for a air traffic radar and a meteorological radar. The system also provides the abil- ity to present on screen textual information in different typographies and sizes, elemental graphs and images in different formats to identify a certain objective by means of a graphic representation. 7. Fine Tuning For Real Radars As a case study a system previously described was im- plemented. The software system has been completely programmed in ANSI/C, and because of the characteris- tics for handling processes and real time services, it has been implemented on Linux operating system. The cir- cuits and drivers have been completely specified by us- ing VHDL on Xilinx platform. 7.1 Signals Acquisition The technological platform used for the development was mainly based on a PC orienting the design to the definite implementation on a PC/104. As some recognition algo- rithms can not be implemented in software because of the performance requirements, coprocessors to implement these functions on FPGA were developed. Additional boards with drivers for two devices of ana- logical and digital signal acquisition were added to the PC. The former is a PCI board made by Measurement Computing, model PCI-DAS-4020/12 (Figure 12(a)). The latter is a PCI board made by Eagle Technology; model PCI-703S (Figure 12(b)). The PCI-DAS-4020/12 has 4 channels for analogical input, 2 channels for ana- logical output and 24 channels for digital I/O, with a resolution of 12 bit samples at a frequency of up to 80 Mhz. The PCI-703S has 8 channels for analogical input, 2 channels for analogical output and 8 channels for digi- tal I/O, with a resolution of 14 bits samples at a fre- quency of up to 400 Khz. The complex signal acquisition is made through FPG- As which realize a preprocessing to filter the analogical pulses and to recognize useful signal patterns. The FPGAs used are: Virtex-4 XC4VLX25 (Figure 13(a)) of Xilinx [11] of 24192 equivalent cells, 168 KB of RAM, 448 I/O pins and 48 DSPs which enables the operation as an analogical/digital conversor of signals of up to 105 Mhz with 14 bits of resolution per sampling [12]. The other FPGA is the Virtex-2 PRO XC2VP30 of Xilinx of 30816 equivalent cells, 428 KB of RAM and 644 I/O pins (Figure 13(b)). 7.2 Signal Processing The algorithms of signal interpretation are realized on the two working platforms, both on the PC and by electronic circuits of specific application (FPGA) operating as pre- processors. All the operations previous to the visualization, noise filtering, identification of possible objectives and calculus (a) (b) Figure 12. PCI-DAS-4020/12 (a) and PCI-703S (b) (a) (b) Figure 13. Left Virtex-4 XC4VLX25 (a) and Right Virtex-2 PRO XC2VP30 (b) Copyright © 2010 SciRes JSEA  A Radar Visualization System Upgrade 158 of distances from the identified objectives are realized on the PC. Owing to the high frequency of sampling of some sig- nals and the high cost of processing in real time, it is necessary the inclusion of dedicated hardware for the processing of signals such as video, synchronisms, te- lemetry marks (tracking) and others. These signals pro- vide the system with detailed information of targets, times and distances with precision of the order of micro- seconds. Such detailed analysis can not be made through software algorithms on the PC owing to the real time requirements. The analysis and interpretation by hardware is materi- alized on devices of programmable logic or FPGAs that enable the synthesis of dedicated hardware circuits pro- grammed in VHDL. The designed component behaves as a dedicated coprocessor of signals. (a) Neuron structure (b) Interconnection among neurons Figure 14. Neuron structure and interconnection among neurons This subsystem provides functions such as target rec- ognition on a radar echo, search for determined targets in zones of radar echo (in a determined range of distance) and position of the telemetry mark. This function is im- plemented on dedicated hardware because it is a short- amplitude high-frequency pulse whose detection through software is complex and expensive. Target recognition is implemented from a simplified and modified version of a Radial Basis Function Neural Networks (RBFNN) based on the neuronal processor ZISC78 [4–6,13–15] of IBM (Figure 14) which detects similarities between the information from the radar ech- oes and a variable set of training patterns representing the profiles of different objectives on the radar. In this neuronal architecture each pattern representing a wave profile of an object is stored as a prototype in each neuron. Evaluating all the neurons in parellel the one having the prototype with a certain margin of simi- larity reacts sending a code to the controller of the net representing the belonging of the pattern to a determined category. Representing with characteristic prototypes the different objects to be recognized it is possible to detect them in each radar echo. 7.3 Data Visualization Different presentations have been programmed and put into practice. Most of them are variations of the presenta- tions type B which locate on the display different identi- fied objectives on a cartesian representation according to the information of distance (axis Y) and azimuth (axis X) (Figure 15(a)). Presentations type A were also imple- mented, these show on the display a cartesian representa- tion according to the information of amplitude of the signals received through the antenna (axis Y) and dis- tance (axis X) [1] (Figure 15(b)). 8. Acknowledgments We thank F. Oyarbide, F. Cutropía, L. Burgos, R. Cela, and C. Mayol, Redimec SRL staff. We are also grateful for the financial collaboration of Redimec SRL, National Agency of Scientific and Technological Promotion through the ANR 111/03 granted to Redimec SRL for the development of part of this project, Commission of Sci- entific Investigations of Buenos Aires Province for the scholarship to Martín F.Mezzanotte and all the technical staff of the institutions that have allowed us to work with their equipment. 9. Conclusions Based on the tests made it is possible to conclude that the system developed can be successfully applied to different systems of existing radars to implement changes, updat- ings or improving with different adaptation grades and costs. This software was used on a Panel PC (Figure 16). [16]. Copyright © 2010 SciRes JSEA  A Radar Visualization System Upgrade Copyright © 2010 SciRes JSEA 159 (a): Presentation “A” (b): Presentation “B” Figure 15. Two kinds of radar displays Figure 16. System tested on Panel PC with a LCD 12.1" TFT The proposed architecture proved satisfactory to guar- antee the fullfillment of functional and nonfunctional requirements. Anyway it is critical to apply this system on different technological platforms to test the function- alities in different application domains. In a short time it is important to implement different signal processing algorithms. First, automatic recognition and tracking of objectives and/or paths algorithms must be developed. The development of new presentations is also impor- tant since allows to adapt the present system to new and different application domains. REFERENCES [1] S. A. Hovanessian, “Radar detection and tracking sys- tems,” Artech House, Inc., 1973. [2] L. Sha, et al., “Evolving dependable real-time systems,” Technical Report CMS/SEI95 -TR-005, CMU, Software Engineering Institute, 1995. [3] J. R. Y. Johnson and R. W. Johnson, “Challenges of computing the fast fourier transform,” Optimized Portable Application Libraries (OPAL) Workshop, Kansas City, Junio de 1997. [4] G. Noone, “Radar pulse train parameter estimation and tracking using neural networks, in proc,” IEEE AN- NES’95, IEEE, November 1995. [5] E. Mingolla, W. Ross, and S. Grossberg, “A neural net- work for enhancing boundaries and surfaces in synthetic aperture radar images,” Neural Networks 1999; 12 499—511. [6] R. C. Krishnamohan and P. S. Mmoharir, “Radar signal design problem with neural network processing,” Sad- hana, Vol. 26, Part 3, pp. 237–241, June 2001. [7] R Perry, et al., “Trellis structure approach to multitarget tracking. adaptive sensor array processing workshop,” Marzo de 1999, MIT Lincoln Laboratory. [8] G. Welch and G Bishop, “An introduction to the Kalman filter,” Technical Report: TR95-041, University of North Carolina, 1995. [9] Q. Zhao and Z. Bao, “Radar target recognition using a radial basis function,” Neural Networks, Vol. 9, No. 4, pp. 709–720, Elsevier, 1996. [10] Xilinx, Inc., Virtex-4 User Guide V2.2, www.xilinx.com, 2007. [11] Xilinx, Ltd., Virtex-4 Family Overview, DS112 (V2.0), January 23, 2007. [12] K. Chapman, Pico Blaze—Amplifier and A/D converter control for Spartan-3E Starter Kit, Xilinx Ltd, February 23, 2006. [13] Solanki Gautam V., Neural network and its application in pattern recognition, Seminar Report, Indian Institute of Technology, 2004. [14] Y. H, Liao, Neural networks in hardware: a survey, De- partment of Computer Science, University of California, 2001. [15] Silicon Recognition, 1150 Industrial Avenue, Suite C, Petaluma, CA 94952, URL: www.silirec.com. [16] Acosta et al., “Desarrollo de un Visualizador de Señales de Radar,” CACIC, October 2006, San Luis, Argentina. |