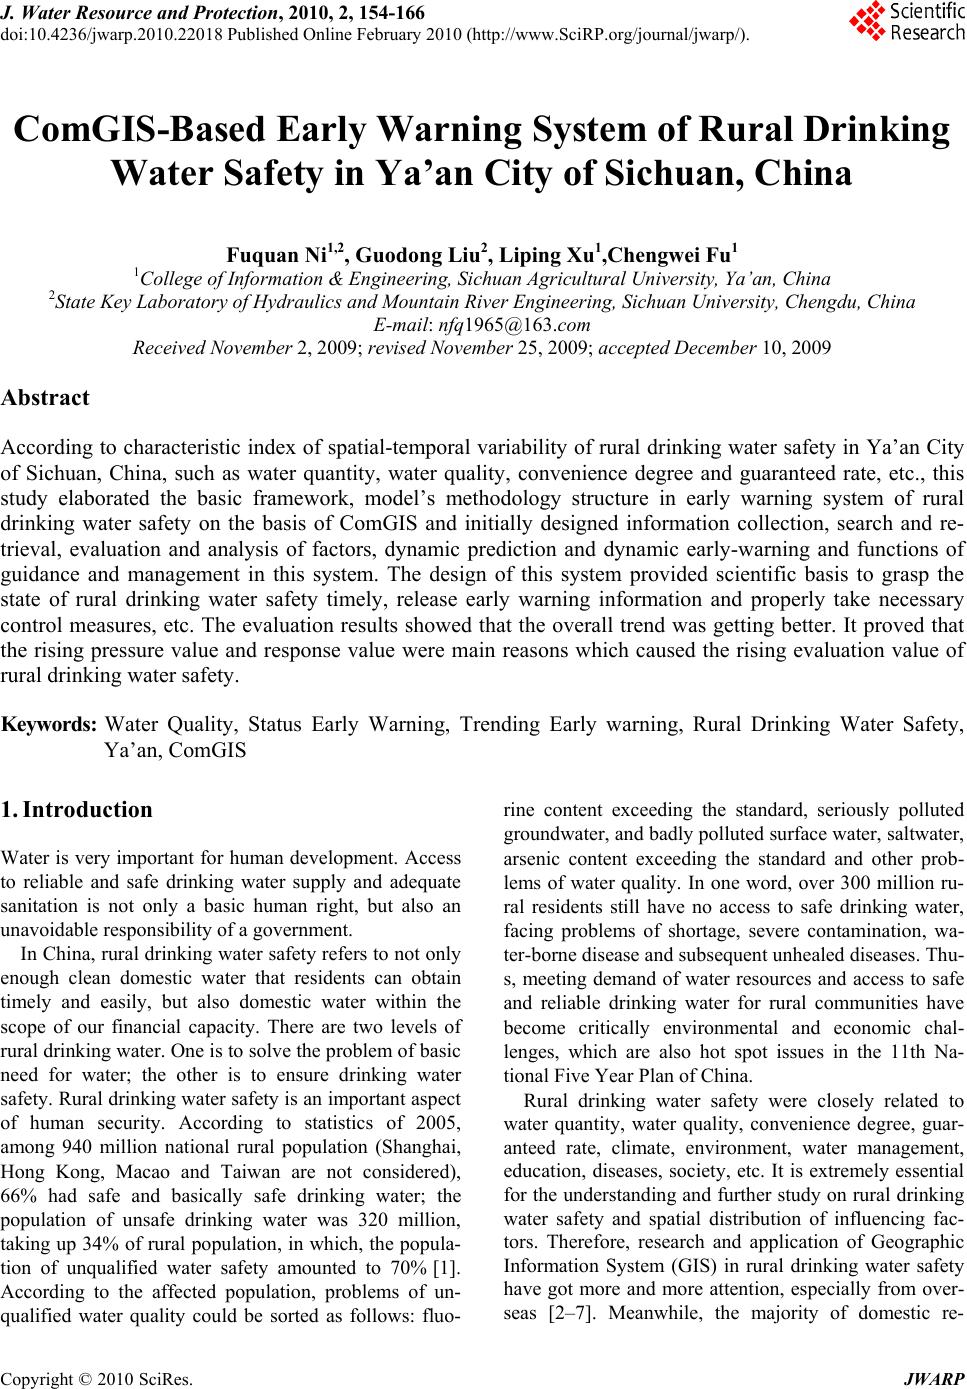
 J. Water Resource and Protection, 2010, 2, 154-166 doi:10.4236/jwarp.2010.22018 Published Online February 2010 (http://www.SciRP.org/journal/jwarp/). Copyright © 2010 SciRes. JWARP ComGIS-Based Early Warning System of Rural Drinking Water Safety in Ya’an City of Sichuan, China Fuquan Ni1,2, Guodong Liu2, Liping Xu1,Chengwei Fu1 1College of Information & Engineering, Sichuan Agricultural University, Ya’an, China 2State Key Laboratory of Hydraulics and Mountain River Engineering, Sichuan University, Chengdu, China E-mail: nfq1965@163.com Received November 2, 2009; revised November 25, 2009; accepted December 10, 2009 Abstract According to characteristic index of spatial-temporal variability of rural drinking water safety in Ya’an City of Sichuan, China, such as water quantity, water quality, convenience degree and guaranteed rate, etc., this study elaborated the basic framework, model’s methodology structure in early warning system of rural drinking water safety on the basis of ComGIS and initially designed information collection, search and re- trieval, evaluation and analysis of factors, dynamic prediction and dynamic early-warning and functions of guidance and management in this system. The design of this system provided scientific basis to grasp the state of rural drinking water safety timely, release early warning information and properly take necessary control measures, etc. The evaluation results showed that the overall trend was getting better. It proved that the rising pressure value and response value were main reasons which caused the rising evaluation value of rural drinking water safety. Keywords: Water Quality, Status Early Warning, Trending Early warning, Rural Drinking Water Safety, Ya’an, ComGIS 1. Introduction Water is very important for human development. Access to reliable and safe drinking water supply and adequate sanitation is not only a basic human right, but also an unavoidable responsibility of a government. In China, rural drinking water safety refers to not only enough clean domestic water that residents can obtain timely and easily, but also domestic water within the scope of our financial capacity. There are two levels of rural drinking water. One is to solve the problem of basic need for water; the other is to ensure drinking water safety. Rural drinking water safety is an important aspect of human security. According to statistics of 2005, among 940 million national rural population (Shanghai, Hong Kong, Macao and Taiwan are not considered), 66% had safe and basically safe drinking water; the population of unsafe drinking water was 320 million, taking up 34% of rural population, in which, the popula- tion of unqualified water safety amounted to 70% [1]. According to the affected population, problems of un- qualified water quality could be sorted as follows: fluo- rine content exceeding the standard, seriously polluted groundwater, and badly polluted surface water, saltwater, arsenic content exceeding the standard and other prob- lems of water quality. In one word, over 300 million ru- ral residents still have no access to safe drinking water, facing problems of shortage, severe contamination, wa- ter-borne disease and subsequent unhealed diseases. Thu- s, meeting demand of water resources and access to safe and reliable drinking water for rural communities have become critically environmental and economic chal- lenges, which are also hot spot issues in the 11th Na- tional Five Year Plan of China. Rural drinking water safety were closely related to water quantity, water quality, convenience degree, guar- anteed rate, climate, environment, water management, education, diseases, society, etc. It is extremely essential for the understanding and further study on rural drinking water safety and spatial distribution of influencing fac- tors. Therefore, research and application of Geographic Information System (GIS) in rural drinking water safety have got more and more attention, especially from over- seas [2–7]. Meanwhile, the majority of domestic re- 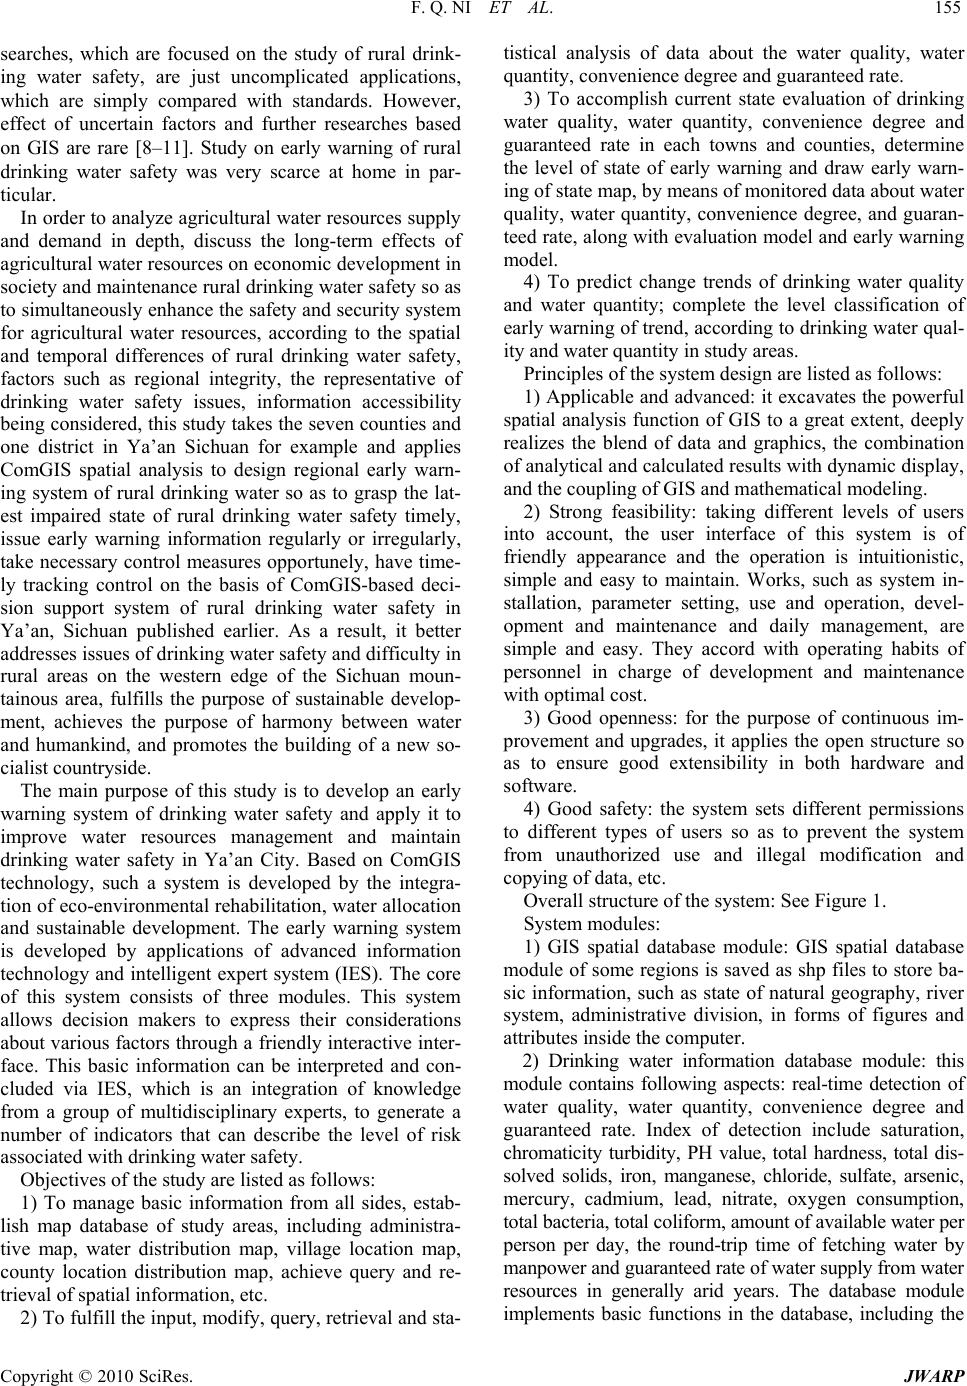 F. Q. NI ET AL. 155 searches, which are focused on the study of rural drink- ing water safety, are just uncomplicated applications, which are simply compared with standards. However, effect of uncertain factors and further researches based on GIS are rare [8–11]. Study on early warning of rural drinking water safety was very scarce at home in par- ticular. In order to analyze agricultural water resources supply and demand in depth, discuss the long-term effects of agricultural water resources on economic development in society and maintenance rural drinking water safety so as to simultaneously enhance the safety and security system for agricultural water resources, according to the spatial and temporal differences of rural drinking water safety, factors such as regional integrity, the representative of drinking water safety issues, information accessibility being considered, this study takes the seven counties and one district in Ya’an Sichuan for example and applies ComGIS spatial analysis to design regional early warn- ing system of rural drinking water so as to grasp the lat- est impaired state of rural drinking water safety timely, issue early warning information regularly or irregularly, take necessary control measures opportunely, have time- ly tracking control on the basis of ComGIS-based deci- sion support system of rural drinking water safety in Ya’an, Sichuan published earlier. As a result, it better addresses issues of drinking water safety and difficulty in rural areas on the western edge of the Sichuan moun- tainous area, fulfills the purpose of sustainable develop- ment, achieves the purpose of harmony between water and humankind, and promotes the building of a new so- cialist countryside. The main purpose of this study is to develop an early warning system of drinking water safety and apply it to improve water resources management and maintain drinking water safety in Ya’an City. Based on ComGIS technology, such a system is developed by the integra- tion of eco-environmental rehabilitation, water allocation and sustainable development. The early warning system is developed by applications of advanced information technology and intelligent expert system (IES). The core of this system consists of three modules. This system allows decision makers to express their considerations about various factors through a friendly interactive inter- face. This basic information can be interpreted and con- cluded via IES, which is an integration of knowledge from a group of multidisciplinary experts, to generate a number of indicators that can describe the level of risk associated with drinking water safety. Objectives of the study are listed as follows: 1) To manage basic information from all sides, estab- lish map database of study areas, including administra- tive map, water distribution map, village location map, county location distribution map, achieve query and re- trieval of spatial information, etc. 2) To fulfill the input, modify, query, retrieval and sta- tistical analysis of data about the water quality, water quantity, convenience degree and guaranteed rate. 3) To accomplish current state evaluation of drinking water quality, water quantity, convenience degree and guaranteed rate in each towns and counties, determine the level of state of early warning and draw early warn- ing of state map, by means of monitored data about water quality, water quantity, convenience degree, and guaran- teed rate, along with evaluation model and early warning model. 4) To predict change trends of drinking water quality and water quantity; complete the level classification of early warning of trend, according to drinking water qual- ity and water quantity in study areas. Principles of the system design are listed as follows: 1) Applicable and advanced: it excavates the powerful spatial analysis function of GIS to a great extent, deeply realizes the blend of data and graphics, the combination of analytical and calculated results with dynamic display, and the coupling of GIS and mathematical modeling. 2) Strong feasibility: taking different levels of users into account, the user interface of this system is of friendly appearance and the operation is intuitionistic, simple and easy to maintain. Works, such as system in- stallation, parameter setting, use and operation, devel- opment and maintenance and daily management, are simple and easy. They accord with operating habits of personnel in charge of development and maintenance with optimal cost. 3) Good openness: for the purpose of continuous im- provement and upgrades, it applies the open structure so as to ensure good extensibility in both hardware and software. 4) Good safety: the system sets different permissions to different types of users so as to prevent the system from unauthorized use and illegal modification and copying of data, etc. Overall structure of the system: See Figure 1. System modules: 1) GIS spatial database module: GIS spatial database module of some regions is saved as shp files to store ba- sic information, such as state of natural geography, river system, administrative division, in forms of figures and attributes inside the computer. 2) Drinking water information database module: this module contains following aspects: real-time detection of water quality, water quantity, convenience degree and guaranteed rate. Index of detection include saturation, chromaticity turbidity, PH value, total hardness, total dis- solved solids, iron, manganese, chloride, sulfate, arsenic, mercury, cadmium, lead, nitrate, oxygen consumption, total bacteria, total coliform, amount of available water per person per day, the round-trip time of fetching water by manpower and guaranteed rate of water supply from water resources in generally arid years. The database module implements basic functions in the database, including the Copyright © 2010 SciRes. JWARP  F. Q. NI ET AL. Copyright © 2010 SciRes. JWARP 156 System structure GIS spatial database module Administrative division Road distribution Water system distribution Town distribution County distribution Early warning module Early warning of state Evaluation level of each component Evaluation level of all components State estimation Level of early warning of state Early warning of trend Change trends of single component Trend of integrated index Level of early warning of trend Drinking water information database module Guaranteed rate Convenience degree Water quantity Water quality Figure 1. Overall structure for early warning of rural drinking water safety. quality standards, in which, 23,800 residents lived with opening of data files, the adding, delete, refresh, sorting, filtering of data, printing reports and positioning. water exceeding the standard fluoride content, 15,700 residents suffered from brackish water, 31,100 residents lived with IV-level or above IV-level untreated surface water, 171,400 residents took untreated surface water with bacteriological index seriously exceeding the stan- dards, 10,400 residents suffered from the untreated un- derground water with heavy pollution, and 69,600 resi- dents took the water with other index exceeding the standards (mainly including Glauber’s salt, Fe, Mn and mineral). 551,000 residents suffered from water shortage, 142,800 residents suffered from the inconvenience of water supply, and guaranteed rate of source of water that didn’t reach the standards affected 61,000 residents [12]. 3) Early warning module: this module is the core of early warning system of rural drinking water safety. It mainly implements functions of model call, computing, outputs of results, etc. By the development of application model (using VB, C++ and other languages), it implements the assessing, forecasting and early warning of rural drinking water safety. 2. Material and Methods 2.1. Overview of the Study Area The eco-hydrological characteristics of the seven counties and one district of Ya’an City are listed as fol- lows: Ya'an City is located in the western part of Sichuan Province, China, and belongs to mountainous area of western margin in Sichuan Basin. It is a transitional area between Sichuan Basin and Qinghai-Tibetan Plateau with seven counties and one district. With the develop- ment of industry and agriculture and the effect of human activities, water pollution of Qingyi River in Ya’an City is getting worse day by day. There are two types of water pollution in rural areas of Ya’an: one is the schisto- some-affected areas of Lushan County and Tianquan County, where source of water is polluted by oncome- lania; the other is the river pollution caused by the ag- gravation of human activities, forest devastation and fer- tilizer and pesticide abuse in agricultural production, which all affected human life and drinking water produc- tion. According to the investigation and statistics, 580,200 residents didn’t get safe drinking water, ac- counting for 46.77% of agricultural population. About Average annual precipitation of Lushan County amounted to 1313mm. Water consumption and guaran- teed rate of rural residents are relatively high. This area was schwastosoma area and raw water was heavily pol- luted by schistosoma. The population density was 80/ km2 and the proportion of cultivated land was 2.88%. It belonged to areas moderately influenced by human ac- tion and human impacts on this area were relatively no- table; As for Tianquan County, average annual rainfall was 1660mm, percentage of forest cover was 50.23%, gross amount of water resources amounted to 6.714 billion cubic meters, and the amount per capita was 2724 cubic meters. Drinking water quality was dominated by cal- cium carbonate, total hardness was on the high side, and contents of dissolved solids and sulfate were high with high incidence of gallstone disease. The population den- 321,600 residents drink the water that didn’t reach the  F. Q. NI ET AL. 157 sity was 90/km2 and the proportion of cultivated land was 3.14%. It belonged to areas moderately influenced by human action and human impacts on this area were relatively notable; As for Minshan County, average annual rainfall was 1501mm. There were relatively great differences in background values of iron and manganese content in groundwater in different soil parent materials and differ- ent soil types, where iron and manganese content in some regions of this area were high. Rural population was dispersed, economic development was relatively lagging behind, and infrastructure was relatively weak. Source of drinking water mainly relies on groundwater and population of groundwater consumption was as high as 86%. The population density and the proportion of cultivated land were 4200/km2 and 14.8% respectively. It belonged to areas intensely influenced by human action and human impacts on this area were relatively notable; As for Yingjing County, precipitation was abundant, spatial and temporal distribution was uneven with serious mountain flood disasters. It has rich water resources, average precipitation was 3.483 billion km3, runoff depth was 1702mm, and runoff coefficient was 0.86. The num- ber of total coliform in drinking water amounted to 360/ml, which has gone far beyond the standards. The population density was 100/km2 and the proportion of cultivated land was 3.44%. It belonged to areas moder- ately influenced by human action and human impacts on this area were relatively notable; As for Baoxing County, its hilly area accounts for 99.7%, precipitation was 953mm and there was a trend of water shortage. Dissolved solids in drinking water were not detected; tested values of toxicology indicators were low. However, the total number of bacteria was 210/ml, which was twice as much as the Standards for Drinking Water Quality. The population density only reaches to 20/km2 and the proportion of cultivated land was just 0.84%. It belonged to areas slightly influenced by human action; As for Yucheng District, which was located in the middle of Qingyi River Basin, precipitation of oro- graphic rain was abundant, average rain days amounted to 218, and average annual precipitation was 1732mm. The population density reaches to 3200 /km2 and the proportion of cultivated land was 7.0%. Affected by ef- fects of human activities, industrial wastewater and do- mestic sewage, water that could be directly consumed was relatively not much, resulting in drinking water shortage; As for Hanyuan County, it has hot and dry air with lit- tle precipitation, spatial and temporal distribution of which was uneven. Average annual precipitation was 731mm, evaporation capacity was up to 1499mm, and it belongs to water-poor area in proportion to water quan- tity. Contents of heavy metals in drinking water were relatively low; however, fluorine content was high. Inci- dence of water-borne fluorosis of bone, Kashin-Beck disease and dental fluorosis were high. The population density was 50/km2 and the proportion of cultivated land was 1.50%. It belonged to areas slightly influenced by human action; As for Shimian County, exploitable water resources were abundant, however, precipitation and the amount of water that could be used as domestic drinking water was relatively not much. Winter and spring were dry seasons. There was a critical shortage in drinking water from wells, creeks and ditches was a severe shortage and that was what caused seasonal water shortage and low guar- anteed rate. The water quality of treated raw water from creeks, ditches, ponds, weirs, reservoirs and rivers, which were consumed by local people, don’t meet the standards, i.e., drinking water was not safe. The popula tion density was just 140/km2 and the proportion of cul- tivated land was also just 8.68%. It belonged to areas slightly influenced by human action. During 2005–2008, 221 villages were detected about water quantity, water quality, convenience degree and gua- ranteed rate in rural drinking water safety. See Figure 2. 2.2. Methods of Early Warning of Rural Drinking Water Safety There are three kinds of methods: 1) Early warning of index: namely to integrate index of warning sign and express them in the form of inte- grated indicators. The elevation and subsidence of Warn- ing Thing can be estimated according to the elevation and subsidence of the integrated indicators of Warning Sign after having standardization and weighted process- ing to all variable values of Warning Sign index. 2) Early warning of statistics: this kind of early warn- ing method is to have the relationship between warning sign and warning affairs statistically processed, and then predict warning degree according to the level of warning sign. Early warning of statistics emphasizes on the sig- nificant test of chosen warning sign index, but its inte- grated approach is not requested; however, conditions of early warning of index to chosen Warning Sign index is more loosed and its integrated approach is relatively pro- grammed and normalized. 3) Early warning of model: i.e., to have further early warning analysis on the basis of early warning of index and early warning of statistics. Its essence is to establish Lag Model with warning sign as independent variables to have prediction. 2.3. Early Warning Types of Rural Drinking Water Safety 1) Early warning of state: firstly, to collect basic data of rural drinking water, such as water quality, water qua- ntity, convenience degree and guaranteed rate, establish Copyright © 2010 SciRes. JWARP 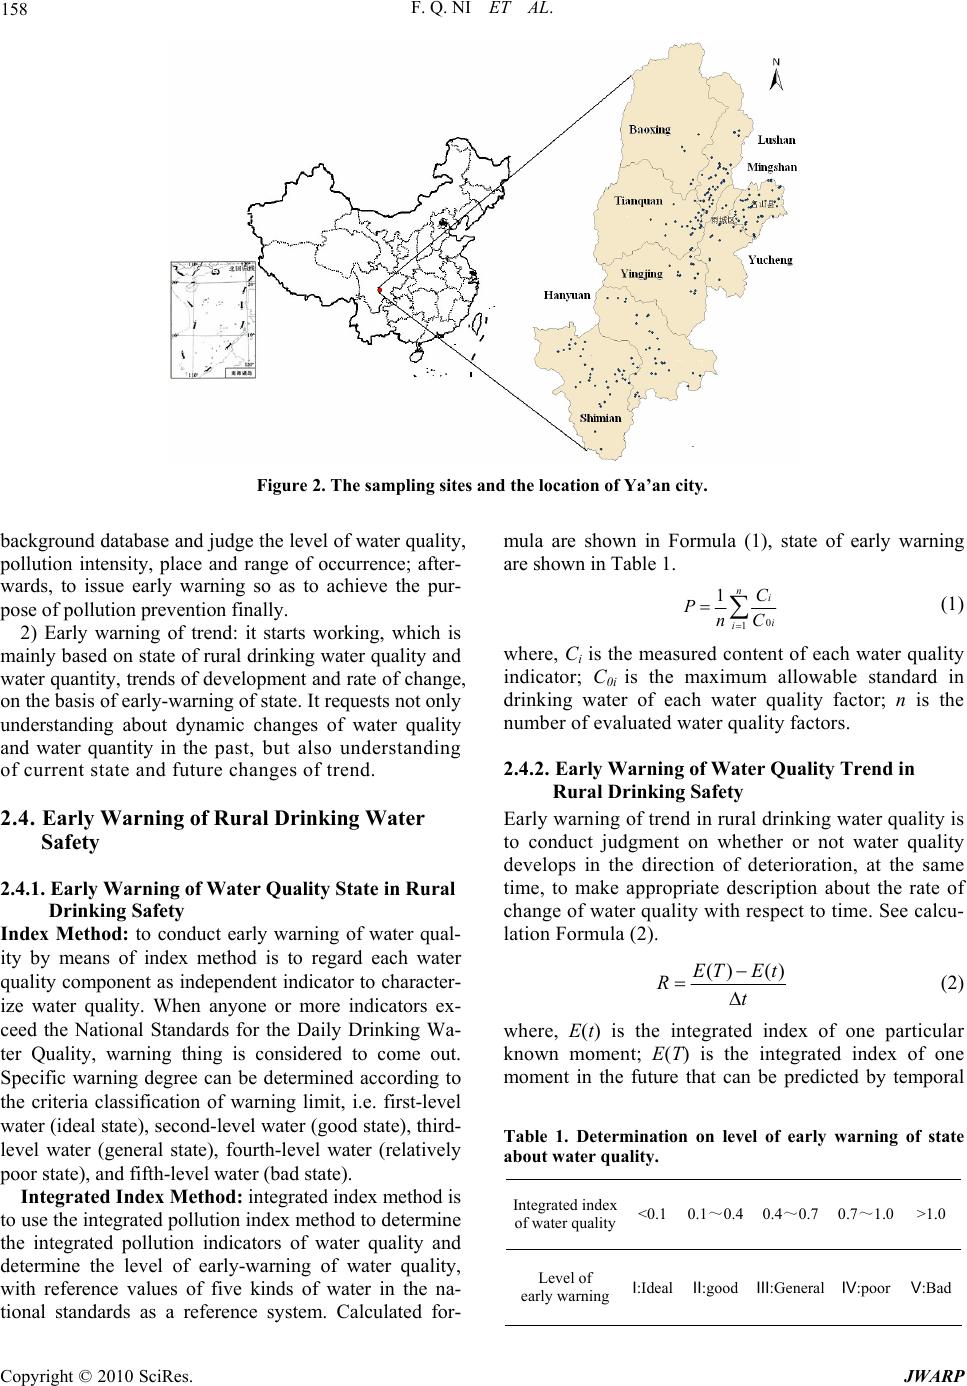 F. Q. NI ET AL. Copyright © 2010 SciRes. JWARP 158 Figure 2. The sampling sites and the location of Ya’an city. background database and judge the level of water quality, pollution intensity, place and range of occurrence; after- wards, to issue early warning so as to achieve the pur- pose of pollution prevention finally. 2) Early warning of trend: it starts working, which is mainly based on state of rural drinking water quality and water quantity, trends of development and rate of change, on the basis of early-warning of state. It requests not only understanding about dynamic changes of water quality and water quantity in the past, but also understanding of current state and future changes of trend. 2.4. Early Warning of Rural Drinking Water Safety 2.4.1. Early Warning of Water Quality State in Rural Drinking Safety Index Method: to conduct early warning of water qual- ity by means of index method is to regard each water quality component as independent indicator to character- ize water quality. When anyone or more indicators ex- ceed the National Standards for the Daily Drinking Wa- ter Quality, warning thing is considered to come out. Specific warning degree can be determined according to the criteria classification of warning limit, i.e. first-level water (ideal state), second-level water (good state), third- level water (general state), fourth-level water (relatively poor state), and fifth-level water (bad state). Integrated Index Method: integrated index method is to use the integrated pollution index method to determine the integrated pollution indicators of water quality and determine the level of early-warning of water quality, with reference values of five kinds of water in the na- tional standards as a reference system. Calculated for- mula are shown in Formula (1), state of early warning are shown in Table 1. 0 1 1ni i i C PnC (1) where, Ci is the measured content of each water quality indicator; C0i is the maximum allowable standard in drinking water of each water quality factor; n is the number of evaluated water quality factors. 2.4.2. Early Warning of Water Quality Trend in Rural Drinking Safety Early warning of trend in rural drinking water quality is to conduct judgment on whether or not water quality develops in the direction of deterioration, at the same time, to make appropriate description about the rate of change of water quality with respect to time. See calcu- lation Formula (2). () ()ET Et Rt (2) where, E(t) is the integrated index of one particular known moment; E(T) is the integrated index of one moment in the future that can be predicted by temporal Table 1. Determination on level of early warning of state about water quality. Integrated index of water quality<0.1 0.1~0.4 0.4~0.7 0.7~1.0 >1.0 Level of early warningⅠ:Ideal Ⅱ:good Ⅲ:General Ⅳ:poorⅤ:Bad  F. Q. NI ET AL. 159 extrapolation method and time series models; ∆t is a pe- riod of time; R is the rate of change about water quality. Its value range and conceptions are shown in Table 2. 2.4.3. Early Warning of Water Quantity in Rural Drinking Safety 1) Early warning of state in water quantity: according to the requirements of evaluation criteria of water quantity, the amount of available water per person per day is cal culated to determine the level of early warning in study areas. 2) Early warning of trend in water quantity: early warning of trend of water quantity is to conduct judg- ments on whether or not the amount of available water per person per day develops in the direction of deteriora- tion, at the same time, to make appropriate description about the rate of change of water quantity with respect to time. See calculation Formula (3). ()( )Qt QT Rt (3) where, Q(t)is the amount of available water per person per day of one particular known moment; Q(T) is the amount of available water per person per day of one moment in the future that can be predicted by temporal extrapolation method and time series models. ∆t is a pe- riod of time; R is the rate of change about water quantity. Its value range and conceptions are shown in Table 3. 2.4.4. Early Warning of Convenience Degree and Guaranteed Rate in Rural Drinking Water Safety According to the requirements of evaluation criteria of convenience degree and guaranteed rate in rural drinking water safety, the round-trip time of fetching water by manpower and guaranteed rate of water supply from wa- ter resources in generally arid years (drought appears every decade) are calculated to determine the level of early warning in study areas. 2.4.5. Early Warning of Trend in Rural Drinking Water Safety According to the evaluation index of above four single indicators, the comprehensive evaluation indicator (Rh) can be drawn according to Formula (4). Rh= 11 nm ij ji R (4) where, Aj is the weight. Values of water quantity, water quality, water source guaranteed rate and convenience degree are 0.3, 0.3, 0.2 and 0.2 respectively; Rij is the evaluation value of the single factor; i is the number of sampling sites; j is the amount of evaluation values of single factors. The hierarchical relationship between comprehensive index value and the rural drinking water safety warning can be seen in Table 4. Table 2. Determination on level of early warning of trend about water quality. Rate R<0 0R0.1≦≦ 0.1<R<0.2 0.2<R<0.4 >0.4 Level of early warning Ⅰ: Improving trend Ⅱ: Stable trend Ⅲ: Slightly deteriorated trend Ⅳ: Moderately deteriorated trend Ⅴ: Severely deteriorated trend Table 3. Determination on level of early warning of trend about water quantity. Study areas Rate of change of water quantity Level of early warning of status R0≦ V:Improving trend 0﹤R12≦ IV:Stable trend 12﹤R16≦ III:Slightly deteriorated trend 16﹤R18≦ II:Moderately deteriorated trend Abundant precipitation areas R18≧ I:Severely deteriorated Trend R0≦ V:Improving trend 0﹤R4≦ IV:Stable trend 4﹤R8≦ III:Slightly deteriorated trend 8﹤R10≦ II:Moderately deteriorated trend Deficient precipitation areas R10≧ I:Severely deteriorated trend Copyright © 2010 SciRes. JWARP  F. Q. NI ET AL. Copyright © 2010 SciRes. JWARP 160 Table 4. The relationship among comprehensive index value and warning levels. Level Characterization of warning state Characteristic I Serious state (bad state) Service functions of rural drinking water safety system are near collapse, which manifested in: ecological processes are difficult to reverse; structures of ecosystem are incomplete and functions are lost; it is very difficult to con- duct ecological restoration and reconstruction; ecological problems are heavy and often turn into ecological disasters. II Moderate state (poor state) Service functions of rural drinking water safety system are severely degraded, which manifested in: ecological environment has been greatly damaged; structures of ecosystem are destroyed badly, whose functions are degraded and not overall, and it is difficult to recover after being disturbed by outside interference; heavy ecological problems and many ecological disasters. III Early warning state (general state) Service functions of rural drinking water safety system have been degraded, which manifested in: ecological environment has been damaged to a certain degree; there are changes in structures of ecosystem, however, they can still maintain basic functions, and it is easy to deteriorate after being disturbed; ecological problems are emerged and ecological disasters occurs at times. IV Relatively safe state (good state) Service functions of rural drinking water safety system are more complete, which manifested in: ecological environment is less damaged; structures of ecosystem are still complete and functions are still good, which can be recov- ered under general disturbances; no significant ecological problems and not too many ecological disasters. V Safe state (ideal state) Service functions of rural drinking water safety system are basically com- plete, which manifested in: ecological environment, basically, isn’t disturbed and damaged; structures of ecosystem are complete with high level of func- tionality; strong system recovery and regenerative ability; no significant eco- logical problems and ecological disaster less. 3. Results 3.1. Early Warning of State Results from early warning of state can be seen in Fig- ures 3–12. 3.1.1. Early Warning of Water Quantity According to Figure 3, early warning of water quantity mainly appeared in counties other than Tianquan and Lushan county. As for Yucheng District, it mainly appeared in Zhongli town, Bifengxia town, Hejiang town, Yanqiao town, Liba, Babu town and Guanhua town, with involved population of 235, 1013, 909, 340, 1345, 418 and 170 respectively. The total amount of involved population was 4430; As for Minshan County, it mainly appeared in Jian- shan town, Mengdingshan town, Maling town, Hongyan town, Cheling town, Yongxing town and Hongxing town, with involved population of 276, 717, 1080, 1450, 640, 2077 and 3314 respectively. The total amount of in- volved population amounted to 9554; As for Yingjing County, it mainly appeared in Anjing town, Baofeng town, Huatan town, Miaogang town, Sanhe town, Shiqiao town, Shizi town, Tianfeng town, Xinjian town, Xinmiao town and Yinghe town, with in- volved population of 898, 399, 474, 322, 1677, 898, 233, 721, 857, 1034 and 825 respectively. The total amount of involved population amounted to 8338; As for Hanyuan County, it mainly appeared in Dashu town, Qingxi town, Fuquan town, Tangjia town, Qianyu town, Malie town, Shuangxi town, Guixian town, Xiao- bao town, Anle town, Hexi town, Yidong town and Dayan town, with involved population of 500, 3856, 500, 528, 3849, 500, 6435, 350, 49, 2216, 420, 2753 and 700 respectively. The total amount of involved population amounted to 22656; As for Shimian County, it mainly appeared in Fengle town, Zaiyang town, Yongle town, Chaluo town and Xinmin town, with involved population of 855, 2813, 2988, 650 and 943 respectively. The total amount of in- volved population amounted to 8249; As for Baoxing County, it mainly appeared in Long- dong town, Minzhi town, Muping town, Lingguan town, Zhongba town and Daxi town, with involved population of 220, 60, 531, 125, 230 and 227 respectively. The total amount of involved population amounted to 1393.  F. Q. NI ET AL. 161 3.1.2. Early Warning of Water Quality According to Figures 4–11, early warning of water qual- ity appeared in all the 7 counties and one district. Involved population of Yucheng District was 65788, in which, population of fluoride content exceeding the standards amounted to 3022, which mainly appeared in Bifengxia town, Shaping town, Zhouhe town and Guan- hua town with involved population of 320, 114, 681 and 1907 respectively; population of brackish water amo- unted to 15743, which mainly appeared in Zhongli town, Bifengxia town, Daxing town, Caoba town, Hejiang town, Nanjiao town, Xianghua town and Babu town with involved population of 3230, 496, 618, 4817, 474, 1566, 4340 and 202 respectively; involved population of un- treated surface water and bacteriological indicators seri- ously exceeding the standards and amounted to 35402, which mainly appeared in Bifengxia town, Daxing town, Caoba town, Beijiao town, Duiyan town, Yanqiao town, Zhouhe town, Yanchang town, Babu town and Helong town with involved population of 1313, 2063, 75, 2997, 6154, 6874, 307, 1339, 5381 and 2646 respectively; in- volved population of heavily polluted and untreated groundwater amounted to 1517, which mainly appeared in Bifengxia town, Beijiao town and Duoying town with involved population of 860, 294 and 363 respectively; population of other indicators exceeding the standards amounted to 10104, which mainly appeared in Zhongli town, Bifengxia town, Caoba town, Hejiang town, Feng- ming town, Kongping town, Duiyan town, Zhouhe Liba town, Babu town and Guanhua town with involved population of 397, 10, 462, 25, 1883, 2442, 2514, 299, 1622, 290 and 160 respectively; Involved population of Mingshan County was 45398, in which, involved population of untreated Ⅳ-level and above Ⅳ-level groundwater amounted to 25695, in- volved population of bacteriological indicators seriously exceeding the standards and untreated groundwater amounted to 11000, involved population of heavily pol luted and untreated groundwater amounted to 8703, and population of other indicators exceeding the standards amounted to 39045; Involved population of Yingjing County was 46005, in which, involved population of untreated Ⅳ-level and above Ⅳ-level groundwater amounted to 5411, involved population of bacteriological indicators seriously ex- ceeding the standards and untreated groundwater amo- unted to 25152, involved population of heavily polluted and untreated groundwater amounted to 6639, and popu- lation of other indicators exceeding the standards amounted to 8803; Involved population of Hanyuan County was 46005, in which, population of fluoride content exceeding the standards amounted to 7515, involved population of bacteriological indicators seriously exceeding the stan- Figure 3. Water quantity early warning. Figure 4. Water quality early warning. Copyright © 2010 SciRes. JWARP 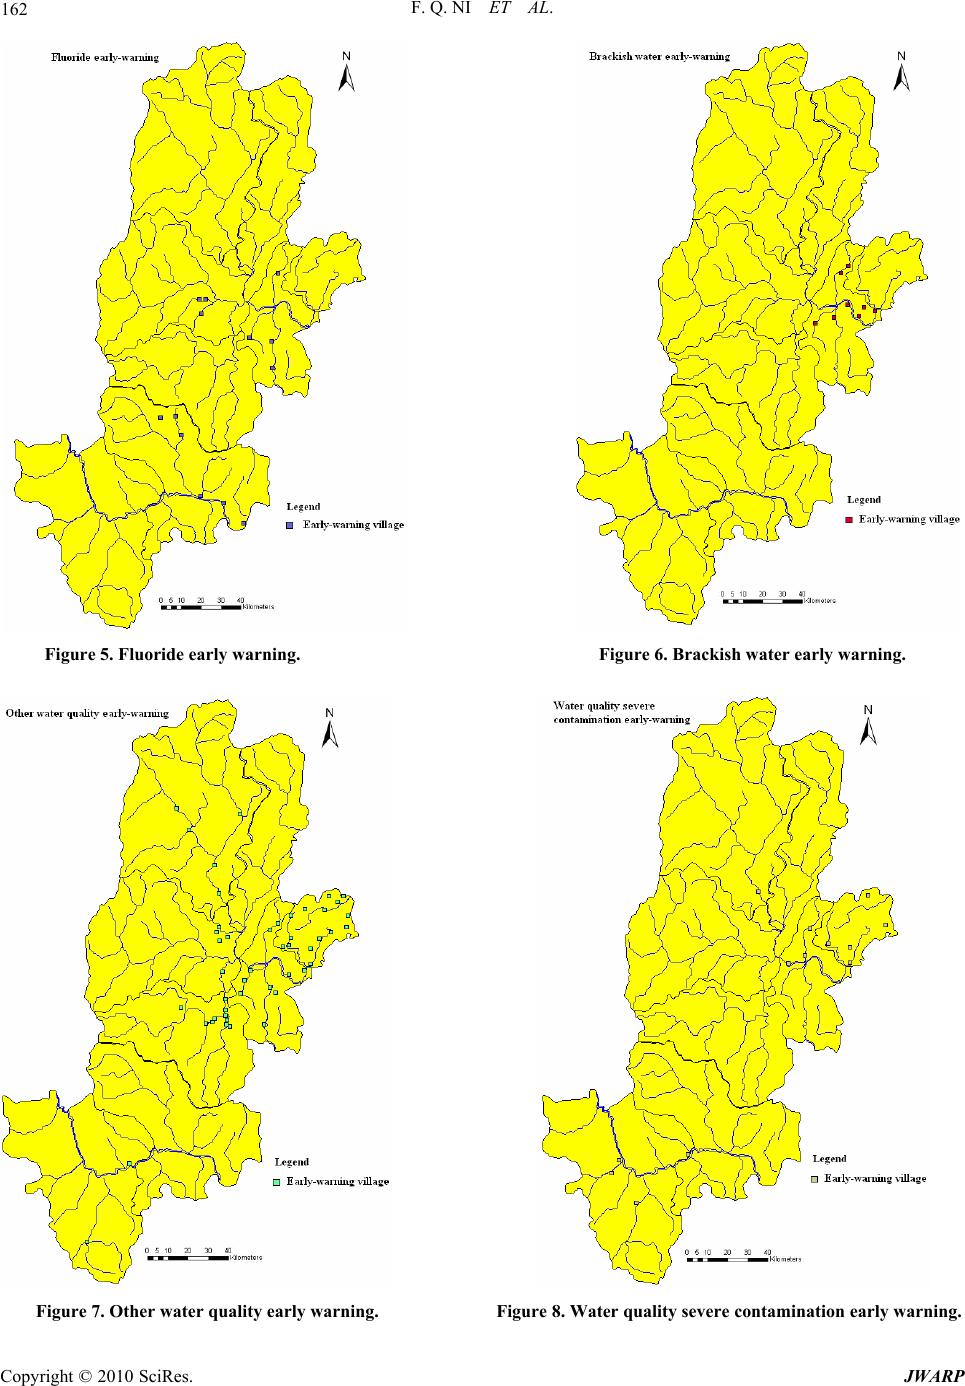 F. Q. NI ET AL. 162 Figure 5. Fluoride early warning. Figure 6. Brackish water early warning. Figure 7. Other water quality early warning. Figure 8. Water quality severe contamination early warning. Copyright © 2010 SciRes. JWARP 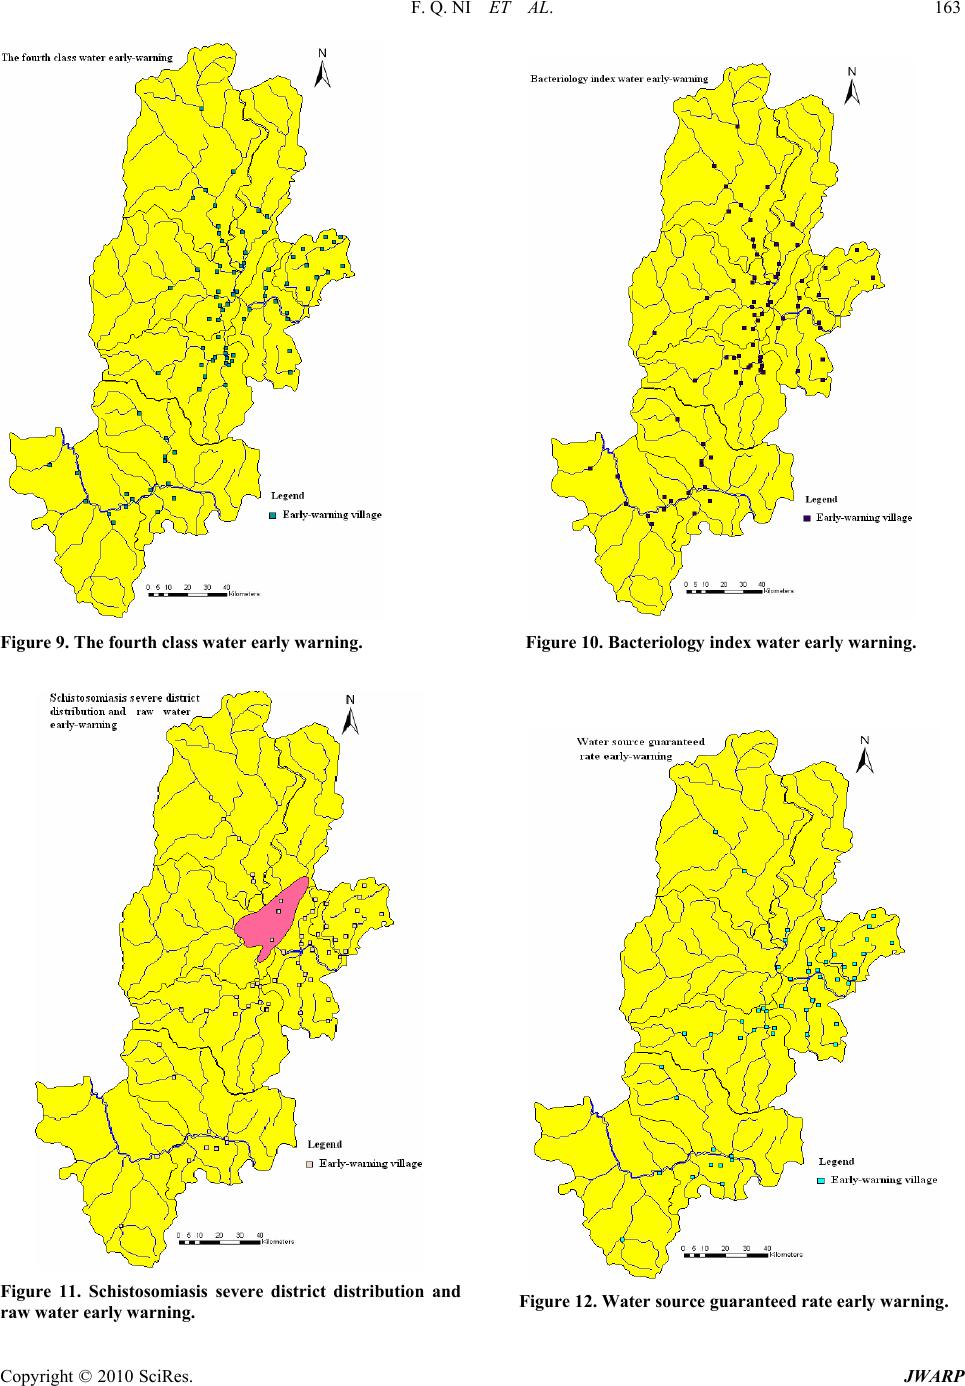 F. Q. NI ET AL. Copyright © 2010 SciRes. JWARP 163 Figure 9. The fourth class water early warning. Figure 10. Bacteriology index water early warning. Figure 11. Schistosomiasis severe district distribution and raw water early warning. Figure 12. Water source guaranteed rate early warning. 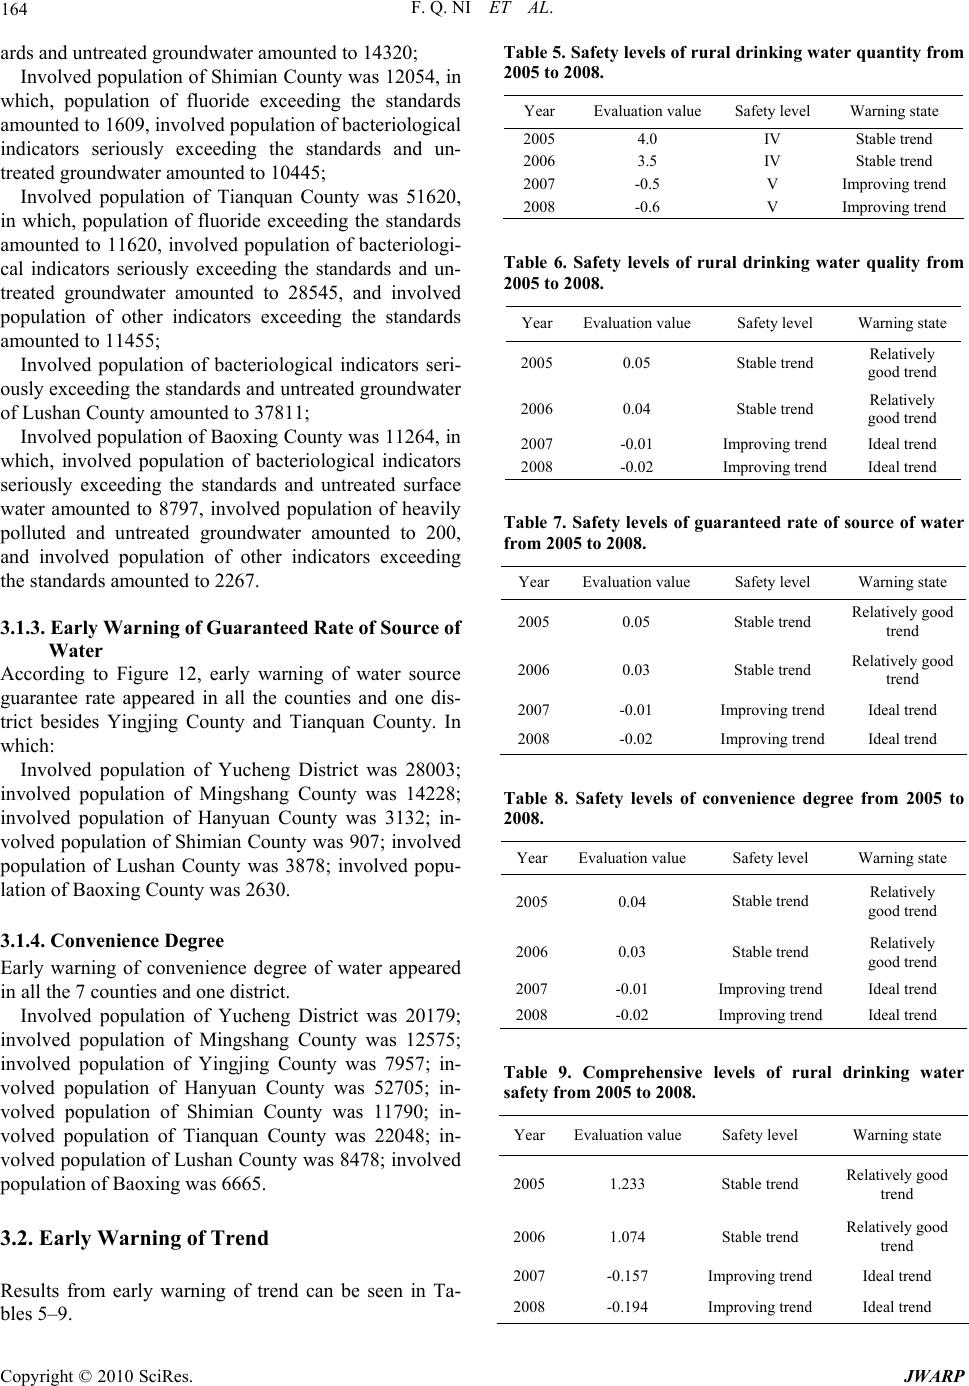 F. Q. NI ET AL. 164 ards and untreated groundwater amounted to 14320; Involved population of Shimian County was 12054, in which, population of fluoride exceeding the standards amounted to 1609, involved population of bacteriological indicators seriously exceeding the standards and un- treated groundwater amounted to 10445; Involved population of Tianquan County was 51620, in which, population of fluoride exceeding the standards amounted to 11620, involved population of bacteriologi- cal indicators seriously exceeding the standards and un- treated groundwater amounted to 28545, and involved population of other indicators exceeding the standards amounted to 11455; Involved population of bacteriological indicators seri- ously exceeding the standards and untreated groundwater of Lushan County amounted to 37811; Involved population of Baoxing County was 11264, in which, involved population of bacteriological indicators seriously exceeding the standards and untreated surface water amounted to 8797, involved population of heavily polluted and untreated groundwater amounted to 200, and involved population of other indicators exceeding the standards amounted to 2267. 3.1.3. Early Warning of Guaranteed Rate of Source of Water According to Figure 12, early warning of water source guarantee rate appeared in all the counties and one dis- trict besides Yingjing County and Tianquan County. In which: Involved population of Yucheng District was 28003; involved population of Mingshang County was 14228; involved population of Hanyuan County was 3132; in- volved population of Shimian County was 907; involved population of Lushan County was 3878; involved popu- lation of Baoxing County was 2630. 3.1.4. Convenience Degree Early warning of convenience degree of water appeared in all the 7 counties and one district. Involved population of Yucheng District was 20179; involved population of Mingshang County was 12575; involved population of Yingjing County was 7957; in- volved population of Hanyuan County was 52705; in- volved population of Shimian County was 11790; in- volved population of Tianquan County was 22048; in- volved population of Lushan County was 8478; involved population of Baoxing was 6665. 3.2. Early Warning of Trend Results from early warning of trend can be seen in Ta- bles 5–9. Table 5. Safety levels of rural drinking water quantity from 2005 to 2008. Year Evaluation value Safety level Warning state 2005 4.0 IV Stable trend 2006 3.5 IV Stable trend 2007 -0.5 V Improving trend 2008 -0.6 V Improving trend Table 6. Safety levels of rural drinking water quality from 2005 to 2008. YearEvaluation valueSafety level Warning state 20050.05 Stable trend Relatively good trend 20060.04 Stable trend Relatively good trend 2007-0.01 Improving trend Ideal trend 2008-0.02 Improving trend Ideal trend Table 7. Safety levels of guaranteed rate of source of water from 2005 to 2008. Year Evaluation value Safety level Warning state 2005 0.05 Stable trend Relatively good trend 2006 0.03 Stable trend Relatively good trend 2007 -0.01 Improving trend Ideal trend 2008 -0.02 Improving trend Ideal trend Table 8. Safety levels of convenience degree from 2005 to 2008. YearEvaluation value Safety level Warning state 20050.04 Stable trend Relatively good trend 20060.03 Stable trend Relatively good trend 2007-0.01 Improving trend Ideal trend 2008-0.02 Improving trend Ideal trend Table 9. Comprehensive levels of rural drinking water safety from 2005 to 2008. YearEvaluation valueSafety level Warning state 20051.233 Stable trend Relatively good trend 20061.074 Stable trend Relatively good trend 2007-0.157 Improving trend Ideal trend 2008-0.194 Improving trend Ideal trend Copyright © 2010 SciRes. JWARP 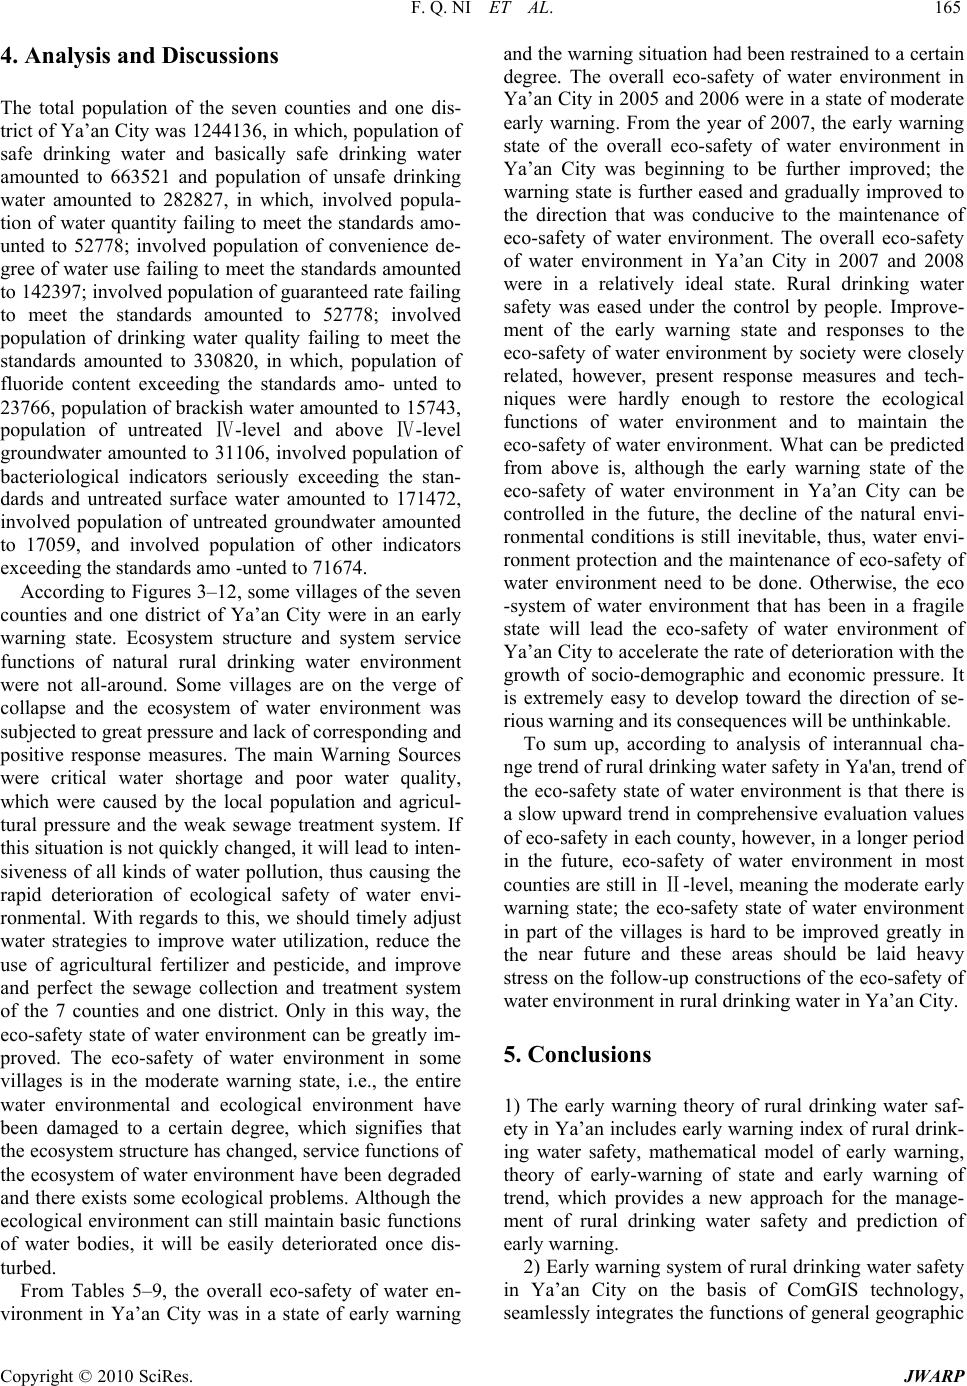 F. Q. NI ET AL. 165 4. Analysis and Discussions The total population of the seven counties and one dis- trict of Ya’an City was 1244136, in which, population of safe drinking water and basically safe drinking water amounted to 663521 and population of unsafe drinking water amounted to 282827, in which, involved popula- tion of water quantity failing to meet the standards amo- unted to 52778; involved population of convenience de- gree of water use failing to meet the standards amounted to 142397; involved population of guaranteed rate failing to meet the standards amounted to 52778; involved population of drinking water quality failing to meet the standards amounted to 330820, in which, population of fluoride content exceeding the standards amo- unted to 23766, population of brackish water amounted to 15743, population of untreated Ⅳ-level and above Ⅳ-level groundwater amounted to 31106, involved population of bacteriological indicators seriously exceeding the stan- dards and untreated surface water amounted to 171472, involved population of untreated groundwater amounted to 17059, and involved population of other indicators exceeding the standards amo -unted to 71674. According to Figures 3–12, some villages of the seven counties and one district of Ya’an City were in an early warning state. Ecosystem structure and system service functions of natural rural drinking water environment were not all-around. Some villages are on the verge of collapse and the ecosystem of water environment was subjected to great pressure and lack of corresponding and positive response measures. The main Warning Sources were critical water shortage and poor water quality, which were caused by the local population and agricul- tural pressure and the weak sewage treatment system. If this situation is not quickly changed, it will lead to inten- siveness of all kinds of water pollution, thus causing the rapid deterioration of ecological safety of water envi- ronmental. With regards to this, we should timely adjust water strategies to improve water utilization, reduce the use of agricultural fertilizer and pesticide, and improve and perfect the sewage collection and treatment system of the 7 counties and one district. Only in this way, the eco-safety state of water environment can be greatly im- proved. The eco-safety of water environment in some villages is in the moderate warning state, i.e., the entire water environmental and ecological environment have been damaged to a certain degree, which signifies that the ecosystem structure has changed, service functions of the ecosystem of water environment have been degraded and there exists some ecological problems. Although the ecological environment can still maintain basic functions of water bodies, it will be easily deteriorated once dis- turbed. From Tables 5–9, the overall eco-safety of water en- vironment in Ya’an City was in a state of early warning and the warning situation had been restrained to a certain degree. The overall eco-safety of water environment in Ya’an City in 2005 and 2006 were in a state of moderate early warning. From the year of 2007, the early warning state of the overall eco-safety of water environment in Ya’an City was beginning to be further improved; the warning state is further eased and gradually improved to the direction that was conducive to the maintenance of eco-safety of water environment. The overall eco-safety of water environment in Ya’an City in 2007 and 2008 were in a relatively ideal state. Rural drinking water safety was eased under the control by people. Improve- ment of the early warning state and responses to the eco-safety of water environment by society were closely related, however, present response measures and tech- niques were hardly enough to restore the ecological functions of water environment and to maintain the eco-safety of water environment. What can be predicted from above is, although the early warning state of the eco-safety of water environment in Ya’an City can be controlled in the future, the decline of the natural envi- ronmental conditions is still inevitable, thus, water envi- ronment protection and the maintenance of eco-safety of water environment need to be done. Otherwise, the eco -system of water environment that has been in a fragile state will lead the eco-safety of water environment of Ya’an City to accelerate the rate of deterioration with the growth of socio-demographic and economic pressure. It is extremely easy to develop toward the direction of se- rious warning and its consequences will be unthinkable. To sum up, according to analysis of interannual cha- nge trend of rural drinking water safety in Ya'an, trend of the eco-safety state of water environment is that there is a slow upward trend in comprehensive evaluation values of eco-safety in each county, however, in a longer period in the future, eco-safety of water environment in most counties are still in Ⅱ-level, meaning the moderate early warning state; the eco-safety state of water environment in part of the villages is hard to be improved greatly in the near future and these areas should be laid heavy stress on the follow-up constructions of the eco-safety of water environment in rural drinking water in Ya’an City. 5. Conclusions 1) The early warning theory of rural drinking water saf- ety in Ya’an includes early warning index of rural drink- ing water safety, mathematical model of early warning, theory of early-warning of state and early warning of trend, which provides a new approach for the manage- ment of rural drinking water safety and prediction of early warning. 2) Early warning system of rural drinking water safety in Ya’an City on the basis of ComGIS technology, seamlessly integrates the functions of general geographic Copyright © 2010 SciRes. JWARP  F. Q. NI ET AL. Copyright © 2010 SciRes. JWARP 166 information system and professional knowledge in the field of drinking water safety in science of water re- sources into an organic part, improves the degree of in- fomatization and level of management in rural drinking water safety, and provides a platform for public welfare to the solution of rational analysis and evaluation in rural drinking water safety. Good results are obtained from application. 3) Early warning system of rural drinking water safety in Ya’an City is a software platform, which is a fusion of information management database, evaluation, prediction, early warning of rural drinking water safety. These func- tions are applied on the same platform with a great con- venience and are applicable to operation and use for general administrative staff. 4) The evaluation results show that comprehensive evaluation value of rural drinking water safety is rising year by year, and the overall trend is getting better. However, the state of evaluation values decline year by year. That proves that rural drinking water safety of Ya’an City is damaged continuously and the rising of pressure value and response value are main reasons which causes the rising of evaluation value of rural drinking water safety. 6. Acknowledgement This study was financed jointly by Sichuan Agricultural University youth science and technology innovation fund (00530300) and Sichuan Agricultural University intro- duced the talented person fund (00530301). 7. References [1] F. Q. Ni, G. D. Liu, H. Z. Ren, et al., “Health risk assess- ment on rural drinking water safety:A case study in rain city district of ya’an city of sichuan province,” Journal of Water Resource and Protection, Vol. 2, pp. 128–135, 2009. (doi: 10.4236/jwarp.2009.12017 Published On-line Au- gust 2009 (http://www.SciRP.org/journal/jwarp/)). [2] M. Thomas, A. Florion, D. Chretien, and D. Terver, “Real-time biomonitoring of water contamination by cyanide based on analysis of the continuous electric sig- nal emitted by a tropical fish: Apteronotus albifrons,” Water Research, Vol. 30, No. 12, pp. 3083–3091, 1996. [3] W. H. van der Schalie, T. R. Shedd, P. L. Knechtges, and M. W. Widder, “Using higher organisms in biological early warning systems for real-time toxicity detection,” Biosensors and Bioelectronics, Vol. 16, No. 7–8, pp. 457–465, 2001. [4] S. Craig and P. Laming, “Behaviour of the three-spined stickleback, Gasterosteous aculeatus (Gasterosteidae, Teleostei) in the multispecies freshwater biomonitor: a validation of automated recordings at three levels of am- monia pollution,” Water Research, Vol. 38, No. 8, pp. 2144–2154, 202, 2004. [5] E. Küster, F. Dorusch, C. Vogt, H. Weiss, and R. Alten- burger, “On line biomonitors used as a tool for toxicity reduction evaluation of in situ groundwater remediation techniques,” Biosensors and Bioelectronics, Vol. 19, No. 12, pp. 1711–1722, 2004. [6] J. C. Cho, K. J. Park, H. S. Ihm, J. E. Park, S. Y. Kim, I. Kang, K. H. Lee, D. J. Jahng, D. H. Lee, and S. J. Kim, “A novel continuous toxicity test system using a lumi- nously modified freshwater bacterium,” Biosensors and Bioelectronics, Vol. 20, No. 2, pp. 338–344, 2004. [7] J. H. Jeon, J. H. Kim, B. C. Lee, and S. D. Kim, “Devel- opment of a new biomonitoring method to detect the ab- normal activity of Daphnia magna using automated Grid Counter device,” Science of The Total Environment, Vol. 389, No. 2–3, pp. 545–556, 2008. [8] F. Q. Ni, Y. F. Hu, et al., “Research on spatial analysis system of rural drinking water safety in Ya’an, Sichuan,” Symposium Proceedings of the Fourth China Water Fo- rum, pp. 1095–1098, 2006. [9] G. Wang and W. Wu, “Design of an early warning sys- tem of water security for Liaohe River based on GIS,” Journal of Dalian University of Technology, March 2007. [10] Y. S. Zhao and X. Y. Lin, “GIS technology in environ- ment and water resources system,” The Higher Education Press, December 2006. [11] Z. Y. Dong, B. Li, and J. Sun, “The research of forecast of water quality in the western part of Jilin province by means of GIS,” Journal of Jilin University (Earth Science Edition), January, 2003. [12] Z. Q. Wang, W. G. Sun, D. K. Wang, et al., “Appraisal report on present drinking water safety in rural areas of Ya’an city,” Unpublished data sources, Ya’an Water Conservancy and Hydropower Survey and Design Re- search Institute, April 2005.
|