 J. Biomedical Science and Engineering, 2010, 3, 114-123 doi:10.4236/jbise.2010.32017 Published Online February 2010 (http://www.SciRP.org/journal/jbise/ JBiSE ). Published Online February 2010 in SciRes. http://www.scirp.org/journal/jbise Identification of highly conserved domains in hemagglutinin associated with the receptor binding specificity of influenza viruses: 2009 H1N1, avian H5N1, and swine H1N2 Wei Hu Department of Computer Science, Houghton College, Houghton, New York, USA. Email: wei.hu@houghton.edu Received 11 December 2009; revised 14 December 2009; accepted 15 December 2009. ABSTRACT The hemagglutinin (HA) of influenza viruses facili- tates receptor binding and membrane fusion, which is the initial step of virus infection. Human influenza viruses preferentially bind to receptors with α2-6 lin- kages to galactose (SAα2,6Gal), whereas avian influ- enza viruses prefer receptors with α2-3 linkages to galactose (SAα2,3Gal). The current 2009 H1N1 pan- demic is caused by a novel influenza A virus that has its genetic materials from birds, humans, and pigs. Its pandemic nature is characterized clearly by its dual binding to the α2-3 as well as α2-6 receptors, because the seasonal human H1N1 virus only binds to the α2-6 receptor. In a previous study, the infor- mational spectrum method (ISM), a bioinformatics technique, was applied to uncover one highly con- served region in the HA protein associated with re- ceptor binding preference in each of various influ- enza subtypes. In the present study, we extended the previous work by discovering multiple such domains in HA of 2009 H1N1 and avian H5N1 to expand our repertoire of known key regions in HA responsible for receptor binding affinity. Three such domains in HA of 2009 H1N1 were found at residue positions 106 to 130, 150 to 174, and 191 to 221, and another three domains in HA of avian H5N1 were located at residue positions 46 to 65, 136 to 153, and 269 to 286. These identified domains could be utilized as therapeutic and diagnostic targets for the prevention and treat- ment of influenza infection. Keywords: Binding Specificity; Discrete Fourier Transform; Electron-Ion Interaction Potential; Entropy; Hemagglutinin; Influenza; Informational Spectrum Method 1. INTRODUCTION Influenza A viruses have two surface proteins, hemag- glutinin (HA) and neuraminidase (NA). HA is a homo- trimer, in which each monomer comprises two subdo- mains, HA1 and HA2. HA1 initializes the contact with the cell membrane and HA2 mediates membrane fusion. The first step in the infection of influenza viruses is binding of their surface protein HA to sialylated glycan receptors on the host cells. In general, human influenza and avian viruses preferentially bind to the α2-3 sialy- lated and α2-6 sialylated glycan receptors, respectively. Pigs have receptors for both human and avian influenza viruses on their tracheal epithelial cells, thus they can serve as a mixing vessel to re-assort genes from different species to make new influenza viruses. The interaction between HA and its receptors has been studied biologically, genetically, and structurally. The different binding phenotypes of human and avian influ- enza viruses suggest that the avian viruses could not readily infect humans. However, the human infection by H5N1 chicken viruses in Hong Kong in 1997 implied for the first time that it is possible for avian viruses to infect humans directly, which was explained in part by the finding that human airway epithelium harbors α2–3- linked sialic acids on ciliated cells [1]. It is believed that HA binding affinity for receptors is a critical factor of host switch. In addition to the current 2009 pandemic H1N1, the past three flu pandemics, the Spanish flu in 1918, the Asian flu in 1957, and the Hong Kong flu in 1968, all had arisen through reassortment among avian, human, and swine strains. Hence, the importance of ex- panding our knowledge on the receptor-binding affinity of the influenza viruses is apparent. Various approaches such as structural analysis, protein evolution, and mathematical modeling have been used to study the interactions between HA and its receptors. To quantitatively elucidate the binding specificity of HA to avian and human receptors, the interaction energy be- tween HA and its receptors were analyzed with the ab initio fragment molecular orbital (FMO) method [2], which clarified the role of the mutated residues Glu190 and Gln226 in the binding patterns of H5 HA. The report  W. Hu / J. Biomedical Science and Engineering 3 (2010) 114-123 Copyright © 2010 SciRes. 115 JBiSE in [3] discovered that the mutations at positions 182 and 192 in HA1 independently switch H5N1 virus binding preferences from avian to human type, which could serve as molecular markers for measuring the pandemic potential of H5N1 isolates. Using sequence analysis and homology modeling [4], the HA protein of 2009 H1N1 was found to have the signature amino acid Asp190 and Asp225 known to confer binding affinity to α2-6 sialylated glycan recep- tors. The mutation Glu190Asp between avian and human H1 HA normally would lead to the loss of a critical con- tact with α2-3 glycans, which, however, was compen- sated by the presence of Lys145 in HA of 2009 H1N1. There were four loops in 2009 H1N1 HA, 130 loop, 140 loop, 150 loop, and 220 loop, each containing one Lys, to form a positively charged ‘lysine fence’ at the base of the binding site to support optimal contacts with the α2-6 and α2-3 receptors. Based on this structural analysis, it was predicted that the HA protein of 2009 H1N1 virus can bind to the α2-6 as well as α2-3 sialylated glycan receptors, which was verified later by the carbohydrate microarray analysis in [5]. There were several other efforts in expanding the knowledge on 2009 H1N1. One study [6] investigated the three aspects of NA: the mutations and co-mutations, the stalk motifs, and the phylogenetic analysis. The po- tential mutations and strongly co-mutated positions of NA were found. A special NA stalk motif of high viru- lence, which was dominant in the past H5N1 strains, was discovered in H1N1 in 2009 for the first time. Another study [7] focused on HA and the interaction between HA and NA. The mutations of HA in 2009 H1N1 were found and mapped to the 3D homology model of H1, and the mutations on the five epitope regions on H1 were identi- fied. The distinct response patterns of HA to the changes of NA stalk motifs were discovered, illustrating the fun- ctional dependence between HA and NA. With help from the results of the first study in [6], two co-mutation networks were uncovered, one in HA and one in NA, where each mutation in one network co-mutates with the mutations in the other network across the two proteins HA and NA. These two networks residing in HA and NA separately may provide a functional linkage between the mutations that can change the drug binding sites in NA and those that can affect the host immune response or vaccine efficacy in HA. The informational spectrum method (ISM) [8] is a bioinformatics technique to study the biological func- tions of proteins with their physicochemical properties, which first translates a protein sequence into a numerical sequence based on each amino acid’s electron-ion inter- action potential (EIIP) and then the discrete Fourier transformation (DFT) is applied to it to create an infor- mational spectrum. It is believed that the protein func- tions including the protein-protein interaction are en- coded in the peaks of the informational spectrum. Highly conserved regions in a protein sequence usu- ally have functional or structural values. The active site of enzymes and the binding sites of protein receptors are typical examples of these highly conserved regions. In references [9-11], the ISM was applied successfully to characterize the conserved information pertinent to the interaction between HIV-1 and their CD4, CCR5, and CXCR4 receptors. In [12,13] the same research group applied the ISM to investigate the interaction be- tween HA and its receptors. Their findings showed that HA1 of different flu subtypes encodes one highly con- served domain that might be determinants of HA binding affinity. Our goal in this study is to extend the results in [12,13] by identifying multiple domains in HA1 associ- ated with each receptor interaction pattern. These con- served domains in HA1 might be used to develop targets for new drugs and infection control. In [12,13] it was found that the consensus informa- tional spectrum (CIS) of HA1 of influenza strains have the following characteristic dominant peaks at different IS frequencies as presented in Table 1. In this study, F(0.295) will be referred to as pandemic human H1N1 receptor interaction frequency, F(0.055) as swine recep- tor interaction frequency, F(0.076) as avian receptor in- teraction frequency, and F(0.236) as seasonal human H1N1 receptor interaction frequency. Table 1. Characteristic IS frequencies of HA proteins in 2009 H1N1, swine H1N1/H1N2, avian H5N1, and seasonal human H1N1. Subtype 2009 H1N1 Swine H1N2/H1N1 Avian H5N1 Seasonal human H1N1 Frequency F(0.295) F(0.055) F(0.076) F(0.236) Table 2. The receptor recognition domains of HA proteins in H1N1, H3N2, H5N1, and H7N7 influenza viruses. Strain Frequency Residues A/California/04/2009 (H1N1) F(0.295) 284 – 326 A/Hong Kong/213/03 (H5N1) F(0.076) 42 – 75 A/New Caledonia/20/99 (H1N1) F(0.236) 262 – 295 A/New York/383/2004 (H3N2) F(0.363) 57 – 90 A/equine/Prague/56 (H7N7) F(0.285) 28 – 61 A/Egypt/0636-NAMRU3/2007(H5N1) F(0.236) 99 – 132 A/South Carolina/1/18 (H1N1)) F(0.258) 87 – 120  W. Hu / J. Biomedical Science and Engineering 3 (2010) 114-123 Copyright © 2010 SciRes. 116 JBiSE 00.05 0.1 0.15 0.2 0.25 0.3 0.35 0.40.45 0.5 0 1 2 3 4 5 6 7 8 9 Frequency Amplitude IS of a highly conserved domain (284:326) associated with pandemic human H1N1 receptor interaction F(0.295) Figure 1. The informational spectrum of a highly conserved domain in 2009 H1N1 found in [12], which is also a part of Figure 5 in [12]. Their analysis also found the following receptor rec- ognition domains in HA proteins from H1N1, H3N2, H5N1, and H7N7 (Table 2). The IS of one such domain in A/California/04/2009 was displayed in Figure 1, which was a reproduced figure in [12]. 2. MATERIALS AND METHODS 2.1. Sequence Data All HA sequences were retrieved from the Influenza Virus Resource (http://www.ncbi/nlm.nih.giv/genomes/FLU/ FLU.html) of the National Center for Biotechnology Information (NCBI) on Nov. 20, 2009. Only the full length and unique sequences were selected. There were 450 HA sequences of human 2009 H1N1, 1228 HA se- quences of avian H5N1 from 1959 to 2009, and 83 HA sequences of swine H1N2 from 1980 to 2009. All the sequences used in the study were aligned with MAFFT [14]. 2.2. Entropy In information theory [15], entropy is a measure of dis- order or randomness associated with a random variable. Let be a discrete random variable that has a set of possible values with probabilities where ) ii p 123 ,,,... n aaa a (Px a 3 ,... n p 12 ,,ppp . The entropy H of is () l ii og i xp p In the current study, each of the n columns in a multi- ple sequence alignment of a set of HA sequences of N residues is considered as a discrete random variable i (1 ≤i ≤N) that takes on one of the 20 (n=20) amino acid types with some probability. () i x ) i has its minimum value 0 if all the residues at position i are the same, and achieves its maximum if all the 20 amino acid types ap- pear with equal probability at position i, which can be verified by the Lagrange multiplier technique. A position of high entropy means that the amino acids are often varied at this position. ( x measures the genetic diversity at position i in our current study. A brief over- view of the extensive applications of entropy in se- quence analysis, in particular the flu virus sequences, can be found in [6]. 2.3. Important Sites in HA Although there is a great variation due to high selection pressure in the HA1 sequences of various flu subtypes, the active site of HA1 is well conserved, which is lo- cated in a cleft composed of the residues 91, 150, 152, 180, 187, 191, and 192 [16]. The three amino acids at positions 187, 191 and 192 are a part of the 190 helix. The active site cleft of HA is formed by its right edge (131_GVTAA) and left edge (221_RGQAGR) (H1 num- bering), which are also commonly referred to as the 130 loop and 220 loop, respectively [17]. The human immune system responds primarily to the five epitope regions, A, B, C, D, and E, of the HA pro- tein in H1N1. Table 3 presents the 160 amino acids on the five epitope regions of HA in H1 subtype as discov- ered in [18]. 2.4. Informational Spectrum Method The informational spectrum method is a bioinformatics  W. Hu / J. Biomedical Science and Engineering 3 (2010) 114-123 Copyright © 2010 SciRes. 117 JBiSE technique that can be utilized to analyze protein sequences. Prior to this analysis, the protein sequences have to be translated into numerical sequences. One such approach is to assign each amino acid to its electron-ion interac- tion potential (EIIP), which represents the average en- ergy of the valence electrons in the amino acid (Table 4). The application of EIIP to protein function analysis as- sumes that the strength of the electromagnetic field sur- rounding the protein is indicative of its biological func- tion. This method was successful in revealing various protein properties [8]. The numerical sequence () m ) of a protein sequence is transformed into the frequency domain using DFT. The DFT coefficients ( n are defined as 2 ()( ) nm N Xn xme 1, 2,...2nN where N is the length of sequence () m. The energy density spectrum is defined as 2 * ()()()() ,SnXnX nXn 1, 2,...2nN The informational spectrum (IS) of a sequence comprises the frequencies and the amplitudes of its DFT. )(mx Peak frequencies of IS of a protein sequence reflect its biological or biochemical functions. To determine the same biological or biochemical functions of a group of protein sequences, a consensus informational spec- trum (CIS) can be used, which is defined as the prod- uct of energy density spectrum of each sequence in the group. A measure of similarity for each peak is a signal-to-noise ratio (S/N), which is defined as a ratio of signal density to the mean value of the whole spectrum [12]. The theory of CIS [8] states that: ()Sn 1) One peak only exits for a group of protein se- quences sharing the same biological function. 2) No signal peak exists for biologically unrelated protein sequences. 3) Peak frequencies are different for different bio- logical functions. Table 3. Amino acids on epitopes A, B, C, D, and E of H1 subtype (A/California/04/2009 numbering) from [18]. Epitope Amino acids Number of amino acids A 118,120,121,122,126,127,128,129,132,133,134,135,137,139,140,141,142,143,146,14 7,149,165,252,253 24 B 124,125,152,153,154,155,156,157,160,162,183,184,185,186,187,189,190,191,193,19 4,195,196 22 C 34,35,36,37,38,40,41,43,44,45,269,270,271,272,273,274,276,277,278,283,288,292,2 95,297,298,302,303,305,306,307,308,309,310 32 D 170,171,172,173,174,176,179,198,200,202,204,205,206,207,208,209,210,211,212,21 3,214,215,216,222,223,224,225,226,227,235,237,239,241,243,244,245 48 E 47,48,50,51,53,54,56,57,58,66,68,69,70,71,72,73,74,75,78,79,80,82,83,84,85,86,102, 257,258,259,260,261,263,267 34 Table 4. The electron-ion interaction potential (EIIP) of amino acids used to encode amino acids. Amino acid EIIP Amino acid EIIP L 0.0000 Y 0.0516 I 0.0000 W 0.0548 N 0.0036 Q 0.0761 G 0.0050 M 0.0823 E 0.0057 S 0.0829 V 0.0058 C 0.0829 P 0.0198 T 0.0941 H 0.0242 F 0.0946 K 0.0371 R 0.0959 A 0.0373 D 0.1263  W. Hu / J. Biomedical Science and Engineering 3 (2010) 114-123 Copyright © 2010 SciRes. 118 JBiSE 2.5. Three Consensus HA1 Sequences of 2009 Human H1N1, Avian H5N1, and Swine N1N2 We employed MAFFT to align the three consensus HA1 sequences of 2009 H1N1, avian H5N1, and swine H1N2 (Figure 2). Each consensus sequence was then used in the ISM analysis to find the highly conserved domains in HA1 of different influenza subtypes. 3. RESULTS As demonstrated in [12,13], the HA1 sequences in vari- ous influenza subtypes had a distinct propensity to in- teract with a specific receptor, and there was a region in HA1 encoding highly conserved information that might be associated with the binding preference. The main task of the present study is to explore the other parts of the HA1 sequences to find domains of the same biological function. Entropy of HA1 in each subtype of 2009 H1N1, swine H1N2, and avian H5N1 was calculated, which illustrated the most conserved positions in the HA1 se- quences of each subtype (Figures 5, 7, and 10). The ISM bioinformatics technique was applied to the three con- sensus HA1 sequences as presented in Figure 2 to un- cover the conserved domains in HA1, which might modulate receptor specificity in each subtype. In contrast, the ISM analysis in [12,13] was applied to a particular selected strain in a subtype such as A/California/04/2009 in 2009 H1N1 to find a conserved region. On the whole, the conserved domains discovered by our approach us- ing a consensus sequence had more coverage to different sequences in a subtype than the single strain approach in [12,13]. 3.1. Conserved Domains in HA1 of 2009 H1N1 We discovered three domains in HA1 of 2009 H1N1, which were located at residue positions 106 to 130, 150 to 174, and 191 to 221. The consensus sequences of the- ses domains were SSVSSFERFEIFPKTSSWPNHDSNK, 1 60 1 2009 H1N1 DTLCIGYHANNSTDTVDTVLEKNVTVTHSVNLLEDKHNGKLCKLRGVAPLHLGKCNIAGW 2 Swine H1N1 DTLCIGYHANNSTDTVDTVLEKNVTVTHSVNLLEDRHNGKLCKLRGVAPLHLGKCNIAGW 3 Avian H5N1 DQICIGYHANNSTEQVDTIMEKNVTVTHAQDILEKTHNGKLCDLDGVKPLILRDCSVAGW * :**********: ***::********: ::**. ******.* ** ** * .*.:*** 61 120 1 2009 H1N1 ILGNPECESLSTASSWSYIVETSSSDNGTCYPGDFIDYEELREQLSSVSSFERFEIFPKT 2 Swine H1N2 LLGNPECESLFTASSWSYIVETSNSDNGTCYPGDFINYEELREQLSSVSSFERFEIFPKE 3 Avian H5N1 LLGNPMCDEFINVPEWSYIVEKANPANDLCYPGNFNDYEELKHLLSRINHFEKIQIIPK- :**** *:.: ....******.:.. *. ****:* :****:. ** :. **:::*:** 121 right edge 180 1 2009 H1N1 SSWPNHDSNKGVTAACPHAGAKSFYKNLIWLVKKGNSYPKLSKSYINDKGKEVLVLWGIH 2 Swine H1N2 SSWPNHDTNRGVTAACPHAGANSFYRNLIWLVKKGNSYPKLSKSYINNKEKEVLVLWGIH 3 Avian H5N1 SSWSDHEASSGVSSACPYQGRSSFFRNVVWLIKKNNAYPTIKRSYNNTNQEDLLVLWGIH ***.:*::. **::***: * .**::*::**:**.*:**.:.:** * : :::******* 181 left edge 240 1 2009 H1N1 HPSTSADQQSLYQNADAYVFVGSSRYSKKFKPEIAIRPKVRDQEGRMNYYWTLVEPGDKI 2 Swine H1N2 HPSTSADQQSLYQNADAYVFVGSSHYSKKFTPEIAKRPKVRDQAGRMNYYWTLVEPGDTI 3 Avian H5N1 HPNDAAEQTRLYQNPTTYISVGTSTLNQRLVPKIATRSKVNGQSGRMEFFWTILKPNDAI **. :*:* ****. :*: **:* .::: *:** *.**..* ***:::**:::*.* * 241 300 1 2009 H1N1 TFEATGNLVVPRYAFAMERNAGSGIIISDTPVHDCNTTCQTPKGAINTSLPFQNIHPITI 2 Swine H1N2 TFEATGNLVVPRYAFALKRGSGSGIIISDTSVHDCNTTCQTPKGAINTSLPFQNIHPVTI 3 Avian H5N1 NFESNGNFIAPEYAYKIVKKGDSTIMKSELEYGNCNTKCQTPMGAINSSMPFHNIHPLTI .**:.**::.*.**: : : ..* *: *: :***.**** ****:*:**:****:** 301 328 1 2009 H1N1 GKCPKYVKSTKLRLATGLRNVPSIQSR- 2 Swine H1N2 GECPKYVKSTKLRMATGLRNIPSIQSR- 3 Avian H5N1 GECPKYVKSNRLVLATGLRNSPQRERRR *:*******.:* :****** *. : * Figure 2. Multiple sequence alignment of three consensus HA1 sequences in 2009 H1N1, swine H1N2, and avian H5N1. The binding sites in HA are colored in red, and the left and right edges of the binding cleft are printed in bold- face type. 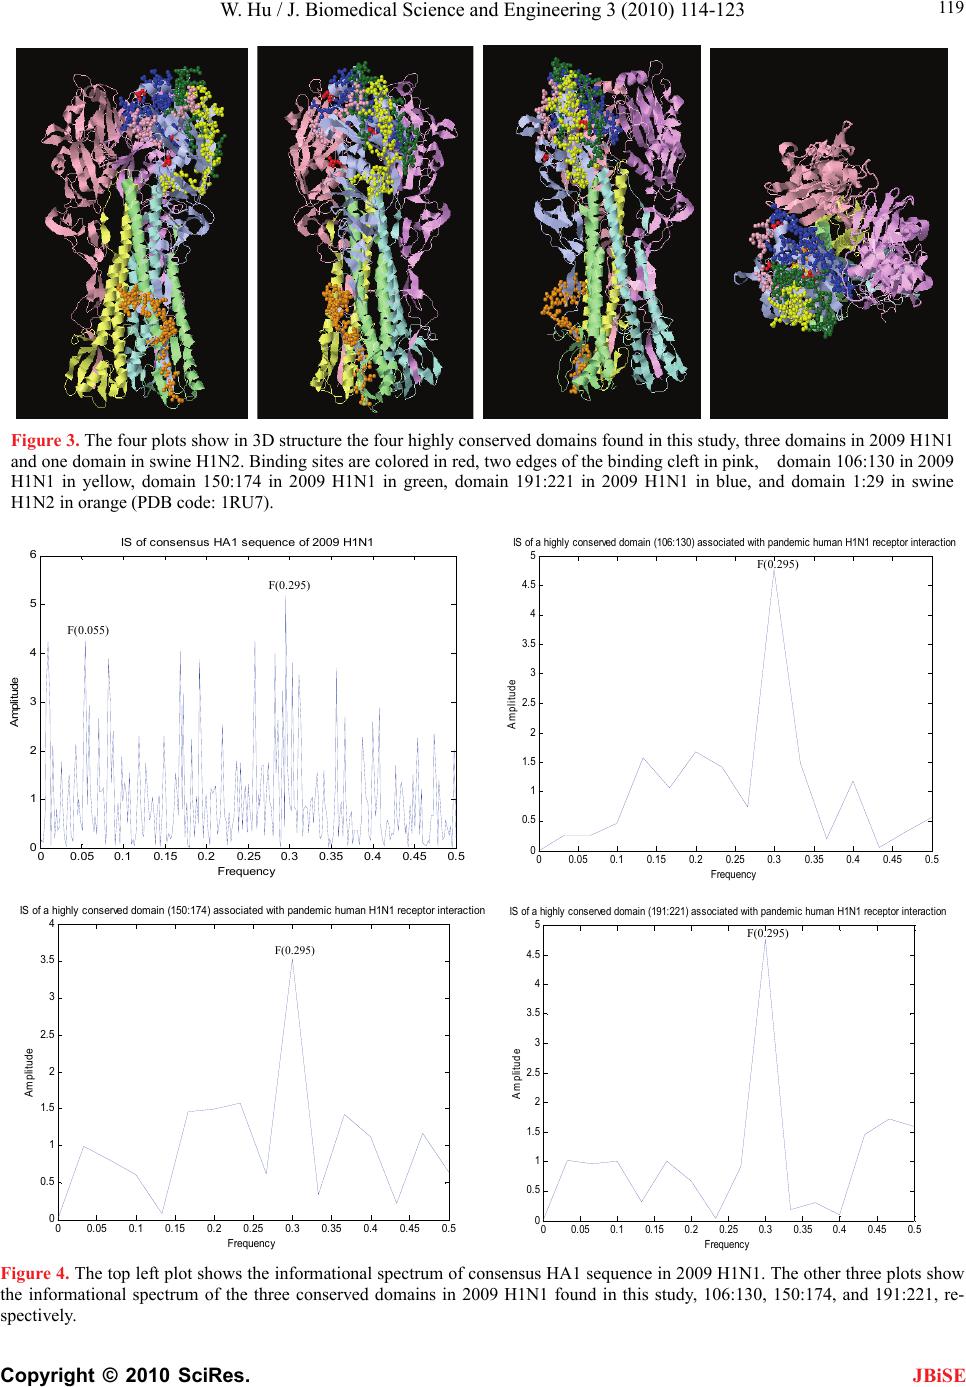 W. Hu / J. Biomedical Science and Engineering 3 (2010) 114-123 Copyright © 2010 SciRes. 119 Figure 3. The four plots show in 3D structure the four highly conserved domains found in this study, three domains in 2009 H1N1 and one domain in swine H1N2. Binding sites are colored in red, two edges of the binding cleft in pink, domain 106:130 in 2009 H1N1 in yellow, domain 150:174 in 2009 H1N1 in green, domain 191:221 in 2009 H1N1 in blue, and domain 1:29 in swine H1N2 in orange (PDB code: 1RU7). 00.05 0.10.15 0.20.25 0.30.350.4 0.45 0.5 0 1 2 3 4 5 6 IS of consensus HA1 sequence of 2009 H1N1 Frequenc y Amplitude F(0.055) F(0.295) 00.05 0.10.15 0.20.25 0.30.35 0.40.450.5 0 0.5 1 1.5 2 2.5 3 3.5 4 4.5 5 IS of a highly conserved domain (106:130) associated with pandemic human H1N1 receptor interaction Frequenc y A mplitude F(0.295) 00.05 0.1 0.15 0.2 0.25 0.3 0.350.40.45 0.5 0 0.5 1 1.5 2 2.5 3 3.5 4 IS of a highly conserved domain (150:174) associated with pandemic human H1N1 receptor interaction Frequency Amplitude F(0.295) 00.05 0.10.15 0.20.25 0.3 0.35 0.4 0.45 0. 5 0 0. 5 1 1. 5 2 2. 5 3 3. 5 4 4. 5 5 Frequency Amplitude IS of a highly conserved domain (191:221) associated with pandemic human H1N1 receptor interaction F(0.295) Figure 4. The top left plot shows the informational spectrum of consensus HA1 sequence in 2009 H1N1. The other three plots show the informational spectrum of the three conserved domains in 2009 H1N1 found in this study, 106:130, 150:174, and 191:221, re- spectively. JBiSE 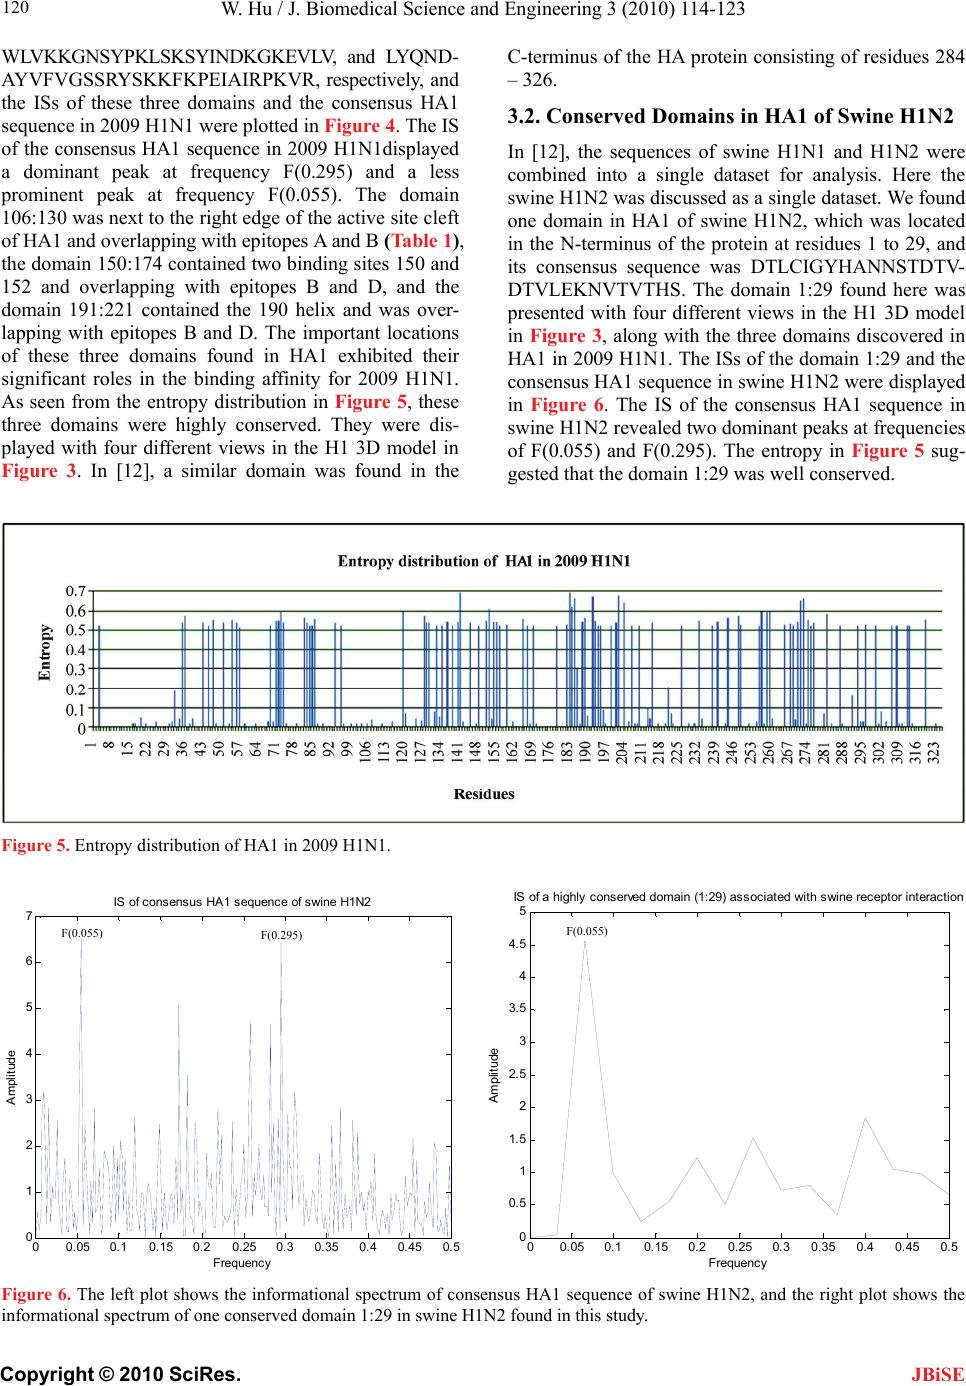 W. Hu / J. Biomedical Science and Engineering 3 (2010) 114-123 Copyright © 2010 SciRes. 120 WLVKKGNSYPKLSKSYINDKGKEVLV, and LYQND- AYVFVGSSRYSKKFKPEIAIRPKVR, respectively, and the ISs of these three domains and the consensus HA1 sequence in 2009 H1N1 were plotted in Figure 4. The IS of the consensus HA1 sequence in 2009 H1N1displayed a dominant peak at frequency F(0.295) and a less prominent peak at frequency F(0.055). The domain 106:130 was next to the right edge of the active site cleft of HA1 and overlapping with epitopes A and B (Table 1), the domain 150:174 contained two binding sites 150 and 152 and overlapping with epitopes B and D, and the domain 191:221 contained the 190 helix and was over- lapping with epitopes B and D. The important locations of these three domains found in HA1 exhibited their significant roles in the binding affinity for 2009 H1N1. As seen from the entropy distribution in Figure 5, these three domains were highly conserved. They were dis- played with four different views in the H1 3D model in Figure 3. In [12], a similar domain was found in the C-terminus of the HA protein consisting of residues 284 – 326. 3.2. Conserved Domains in HA1 of Swine H1N2 In [12], the sequences of swine H1N1 and H1N2 were combined into a single dataset for analysis. Here the swine H1N2 was discussed as a single dataset. We found one domain in HA1 of swine H1N2, which was located in the N-terminus of the protein at residues 1 to 29, and its consensus sequence was DTLCIGYHANNSTDTV- DTVLEKNVTVTHS. The domain 1:29 found here was presented with four different views in the H1 3D model in Figure 3, along with the three domains discovered in HA1 in 2009 H1N1. The ISs of the domain 1:29 and the consensus HA1 sequence in swine H1N2 were displayed in Figure 6. The IS of the consensus HA1 sequence in swine H1N2 revealed two dominant peaks at frequencies of F(0.055) and F(0.295). The entropy in Figure 5 sug- gested that the domain 1:29 was well conserved. Figure 5. Entropy distribution of HA1 in 2009 H1N1. 00.05 0.10.15 0.20.25 0.3 0.35 0.4 0.45 0.5 0 1 2 3 4 5 6 7 IS of consensus HA1 sequence of swine H1N2 Frequency A mpl itude 00.05 0.10.15 0.20.25 0.3 0.35 0.4 0.45 0. 5 0 0. 5 1 1. 5 2 2. 5 3 3. 5 4 4. 5 5 IS of a highly conserved domain (1:29) associated with swine receptor interaction Frequen cy Amplitude F(0.055) F(0.055) F(0.295) Figure 6. The left plot shows the informational spectrum of consensus HA1 sequence of swine H1N2, and the right plot shows the informational spectrum of one conserved domain 1:29 in swine H1N2 found in this study. JBiSE 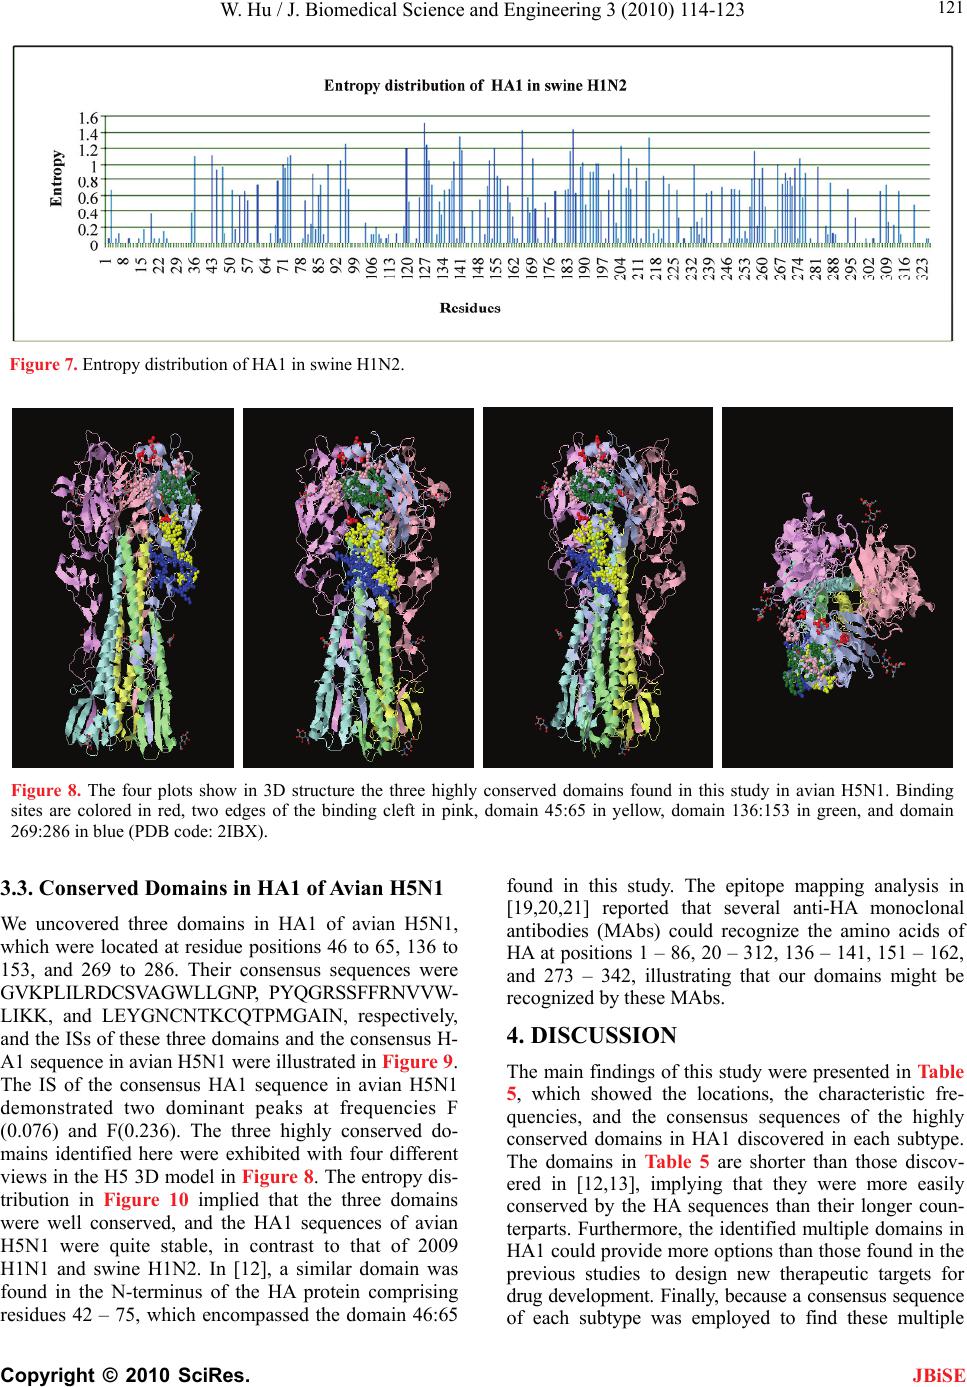 W. Hu / J. Biomedical Science and Engineering 3 (2010) 114-123 Copyright © 2010 SciRes. 121 JBiSE Figure 7. Entropy distribution of HA1 in swine H1N2. Figure 8. The four plots show in 3D structure the three highly conserved domains found in this study in avian H5N1. Binding sites are colored in red, two edges of the binding cleft in pink, domain 45:65 in yellow, domain 136:153 in green, and domain 269:286 in blue (PDB code: 2IBX). 3.3. Conserved Domains in HA1 of Avian H5N1 We uncovered three domains in HA1 of avian H5N1, which were located at residue positions 46 to 65, 136 to 153, and 269 to 286. Their consensus sequences were GVKPLILRDCSVAGWLLGNP, PYQGRSSFFRNVVW- LIKK, and LEYGNCNTKCQTPMGAIN, respectively, and the ISs of these three domains and the consensus H- A1 sequence in avian H5N1 were illustrated in Figure 9. The IS of the consensus HA1 sequence in avian H5N1 demonstrated two dominant peaks at frequencies F (0.076) and F(0.236). The three highly conserved do- mains identified here were exhibited with four different views in the H5 3D model in Figure 8. The entropy dis- tribution in Figure 10 implied that the three domains were well conserved, and the HA1 sequences of avian H5N1 were quite stable, in contrast to that of 2009 H1N1 and swine H1N2. In [12], a similar domain was found in the N-terminus of the HA protein comprising residues 42 – 75, which encompassed the domain 46:65 found in this study. The epitope mapping analysis in [19,20,21] reported that several anti-HA monoclonal antibodies (MAbs) could recognize the amino acids of HA at positions 1 – 86, 20 – 312, 136 – 141, 151 – 162, and 273 – 342, illustrating that our domains might be recognized by these MAbs. 4. DISCUSSION The main findings of this study were presented in Table 5, which showed the locations, the characteristic fre- quencies, and the consensus sequences of the highly conserved domains in HA1 discovered in each subtype. The domains in Table 5 are shorter than those discov- ered in [12,13], implying that they were more easily conserved by the HA sequences than their longer coun- terparts. Furthermore, the identified multiple domains in HA1 could provide more options than those found in the previous studies to design new therapeutic targets for drug development. Finally, because a consensus sequence of each subtype was employed to find these multiple 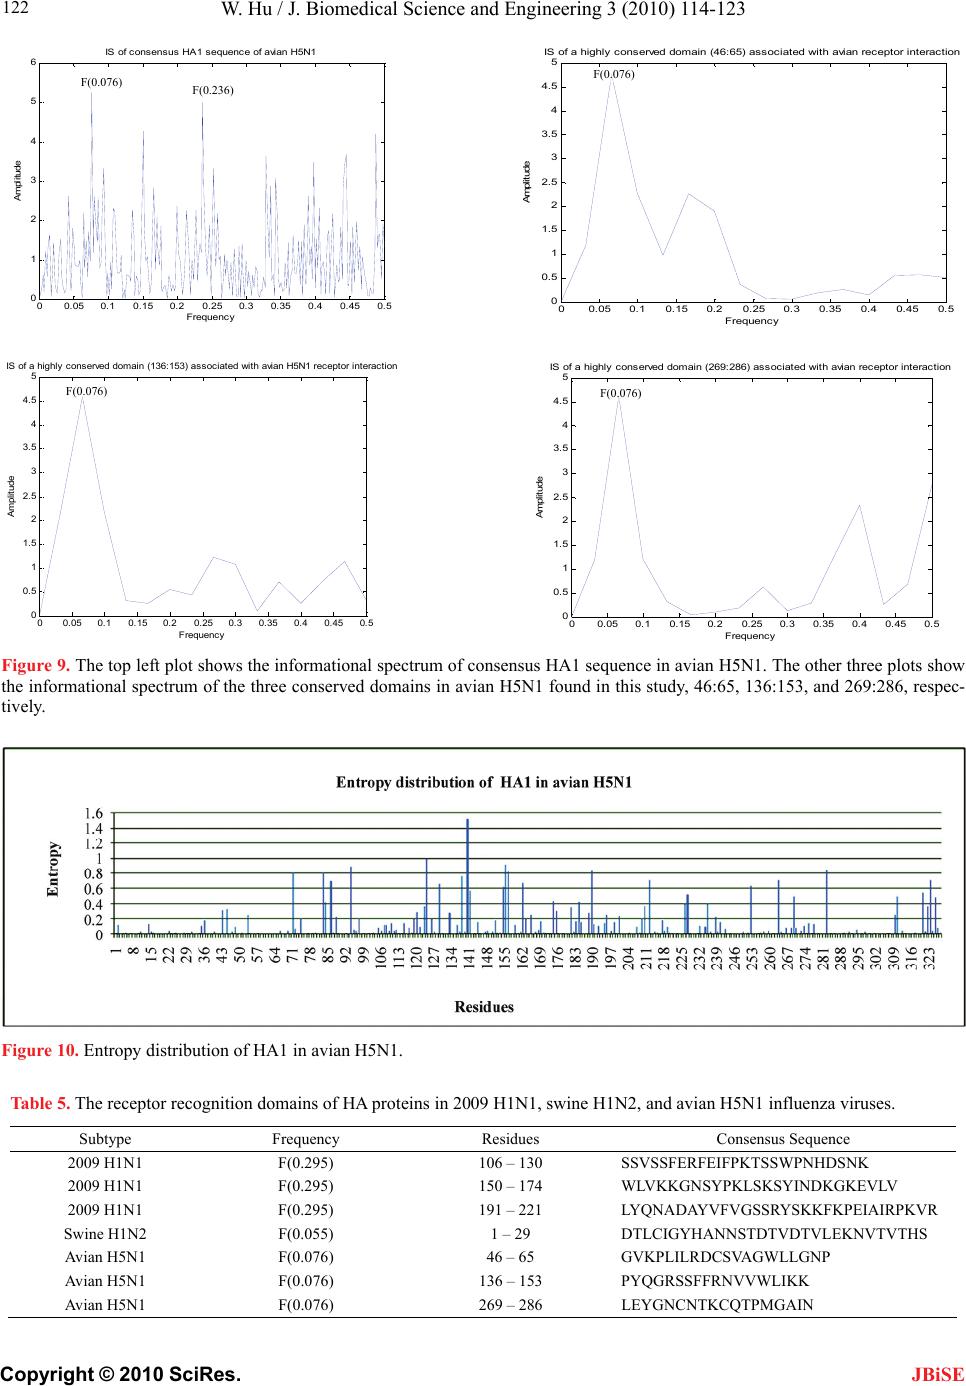 W. Hu / J. Biomedical Science and Engineering 3 (2010) 114-123 Copyright © 2010 SciRes. 122 JBiSE 00.05 0.10.15 0.20.25 0.30.35 0.4 0.45 0.5 0 1 2 3 4 5 6 Frequency Amplitude IS of consensus HA1 sequence of avian H5N1 00.05 0.10.15 0.20.25 0.30.350.4 0.450.5 0 0.5 1 1.5 2 2.5 3 3.5 4 4.5 5 IS of a highly conserved domain (46:65) associated with avian receptor interaction Amplitude Frequenc y F(0.076) F(0.076) F(0.236) 00.05 0.10.15 0.20.25 0.3 0.35 0.4 0.45 0.5 0 0.5 1 1.5 2 2.5 3 3.5 4 4.5 5 IS of a highly conserved domain (136:153) associated with avian H5N1 receptor interactio Frequenc y Ampl i t ude 00.05 0.10.15 0.20.25 0.3 0.350.40.45 0.5 0 0. 5 1 1. 5 2 2. 5 3 3. 5 4 4. 5 5 Frequency Ampli tude IS of a highly conserved domain (269:286) associated with avian receptor interaction F(0.076) F(0.076) Figure 9. The top left plot shows the informational spectrum of consensus HA1 sequence in avian H5N1. The other three plots show the informational spectrum of the three conserved domains in avian H5N1 found in this study, 46:65, 136:153, and 269:286, respec- tively. Figure 10. Entropy distribution of HA1 in avian H5N1. Table 5. The receptor recognition domains of HA proteins in 2009 H1N1, swine H1N2, and avian H5N1 influenza viruses. Subtype Frequency Residues Consensus Sequence 2009 H1N1 F(0.295) 106 – 130 SSVSSFERFEIFPKTSSWPNHDSNK 2009 H1N1 F(0.295) 150 – 174 WLVKKGNSYPKLSKSYINDKGKEVLV 2009 H1N1 F(0.295) 191 – 221 LYQNADAYVFVGSSRYSKKFKPEIAIRPKVR Swine H1N2 F(0.055) 1 – 29 DTLCIGYHANNSTDTVDTVLEKNVTVTHS Avian H5N1 F(0.076) 46 – 65 GVKPLILRDCSVAGWLLGNP Avian H5N1 F(0.076) 136 – 153 PYQGRSSFFRNVVWLIKK Avian H5N1 F(0.076) 269 – 286 LEYGNCNTKCQTPMGAIN  W. Hu / J. Biomedical Science and Engineering 3 (2010) 114-123 Copyright © 2010 SciRes. 123 JBiSE domains in HA1, they are more representative of the strains in each subtype than those obtained in the previ- ous studies. 5. CONCLUSIONS Identifying the conserved characteristics of influenza viruses relevant to receptor binding preference is an im- portant topic in flu research. The informational and structural properties of HA1 associated with recep- tor-virus interaction in different subtypes were investi- gated in [12,13]. To extend the previous results, we aimed to uncover multiple domains in HA1 of 2009 H1N1 and avian H5N1 that might modulate the receptor binding patterns, thus to expand our repertoire of these key regions in HA1. Due to the important locations of these domains, they might serve as potential targets for new drugs and treatment of influenza infection. The observations in [12,13] suggested that the 2009 H1N1 strains will continue to mutate in their HA gene, which could further favor the human interaction pattern by increasing the amplitude at frequency F(0.295) and at the same time decreasing that at frequency F(0.055). Given this trend, we must remain vigilant for additional mutations that can render a switch of the binding pref- erence of 2009 H1N1. 6. ACKNOWLEDGEMENTS We thank Houghton College for its financial support. REFERENCES [1] Alexandra, G., Alexander, T., Galina, P., Nicolai, B., A- manda, B. and Alexander, K. (2006) Evolution of the re- ceptor binding phenotype of influenza A (H5) viruses. Virology, 344, 432-438. [2] Tatsunori, I., Kaori, F., Katsuhisa, N., Sachiko, A.H., Yuji, M., Hirofumi, W. and Shigenori, T. (2008) Theoretical a- nalysis of binding specificity of influenza viral hemag- glutinin to avian and human receptors based on the frag- ment molecular orbital method. Computational Biology and Chemistry, 32, 198-211. [3] Shinya, Y., Yasuo, S., Takashi, S., Mai, Q.L., Chairul, A. N.S., Yuko, T., Yukiko, M. et al. (2006) Haemagglutinin mutations responsible for the binding of H5N1 influenza A viruses to human-type receptors. Nature, 444(7117), 378-82. [4] Venkataramanan, S., Kannan, T., Rahul, R., Raguram, S., Zachary, S., Sasisekharan, V. and Ram, S. (2009) Extra- polating from sequence—the 2009 H1N1 “swine” influ- enza virus. Nature Biotechnology, 27, 510-513. [5] Robert, A.C., Angelina, S.P., Steve, W., Tatyana, M., Liu, Y., Chai, W., Maria, A.C.R., Zhang, Y., Markus, E., Ma- koto, K., Alan, H., Mikhail, M. and Ten, F. (2009) Re- ceptor-binding specificity of pandemic influenza A (H1N1) 2009 virus determined by carbohydrate microarray. Na- ture Biotechnology, 27, 797-799. [6] Hu, W. (2009) Analysis of correlated mutations, stalk mo- tifs, and phylogenetic relationship of the 2009 influenza a virus neuraminidase sequences. Journal of Biomedical Science and Engineering, 2(7), 550-558. [7] Hu, W. (2010) The interaction between the 2009 H1N1 influenza a hemagglutinin and neuraminidase: Mutations, co-mutations, and the NA stalk motifs. Journal of Bio- medical Science and Engineering, 3, 1–12. [8] Cosic, I. (1997) The resonant recognition model of mac- romolecular bioreactivity—theory and application. Birk- hauser Verlag, Berlin. [9] Veljkovic, V. and Metlas, R. (1988) Identification of na- nopeptide from HTLV3, LAV and ARV-2 envelope gp120 determining binding to T4 cell surface protein. Cancer Biochem Biophys, 10, 91-106. [10] Veljkovic, V., Veljkovic, N., Este, J.A., Huther, A. and ietrich, D.U. (2007) Application of the EIIP/ISM bioin- formatics concept in development of new drugs. Curr Med Chem, 14, 441-453. [11] Veljkovic, V., Veljkovic, N. and Metlas, R. (2004) Mo- lecular makeup of HIV-1 envelope protein. Int Rev Im- munol, 23, 383-411. [12] Veljkovic, V., Niman, H.L., Glisic, S., Veljkovic, N., Pero- vic, V. and Muller, C.P. (2009) Identification of hemag- glutinin structural domain and polymorphisms which may modulate swine H1N1 interactions with human receptor. BMC Structural Biology, 9, 62. [13] Veljkovic, V., Veljkovic, N., Muller, C.P., Müller, S., Gli- sic, S., Perovic, V. and Köhler, H. (2009) Characteriza- tion of conserved properties of hemagglutinin of H5N1 and human influenza viruses: Possible consequences for therapy and infection control. BMC Struct Biol, 7, 9-21. [14] Katoh, K., Kuma, K., Toh, H. and Miyata, T. (2005) M- AFFT version 5: Improvement in accuracy of multiple sequence alignment. Nucleic Acids Res, 33, 511-518. [15] MacKay, D. (2003) Information theory, inference, and learning algorithms. Cambridge University Press. [16] KováccaronOVá, A., Ruttkay-Nedecký, G., HaverlíK, I. K. and Janecccaronek, S. (2002) Sequence similarities and evolutionary relationships of influenza virus a hemagglu- tinins. Virus Genes, 24, 57-63. [17] Gamblin, S.J., Haire, L.F., Russell, R.J., Stevens, D.J., Xiao, B., Ha, Y. et al. (2004) The structure and receptor binding properties of the 1918 influenza hemagglutinin. Science, 303, 1838-1842. [18] Michael, W.D. and Pan, K. (2009) The epitope regions of H1-subtype influenza A, with application to vaccine ef- ficacy. Protein Engineering, Design & Selection, 22, 543- 546. [19] Du, A., Daidoji, T., Koma, T., Ibrahim, M.S., Nakamura, S., de Silva, U.C., Ueda, M., Yang, C.S., Yasunaga, T., Ikutu, K. and Nakaya, T. (2009) Detection of circulating Asian H5N1 viruses by a newly established monoclonal antibody. Biochem Biophys Res Commun, 378, 197-202. [20] Kaverin, N.V., Rudneva, I.A., Govorkova, E.A., Timo- feeva, T.A., Shilov, A.A., Kochergin-Nikitsky, K.S., Kry- lov, P.S. and Webster, R.G. (2007) Epitope mapping of the hemagglutinin molecule of a highly pathogenic H5N1 influenza virus by using monoclonal antibodies. J. Virol., 81, 12911-12917. [21] Yang, M., Clavijo, A., Graham, J., Salo, T., Hole, K., Berhane, Y. (2009) Production and diagnostic application of monoclonal antibodies against influenza virus H5, J Virol Methods, 162, 194-202.
|