Paper Menu >>
Journal Menu >>
 Energy and Power Engineering, 2010, 53-64 doi:10.4236/epe.2010.21009 Published Online February 2010 (http://www.scirp.org/journal/epe) Copyright © 2010 SciRes EPE The Implications of Fluorescent Lamp Electronic Ballast Dimming —An Experimental Study Sheryl G. Colaco1, Ciji P. Kurian2, V. I. George1, Anitha M. Colaco3 1Department of Instrumentation & Control Engineering, Manipal Institute of Technology, Manipal, India 2Electrical & Electronics Engineering, Manipal Institute of Technology, Manipal, India 3Electrical & Electronics Engineering, NMAMIT, Nitte, India Email: sheryl_grace2001@yahoo.co.in Abstract: In recent years, fluorescent lamp dimming controls are an integral part of daylight artificial light integrated schemes intended for realization of energy savings. However, dimming, like any lighting option, presents its own particular challenges and poten tial tradeoffs. In v iew of this, the present manuscript depicts the preliminary work progress carried out to arrive at a comprehensive idea on dimming implications on key factors: electrical characteristics, photometric distributions of lighting systems and influence on quality as well as quantity of visual environment. The objective is to experimentally establish the acceptable range of dimming control voltage that would satisfy both electrical and photometric performance of luminaire. The vital part of the paper is devoted towards presentation of measurement results. For the experimental analysis, three representative samples of different commercial analog 1-10VDC electronic dimmable ballasts and fluorescent fixtures are compared and evaluated over their control voltage dimming range. Keywords: dimming, power factor, power quality, chromaticity, light intensity, illuminance 1. Introduction In the present scenario, electronic dimming ballasts are crucial in automatic control and dimming function for energy-management applications such as daylight harv- esting [1]. Over many years, in spite of many reports and case studies cite the advantages of daylight linked auto- matic light dimming systems; comparatively very less schemes have been implemented [2,3]. Part of the reason could be attributed to the issues associated with lamp dimming that have been debated during the last few years. A number of literatures in print state that at some stage during deep dimming; electronic dimming ballast exhibit poor performance reflected by dramatic deterio- ration of electric and photometric characteristics [4] Im- portant concerns related to dimming include lamp life, perceived brightness, perception of light level reduction, color shift, power quality and energy efficiency [3]. Many past studies address these issues separately. The effect of dimming on lamp life was investigated by Tetri and Gligor [5]. Their experimental results indicate that mortality was higher in the dimmed test groups than in the undimmed test groups. Further their lamp life test result showed that with electronic ballasts lamps reached their nominal life even if the lamps are dimmed statically or dynamically. A study by Akashi et al. [6] on the detec- tion and acceptability of temporarily reduced light levels showed that a reduction of 15% in illuminance levels is the approximate threshold for noticing changes under typical office lighting conditions. Further their study revealed, light level reductions that are deemed accept- able in an office environment ranges from approximately 33% to 50% depending on the office task and whether the occupants were aware of the purpose and benefits of dimming. Literature reports and utilities show an in- creased concern about the power quality aspects due to dimming of electronic ballasts [7,8]. Experimental tests performed by National Lighting Product Information Program (NLPIP)[9] on electronic dimmable ballasts of T8 and CFL lamps document that progressive decrease in dimming levels are associated with increase in voltage as well as current THD accompanied by corresponding di- minishing of power factor at minimum light output. In their separate experimental study conducted by Benoit et al. [10] and Doulos et al. [11] showed that power factor decreases in function of dimming depth due to subse- quent setting up of harmonics while dimming. Further, inorder to quantify energy savings from dimming ballasts Doulos et al. [11] performed various sets of electrical and illuminance measurements on eighteen commercial  S. G. COLACO ET AL. Copyright © 2010 SciRes EPE 54 ballasts at different dimming levels. The authors [11] developed polynomial functions between light output and consumed power to reckon the relative differences in energy savings. The chromaticity of a fluorescent lamp is a supplementary parameter used to gauge light quality. The adverse effect of dimming when it lowers the lum- inous efficacy of the light source or changes its colour requires careful inspection. The present communication reports the preliminary study of an ongoing research project on promotion of daylighting for energy conserva- tion in a daylight artificial light integrated scheme. This paper is organized as follows. Following a brief discus- sion on problem statement in Section 2, the main sec- tions of this paper includes experimental methodology in Section 3, presentation of measurement results in Section 4 and finally, brief conclusions are deduced in Section 5. It is envisaged that the information from these studies would be of assistance to architect, the engineer, the lighting designer or a combination of these during the initial stage when different daylighting schemes and concepts are bei ng developed. 2. Pr oble m Statement The performance characteristic of lamps and ballasts usually vary from one manufacturer to another. Therefore prior to new lighting installations not only choice of the lamp make is important but also there is a need to study electrical and photometric characteristics of luminaire. Obviously this could also serve as an important starting datum for analysis and optimization of installations per- formances in buildings. Issues related to electronic bal- last dimming on fluorescent lamp and visual perform- ance characteristics are the subject considered for dis- cussions in this paper. This paper seeks to put into per- spective the subject of fluorescent lamp dimming in a manner that has not been discussed previously. The in- tention is to ascertain th e preferable range of ballast con- trol signal voltage that does not deteriorate electrical characteristics, photometric distributions of lighting sys- tems and visual environment quality as well as quantity. For practical evaluation, three separate analogs dimming ballast each supplied by different manufacturer and most commonly employed for daylight responsive dimming applications in Indian offices are analyzed. 3. Experimental Methodology The methodology developed in this work combines elec- trical; and photometric measurements including com- puter simulations. The customary testing and measure- ment procedures specified by CIE and IESNA were fol- lowed [12–15]. The experimental tests were performed under a standard set of conditions at the Photometry Laboratory of Manipal Institute of Technology, Manipal (India). Three 230V, 236W analog electronic dimming ballasts with corresponding pairs of T8 fluorescent lamps supplied by 3 different manufacturers Osram, Wipro & Philips (labeled in this paper as EDB-A, EDB-B, EDB-C respectively) were examined for practical comparison and evaluation. In order to assess the performance char- acteristic during dimming; twin 36W fluorescent lamps were dimmed by manual adjustment of dimming ballast control signal DC voltage from 1 to 10V (up or down) with a digital 0-30V regulated DC power supply. Prior to taking measurements the tested lamps were pre burned for full light output for 100 hours before dimming with a supply voltage of 230V a.c. 50 Hz and ballast control voltage of 10V. The adjustment from one dimming level to another level was done gradually. The lamps were tested on 10 different ballast control voltages in step dif- ference of 1 volt. To ensure that the temperature of each lamp stabilized during testing, at each control voltage level the lamps were operated for at least 10 min. All the measurements were performed at an ambient temperature of 26℃2。with a stabilized line vo ltage of 230V a.c. To assess the performance characteristics; dimming ballast control voltage (1-10V DC) formed the variable parameter. The dependent variables include electrical parameters (i.e., current, power factor, active power, voltage and current harmonics) and photometric parame- ters (i.e., luminous intensity, CCT, CU, chromaticity). The following measurements were carried out to provide the technical background for evaluating the electric and photometric characteristics of tubular fluorescent lamp systems all through dimming control signal voltage range of electronic dimming ballast. The luminous flux of the lamp in each dimming mode was measured in an integrating sphere with an inner diameter of 2.0 m. Power line voltage and line current harmonic spectrum together with active power, apparent power and power factor was recorded using FLUKE 43B power quality analyzer. Lamp Chroma- ticity coordinates were gauged using Konica Minolta CL-200 Chroma meter contained in a Color chroma- ticity coordinate measuring unit. The estimation of lu- minaire luminous light intensity in C0-180 and C 90-270 planes involved collection of illuminance data in both the specified planes in a darkroom at a fixed distance of 5m from luminaires mounted on a swing arm Goniophotometer. The luminous intensity was then calculated from preceding illuminance measurement using the inverse square distance law. Lighting calcula- tion so ftware tha t this autho rs typic ally u ses are AGI 32 photometric toolbox for computation of CU chart and Relux light simulation software for rendering of results for visualization of the effects of dimming on quality and quantity of illuminance in an interior. Luminaire candela power distribution plots and 3D mesh plots of work plane illuminance distribution were obtained us- ing Matlab; a computational software [16].  S. G. COLACO ET AL. Copyright © 2010 SciRes EPE 55 4. Presentation of Measurement Results Analog electronic dimming ballasts permit the light out- put of the lamp to be continuously controlled over a ran- ge of approximately 1% to 100% of full light output.The main method of analog control utilizes a low voltage control signal in the range 1-10V dc. A separate pair of control cables runs from the controller to luminaires in the controlled group. Dimming is accomplished by adju- stment of control signal voltage of the ballast. This modi- fies the amplitude of current flow in the fluorescent lamp to achieve variation in emitted lamp ligh t output. Consis- tent dimming behaviour varies among different ballasts made by different manufacturers. The ensuing subsectio- ns enumerate the impacts of dimming on performance characteristics of fluorescent lamps. 4.1. Effect on Electrical Characteristics Figures 1(a) and 1(b) illustrate the decrease in current and subsequently r ed u ction in pow er co nsumptio n du ring dimming down from 10V to 0V. All the reported ballast lighting system has a maximum active power consump- tion of approximately 72W. During dimming down process the reduction in active power consumption ranges from a maximum of 100% at 10V to a minimum of 16%, 19% and 17% at 0V; for ballasts EDB-A, EDB-B and EDB-C respectively. Figures 1(c) and 1(d) depict the variation of percentage light output as a func- tion of control voltage and percentage input power re- spectively. It is noted that for all the ballasts neither the light output nor the system power consumption has a linear relationship with control voltage. Studies of Choi et al. [17] report that this nonlinear variation in light o ut- put with different dimming control voltage is one among many other reasons for unreliability and inaccuracy of daylight dimming systems, seeing that a particular con- trol voltage cannot be predicted when a certain light output is required. In order to achieve performance con- sistency of electronic dimming ballast especially for PC based light control algorithms, authors [17] suggests the application of best fit functions using regression meth- ods that would satisfy the relationship between control voltage of dimming ballast and its corresponding light output characteristics. As seen form Figure 1(d), at a control voltage of 0V; all the test lamps emit approxi- mately 1% of light output with a minimum power con- sumption of approximately 20%. It is noticed during the experiment that neither the lamp extinguish es nor flick- ers at minimum control voltage. Figure 1(e) shows the variation of luminous efficacy as a function of percent- age active power consumption. The luminous efficacy drops from a maximum of 43%, 45% and 42% to a minimum of approximately 1% for EDB-A, EDB-B and EDB-C lamps respectively. It is also observed from Figure 1(e) that luminous efficacy of all the tested lamps stays approximately constant with dimming until about 57% of input power; thereafter it decreases drastically. (e)(d) (c) (b)(a) 012345678910 50 100 150 200 250 300 350 Cont rol Voltage ( V) Current (mA) EDB-A EDB-B EDB-C 0 1 2 3 45 6 7 8 910 0 10 20 30 40 50 60 70 80 Cont ro l Vo ltage (V) Power Consumption (W) EDB-A EDB-B EDB-C 012345678910 0 10 20 30 40 50 60 70 80 90 100 Cont rol Voltag e ( V) lumen output ratio(%) EDB-A EDB-B EDB-C 010 20 30 40 50 60 70 0 10 20 30 40 50 Input Power(W ) Luminous Efficacy(%) EDB-A EDB-B EDB-C 020 40 6080 100 0 20 40 60 80 100 Power Consumption ratio (%) lumen output ratio (%) EDB-A EDB-B EDB-C (f) 0 1 23 45 6 78 910 0.75 0.8 0.85 0.9 0.95 1 Cont rol Voltag e ( V) Po wer F acto r (lag) EDB-A EDB-B EDB-C Figure 1. Measured electrical characteristics over the control voltage dimming range  S. G. COLACO ET AL. Copyright © 2010 SciRes EPE 56 (a)(b) (c) 0100 200 300400 500 600 700 0 10 20 30 40 50 60 70 80 90 100 Harmoni c Frequency (Hz) Current THD (%) EDB-A THDr=6.4% EDB-B THDr=6.2% EDB-C THDr=5.5% 0100 200 300 400 500 600 700 0 10 20 30 40 50 60 70 80 90 100 Harmoni c Frequency (Hz) Current THD (%) EDB-A T HD r =7.0% EDB-B THD r =6.4% EDB-C THD r =6.1% 0100 200 300 400 500 600 700 0 10 20 30 40 50 60 70 80 90 100 Harmonic Frequency (Hz) Current THD (%) EDB-A T HD r =7.7% EDB-B THD r =7.7% EDB-C THD r =7.5% 0100 200 300 400 500 600 700 0 10 20 30 40 50 60 70 80 90 100 Harmonic Frequency (Hz) Current THD (%) EDB-A THD r =9.6% EDB-B THD r =9.3% EDB-C THD r =10.0% 0100 200 300 400 500 600 700 0 10 20 30 40 50 60 70 80 90 100 Harmoni c Frequency (Hz) Current THD (%) EDB-A THD r =11.3% EDB-B THD r =11.1% EDB-C THD r =11.7% 0100 200 300 400 500 600 700 0 10 20 30 40 50 60 70 80 90 100 Harmonic Frequency (Hz) Current THD (%) EDB-A THD r =15.1% EDB-B THD r =12.1% EDB-C THD r =16.0% 0100 200 300 400 500 600 700 0 10 20 30 40 50 60 70 80 90 100 Harmonic Frequency (Hz) Current THD (%) EDB- A THD r =17.5% EDB- B THD r =14.0% EDB- C THD r =18.3% 0100 200 300 400 500 600 70 0 0 10 20 30 40 50 60 70 80 90 100 Harmonic Frequency (Hz) Current THD (%) EDB- A THD r =25.7% EDB- B THD r =20.1% EDB- C THD r =26.2% 0100 200 300 400 500 600 700 0 10 20 30 40 50 60 70 80 90 100 Harmonic Frequency (Hz) Current THD (%) EDB- A THD r =30.0% EDB- B THD r =26.7% EDB- C THD r =32.4% 0100 200 300 400 500 600 700 0 10 20 30 40 50 60 70 80 90 100 Harmonic Frequency (Hz) Current THD (%) EDB- A THD r =36.8% EDB- B THD r =42.0% EDB- C THD r =46.1% (d) (e)(f) (g) (h) (i)(j) Figure 2. Current harmonic spectra at decreasing ballast dimming voltages a) 10V b) 9 V c) 8v d) 7v e) 6v f) 5v g) 4V h) 3V i) 2V j) 1V Figure 1(f) demonstrates the deterioration of power fac- tor with reduction in control voltage. The power factor reduces from approximately 0.98 to 0.83, 0.8 and 0.78 for EDB-A, EDB-B and EDB-C lighting system respec- tively. This decline in power factor is attributed to sur- facing of lower odd order harmonics during dimming. The influence of dimming on power quality is discussed in next Subsection 4.1.1. A mathematical relationship between power factor and harmonics is given by Equation (1) [18 ]. 2 1 .cos() 1 pf THD (1) Additionally, the electricity supply companies require that the power factor at which the supply is u sed shall be maintained at not less than 0.9 lagging. Referring to Figure 1(e), for dimming voltages below 3V power fac- tor of the tested ballasts lies below 0.9. 4.1.1 Power Quality Power quality issues are concerned with growing presen- ce of line harmonic distortions characterized by poor po- wer factor. Harmonics are frequencies that are integral multiples of the fundamental frequency. Harmonics ema- nate whenever the supply wave shape is distorted from a pure sine wave. In electronic ballast system, the narrow current pulses drawn by the conventional rectifier-capa- citor type interface is rich in harmonics [19]. A common measure of distortion in current and voltage is defined by percentage Total Harmonic Distortion. Industry standards for harmonic current distortion fro- m electronic lamp systems have not been formally esta- blished [2 0]. AN SI C8 2.77 s ets a maxi mum cu rrent THD limit of 32% for the lighting equipment [21]. According to IEEE 519 and IEC 61000-3-2 [22,23], the current THD and voltage THD limits for electronic ballasts is 20% and 5% respectively. Current and voltage harmonic spectra for the different lamps used in the study are pre- sented in Figure 2 and Figure 3 respectively. Though the investigated ballasts were equipped with harmonic sup- pression filters by the manufacturers; the significantly distorted current during dimming is possibly owed to the construction me- thod in order to decrease the ballast size and cost. The bar Figures 2(a)–(j) shows the individual harmonic distortion expressed in percent of the funda- mental current as defined by the formula in Equation (2)  S. G. COLACO ET AL. Copyright © 2010 SciRes EPE 57 (a)(b) (c)(d) 50150 250350 450 550 650 0 10 20 30 40 50 60 70 80 90 100 Harmonic Frequency (Hz) Voltage THD (%) EDB-A THD r =1.7% EDB-B THD r =1.7% EDB-C THD r =1.7% 50150 250 350 450 550 650 0 10 20 30 40 50 60 70 80 90 100 Harmonic Frequency (Hz) Voltage THD (%) EDB-A THD r =1.6% EDB-B THD r =1.5% EDB-C THD r =1.5% 50150 250 350 450 550 650 0 10 20 30 40 50 60 70 80 90 100 Harmonic Frequency (Hz) Voltage THD (%) EDB-A THD r =1.5% EDB-B THD r =1.4% EDB-C THD r =1.5% 50150 250350 450 550 650 0 10 20 30 40 50 60 70 80 90 100 Harmonic Frequency (Hz) Voltage THD (%) EDB-A THD r =1.4% EDB-B THD r =1.4% EDB-C THD r =1.5% 50150250350 450550 650 0 10 20 30 40 50 60 70 80 90 100 Harmonic Frequency (Hz) Voltage THD (%) EDB-A THD r =1.8% EDB-B THD r =1.9% EDB-C THD r =1.7% 50150 250 350 450 550 650 0 10 20 30 40 50 60 70 80 90 100 Harmonic Frequency (Hz) Voltage THD (%) EDB-A THD r =2.5% EDB-B THD r =2.5% EDB-C THD r =2.6% 50150 250 350 450 550 650 0 10 20 30 40 50 60 70 80 90 100 Harmonic Frequency (Hz) Voltage THD (%) EDB-A THD r =2.4% EDB-B THD r =2.5% EDB-C THD r =2.4% 50150 250350 450 550 650 0 10 20 30 40 50 60 70 80 90 100 Harmonic Frequency (Hz) Voltage THD (%) EDB-A THD r =2.1% EDB-B THD r =2.1% EDB-C THD r =1.9% 50150250 350 450 550 650 0 10 20 30 40 50 60 70 80 90 100 Harmonic Frequency (Hz) Voltage THD (%) EDB-A THD r =2.6% EDB-B THD r =2.7% EDB-C THD r =2.7% 50150250 350 450 550 650 0 10 20 30 40 50 60 70 80 90 100 Harmonic Frequency (Hz) Voltage THD (%) EDB-A THD r =2.6% EDB-B THD r =2.7% EDB-C THD r =2.7% (e)(f)(g) (h) (i)(j ) Figure 3. Voltage harmonic spectra at decreasing ballast dimming voltages a) 10V b) 9 V c) 8v d) 7v e) 6v f) 5v g) 4V h) 3V i) 2V j) 1V 14 2 2 1 n n I THD I (2) As depicted in Figure 2(a) through (j) when the lamps are dimmed down from 10V to 1V the spectrum of cur- rent is characterized by emergence and elevation of ma- gnitudes of third and fifth order harmonic components while dimming. Ballast B accounts a lower current THD (except at 1V) compared to other ballast A and ballast C. On an average for all the ballasts the line current THD increases from a minimum of 6.0% at 10V to maximum of 42.0 % at 1V. From the measurements results, it is clear that for the reported ballasts; THD in current lies within recommended IEEE 519 for control voltage above 3V. Similarly, for control voltage more than 2V current THD is less than ANSI C82.77 limits. Bar Figures 3(a)–(j) depicts the voltage harmonic spectra during lamp dim- ming down proce ss. On an averag e for all the tested bal- lasts line voltage THD lies between 1.6% at 10V to 2.6% at 1V complying with IEEE 519 standard voltage limit of 5%. Additionally, it is observed during dimmin g that line current and line voltage crest factor is below 1 .7 . 4.2 Effect on Photometric Characteristics Table 1 illustrates the influence of dimming on candela power distribution curves and CU values of luminaires under examination. Light distribution curves are curves defining variation of luminous intensity with angle of emission in a C 0-180 and C 90-270 plane, passing thou- gh centre of luminaire [24]. Furthermore specifiers use the coefficient of utilization chart to assess how effectively luminaire delivers light to a work plane. Referring to the polar curves presented in column 2 of Table 1; whilst dimming down from 10 to 1V, EDB-B has a lower light intensity compared to EDB-A and EDB-C. The candela power of the lamp EDB–A is downsized from approxi- mately 2000 cd/1000 lm to approximately 65 cd/1000 lm. For EDB-B and EDB-C lamps the light intensity value decreases from approximately 1800 cd/ 1000lm to 60cd/ 1000lm. It is observed that there is not much deviation in the light distribution contour shape at different dimming levels. However, it is noticed that the light distribution pattern is sligh tly affected for control voltage less than 4V for EDB-C luminaire and below 2V for EDB-A and EDB-B lamps respectively, the luminaire efficiency while 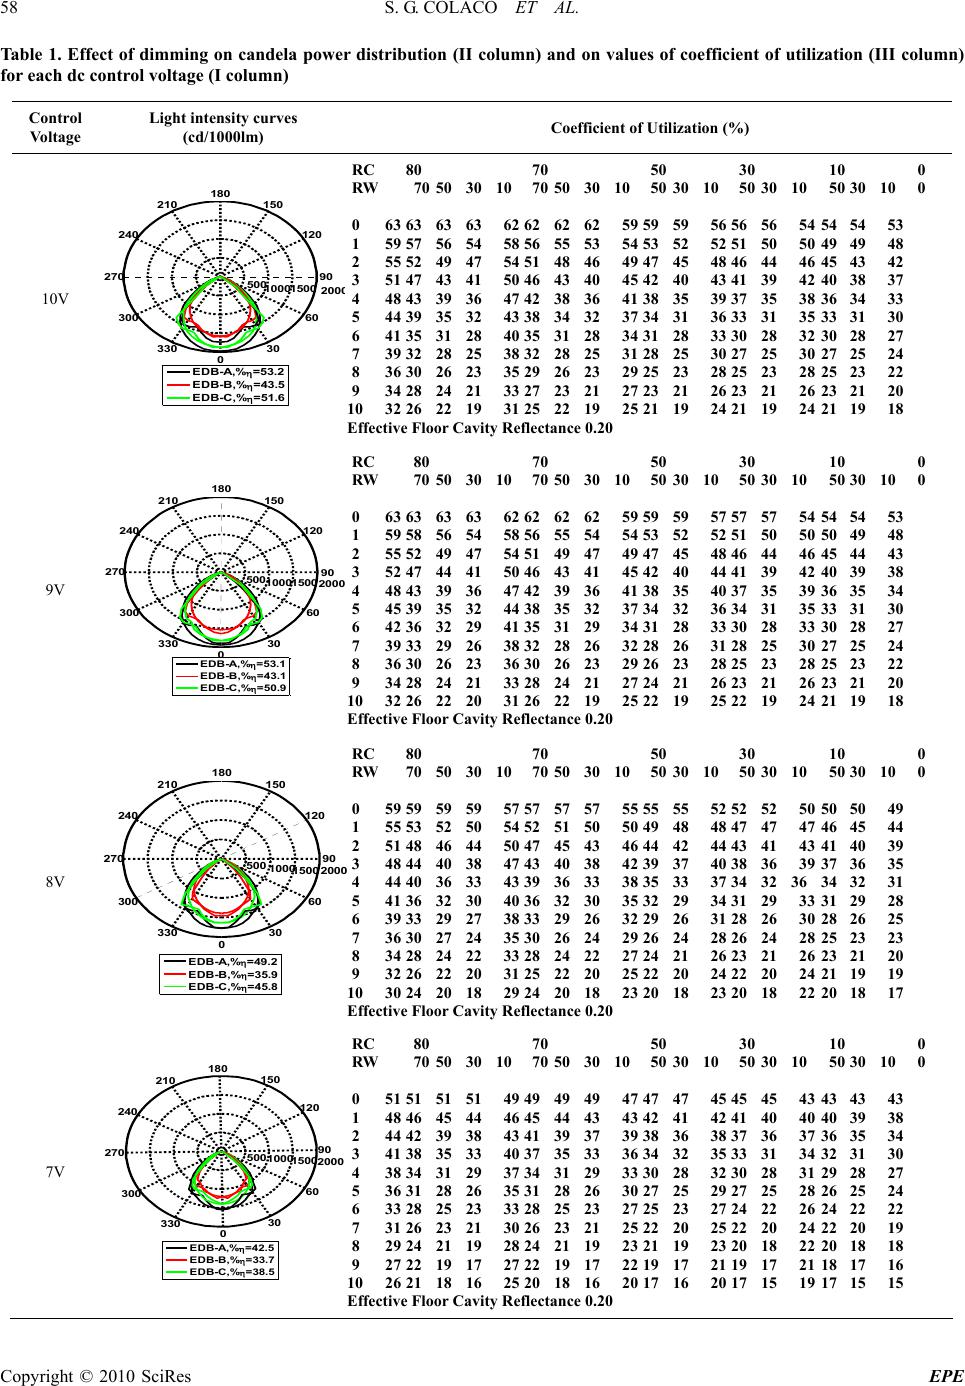 S. G. COLACO ET AL. Copyright © 2010 SciRes EPE 58 Table 1. Effect of dimming on candela power distribution (II column) and on values of coefficient of utilization (III column) for each dc control voltage (I column) Control Voltage Light intensity curves (cd/1000lm) Coefficient of Utilization (%) 10V 500 1000 1500 200 0 30 210 60 240 90270 120 300 150 330 180 0 EDB-A,% =53.2 EDB-B,% =43.5 EDB-C,% =51.6 RC 80 70 50 30 10 0 RW 70 50 30 10 70 50 30 10 50 30 10 50 30 10 50 30 10 0 0 63 63 63 63 62 62 62 62 59 59 59 56 56 56 54 54 54 53 1 59 57 56 54 58 56 55 53 54 53 52 52 51 50 50 49 49 48 2 55 52 49 47 54 51 48 46 49 47 45 48 46 44 46 45 43 42 3 51 47 43 41 50 46 43 40 45 42 40 43 41 39 42 40 38 37 4 48 43 39 36 47 42 38 36 41 38 35 39 37 35 38 36 34 33 5 44 39 35 32 43 38 34 32 37 34 31 36 33 31 35 33 31 30 6 41 35 31 28 40 35 31 28 34 31 28 33 30 28 32 30 28 27 7 39 32 28 25 38 32 28 25 31 28 25 30 27 25 30 27 25 24 8 36 30 26 23 35 29 26 23 29 25 23 28 25 23 28 25 23 22 9 34 28 24 21 33 27 23 21 27 23 21 26 23 21 26 23 21 20 10 32 26 22 19 31 25 22 19 25 21 19 24 21 19 24 21 19 18 Effective Floor Cavity Reflectance 0.20 9V 500 1000 1500 2000 30 210 60 240 90 270 120 300 150 330 180 0 EDB-A,%=53.1 EDB-B,%=43.1 EDB-C,%=50.9 RC 80 70 50 30 10 0 RW 70 50 30 10 70 50 30 10 50 30 10 50 30 10 50 30 10 0 0 63 63 63 63 62 62 62 62 59 59 59 57 57 57 54 54 54 53 1 59 58 56 54 58 56 55 54 54 53 52 52 51 50 50 50 49 48 2 55 52 49 47 54 51 49 47 49 47 45 48 46 44 46 45 44 43 3 52 47 44 41 50 46 43 41 45 42 40 44 41 39 42 40 39 38 4 48 43 39 36 47 42 39 36 41 38 35 40 37 35 39 36 35 34 5 45 39 35 32 44 38 35 32 37 34 32 36 34 31 35 33 31 30 6 42 36 32 29 41 35 31 29 34 31 28 33 30 28 33 30 28 27 7 39 33 29 26 38 32 28 26 32 28 26 31 28 25 30 27 25 24 8 36 30 26 23 36 30 26 23 29 26 23 28 25 23 28 25 23 22 9 34 28 24 21 33 28 24 21 27 24 21 26 23 21 26 23 21 20 10 32 26 22 20 31 26 22 19 25 22 19 25 22 19 24 21 19 18 Effective Floor Cavity Reflectance 0.20 8V 500 1000 1500 200 0 30 210 60 240 90270 120 300 150 330 180 0 EDB-A,% =49.2 EDB-B,% =35.9 EDB-C,% =45.8 RC 80 70 50 30 10 0 RW 70 50 30 10 70 50 30 10 50 30 10 50 30 10 50 30 10 0 0 59 59 59 59 57 57 57 57 55 55 55 52 52 52 50 50 50 49 1 55 53 52 50 54 52 51 50 50 49 48 48 47 47 47 46 45 44 2 51 48 46 44 50 47 45 43 46 44 42 44 43 41 43 41 40 39 3 48 44 40 38 47 43 40 38 42 39 37 40 38 36 39 37 36 35 4 44 40 36 33 43 39 36 33 38 35 33 37 34 32 36 34 32 31 5 41 36 32 30 40 36 32 30 35 32 29 34 31 29 33 31 29 28 6 39 33 29 27 38 33 29 26 32 29 26 31 28 26 30 28 26 25 7 36 30 27 24 35 30 26 24 29 26 24 28 26 24 28 25 23 23 8 34 28 24 22 33 28 24 22 27 24 21 26 23 21 26 23 21 20 9 32 26 22 20 31 25 22 20 25 22 20 24 22 20 24 21 19 19 10 30 24 20 18 29 24 20 18 23 20 18 23 20 18 22 20 18 17 Effective Floor Cavity Reflectance 0.20 7V 300 330 0 500 1000 1500 2000 30 210 60 240 90 270 120 150 180 EDB-A,% =42.5 EDB-B,% =33.7 EDB-C,% =38.5 RC 80 70 50 30 10 0 RW 70 50 30 10 70 50 30 10 50 30 10 50 30 10 50 30 10 0 0 51 51 51 51 49 49 49 49 47 47 47 45 45 45 43 43 43 43 1 48 46 45 44 46 45 44 43 43 42 41 42 41 40 40 40 39 38 2 44 42 39 38 43 41 39 37 39 38 36 38 37 36 37 36 35 34 3 41 38 35 33 40 37 35 33 36 34 32 35 33 31 34 32 31 30 4 38 34 31 29 37 34 31 29 33 30 28 32 30 28 31 29 28 27 5 36 31 28 26 35 31 28 26 30 27 25 29 27 25 28 26 25 24 6 33 28 25 23 33 28 25 23 27 25 23 27 24 22 26 24 22 22 7 31 26 23 21 30 26 23 21 25 22 20 25 22 20 24 22 20 19 8 29 24 21 19 28 24 21 19 23 21 19 23 20 18 22 20 18 18 9 27 22 19 17 27 22 19 17 22 19 17 21 19 17 21 18 17 16 10 26 21 18 16 25 20 18 16 20 17 16 20 17 15 19 17 15 15 Effective Floor Cavity Reflectance 0.20 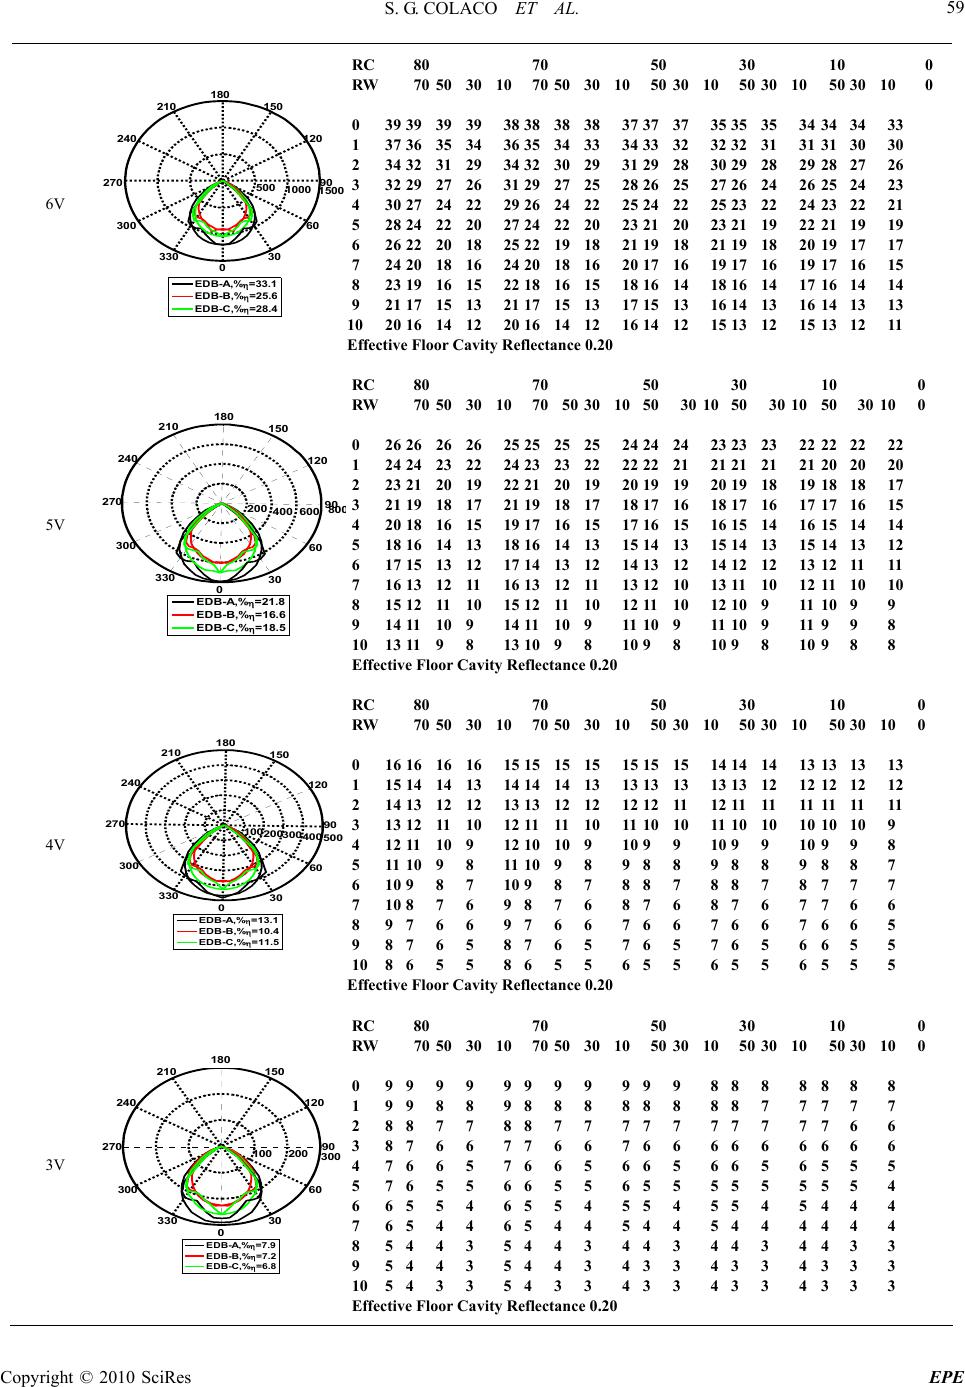 S. G. COLACO ET AL. Copyright © 2010 SciRes EPE 59 6V 500 1000 1500 30 210 60 240 90270 120 300 150 330 180 0 EDB-A,%=33.1 EDB-B,%=25.6 EDB-C,%=28.4 RC 80 70 50 30 10 0 RW 70 50 30 10 70 50 30 10 50 30 10 50 30 10 50 30 10 0 0 39 39 39 39 38 38 38 38 37 37 37 35 35 35 34 34 34 33 1 37 36 35 34 36 35 34 33 34 33 32 32 32 31 31 31 30 30 2 34 32 31 29 34 32 30 29 31 29 28 30 29 28 29 28 27 26 3 32 29 27 26 31 29 27 25 28 26 25 27 26 24 26 25 24 23 4 30 27 24 22 29 26 24 22 25 24 22 25 23 22 24 23 22 21 5 28 24 22 20 27 24 22 20 23 21 20 23 21 19 22 21 19 19 6 26 22 20 18 25 22 19 18 21 19 18 21 19 18 20 19 17 17 7 24 20 18 16 24 20 18 16 20 17 16 19 17 16 19 17 16 15 8 23 19 16 15 22 18 16 15 18 16 14 18 16 14 17 16 14 14 9 21 17 15 13 21 17 15 13 17 15 13 16 14 13 16 14 13 13 10 20 16 14 12 20 16 14 12 16 14 12 15 13 12 15 13 12 11 Effective Floor Cavity Reflectance 0.20 5V EDB-A,%=21.8 EDB-B,%=16.6 EDB-C,%=18.5 80 0 30 210 60 240 90 270 120 300 150 330 180 0 400 600 200 RC 80 70 50 30 10 0 RW 70 50 30 10 70 50 30 10 50 30 10 50 30 10 50 30 10 0 0 26 26 26 26 25 25 25 25 24 24 24 23 23 23 22 22 22 22 1 24 24 23 22 24 23 23 22 22 22 21 21 21 21 21 20 20 20 2 23 21 20 19 22 21 20 19 20 19 19 20 19 18 19 18 18 17 3 21 19 18 17 21 19 18 17 18 17 16 18 17 16 17 17 16 15 4 20 18 16 15 19 17 16 15 17 16 15 16 15 14 16 15 14 14 5 18 16 14 13 18 16 14 13 15 14 13 15 14 13 15 14 13 12 6 17 15 13 12 17 14 13 12 14 13 12 14 12 12 13 12 11 11 7 16 13 12 11 16 13 12 11 13 12 10 13 11 10 12 11 10 10 8 15 12 11 10 15 12 11 10 12 11 10 12 10 9 11 10 9 9 9 14 11 10 9 14 11 10 9 11 10 9 11 10 9 11 9 9 8 10 13 11 9 8 13 10 9 8 10 9 8 10 9 8 10 9 8 8 Effective Floor Cavity Reflectance 0.20 4V 330 100 200 300 400 500 30 210 60 240 90 270 120 300 150 180 0 EDB-A,% =13.1 EDB-B,% =10.4 EDB-C,% =11.5 RC 80 70 50 30 10 0 RW 70 50 30 10 70 50 30 10 50 30 10 50 30 10 50 30 10 0 0 16 16 16 16 15 15 15 15 15 15 15 14 14 14 13 13 13 13 1 15 14 14 13 14 14 14 13 13 13 13 13 13 12 12 12 12 12 2 14 13 12 12 13 13 12 12 12 12 11 12 11 11 11 11 11 11 3 13 12 11 10 12 11 11 10 11 10 10 11 10 10 10 10 10 9 4 12 11 10 9 12 10 10 9 10 9 9 10 9 9 10 9 9 8 5 11 10 9 8 11 10 9 8 9 8 8 9 8 8 9 8 8 7 6 10 9 8 7 10 9 8 7 8 8 7 8 8 7 8 7 7 7 7 10 8 7 6 9 8 7 6 8 7 6 8 7 6 7 7 6 6 8 9 7 6 6 9 7 6 6 7 6 6 7 6 6 7 6 6 5 9 8 7 6 5 8 7 6 5 7 6 5 7 6 5 6 6 5 5 10 8 6 5 5 8 6 5 5 6 5 5 6 5 5 6 5 5 5 Effective Floor Cavity Reflectance 0.20 3V 100 200 300 30 210 60 240 90 2 70 120 300 150 330 180 0 EDB-A,% =7.9 EDB-B,% =7.2 EDB-C,% =6.8 RC 80 70 50 30 10 0 RW 70 50 30 10 70 50 30 10 50 30 10 50 30 10 50 30 10 0 0 9 9 9 9 9 9 9 9 9 9 9 8 8 8 8 8 8 8 1 9 9 8 8 9 8 8 8 8 8 8 8 8 7 7 7 7 7 2 8 8 7 7 8 8 7 7 7 7 7 7 7 7 7 7 6 6 3 8 7 6 6 7 7 6 6 7 6 6 6 6 6 6 6 6 6 4 7 6 6 5 7 6 6 5 6 6 5 6 6 5 6 5 5 5 5 7 6 5 5 6 6 5 5 6 5 5 5 5 5 5 5 5 4 6 6 5 5 4 6 5 5 4 5 5 4 5 5 4 5 4 4 4 7 6 5 4 4 6 5 4 4 5 4 4 5 4 4 4 4 4 4 8 5 4 4 3 5 4 4 3 4 4 3 4 4 3 4 4 3 3 9 5 4 4 3 5 4 4 3 4 3 3 4 3 3 4 3 3 3 10 5 4 3 3 5 4 3 3 4 3 3 4 3 3 4 3 3 3 Effective Floor Cavity Reflectance 0.20  S. G. COLACO ET AL. Copyright © 2010 SciRes EPE 60 2V 90 120 50 100 150 30 210 60 240 270 300 150 330 180 0 EDB-A,% =3 EDB-B,% =2.4 EDB-C,% =2.4 RC 80 70 50 30 10 0 RW 70 50 30 10 70 50 30 10 50 30 10 50 30 10 50 30 10 0 0 4 4 4 4 3 3 3 3 3 3 3 3 3 3 3 3 3 3 1 3 3 3 3 3 3 3 3 3 3 3 3 3 3 3 3 3 3 2 3 3 3 3 3 3 3 3 3 3 3 3 3 2 3 3 2 2 3 3 3 2 2 3 3 2 2 3 2 2 2 2 2 2 2 2 2 4 3 2 2 2 3 2 2 2 2 2 2 2 2 2 2 2 2 2 5 2 2 2 2 2 2 2 2 2 2 2 2 2 2 2 2 2 2 6 2 2 2 2 2 2 2 2 2 2 2 2 2 2 2 2 2 1 7 2 2 2 1 2 2 2 1 2 2 1 2 2 1 2 2 1 1 8 2 2 1 1 2 2 1 1 2 1 1 2 1 1 2 1 1 1 9 2 2 1 1 2 2 1 1 1 1 1 1 1 1 1 1 1 1 10 2 1 1 1 2 1 1 1 1 1 1 1 1 1 1 1 1 1 Effective Floor Cavity Reflectance 0.20 1V 20 40 60 8 0 30 210 60 240 9 0 270 120 300 150 330 180 0 EDB-A,% =2 EDB-B,% =1.8 EDB-C,% =1.3 RC 80 70 50 30 10 0 RW 70 50 30 10 70 50 30 10 50 30 10 50 30 10 50 30 10 0 0 2 2 2 2 2 2 2 2 2 2 2 2 2 2 2 2 2 2 1 2 2 2 2 2 2 2 2 2 2 2 2 2 2 2 2 2 2 2 2 2 2 2 2 2 2 2 2 2 2 2 2 2 2 2 2 2 3 2 2 2 2 2 2 2 2 2 2 2 2 2 1 2 2 1 1 4 2 2 1 1 2 2 1 1 2 1 1 1 1 1 1 1 1 1 5 2 1 1 1 2 1 1 1 1 1 1 1 1 1 1 1 1 1 6 2 1 1 1 2 1 1 1 1 1 1 1 1 1 1 1 1 1 7 1 1 1 1 1 1 1 1 1 1 1 1 1 1 1 1 1 1 8 1 1 1 1 1 1 1 1 1 1 1 1 1 1 1 1 1 1 9 1 1 1 1 1 1 1 1 1 1 1 1 1 1 1 1 1 1 10 1 1 1 1 1 1 1 1 1 1 1 1 1 1 1 1 1 1 Effective Floor Cavity Reflectance 0.20 10V 9V 8V 7V 6V 5V 4V 3V 2V 1V 0.32 0.330.34 0.35 0.36 0.32 0.33 0.34 0.35 0.36 x y 0.33 0.340.35 0.36 0.37 0.33 0.34 0.35 0.36 0.37 x y 0.33 0.34 0.35 0.360.37 0.33 0.34 0.35 0.36 0.37 x y Figure 4. Chromaticity diagrams and Mac Adam ellipses for a)EDB-A b) EDB-B and c) EDB-C lamps dimming down drops from a maximum of 53.2%, 43.5% and 51.6% to a minimum of 2%, 18%, 1.8% for EDB-A, EDB-B, EDB-C respectively due to decrease in the bal- last control voltage. Taking the representative case of EDB-A luminaire, tabulated percentage CU values gen- erated by AGI-32 Photometric toolbox is shown in third column of Table 1 against each ballast control voltage. The row labeled RC is the effective ceiling reflectance, the row labeled RW is the wall reflectance and the first column is the Room Cavity Ratio. For the ind icated ceili- ng, wall and room cavity ratios, the tabulation shows the percentage of utilized lu mens on the work plane. Clearly, percentage CU value of the luminaire depreciates with the reduction in th e control voltage. 4.2.1 Chromaticity and CCT Chromaticity values are customarily used for character- izing the color appearance of a light source. A metric commonly used for quantifying perceivable color differ- ence is the MacAdam ellipse, which is a contour in the chromaticity diagram [25]. The ANSI specifies a 4-step MacAdam ellipse as the acceptable chromaticity toler- ance area for certain types of fluorescent lamps [26]. Almost all color-normal subjects will perceive a color difference in source if the chromaticity coordinates of experimental light source in the course of dimming; falls beyond chromaticity tolerance area. Using the chroma- ticity coordinates of maximum output as the centre of the ellipse, 4 steps MacAdam ellipse plo tted for the reported ballasts are shown in Figure 4 (a) through (c). As can be 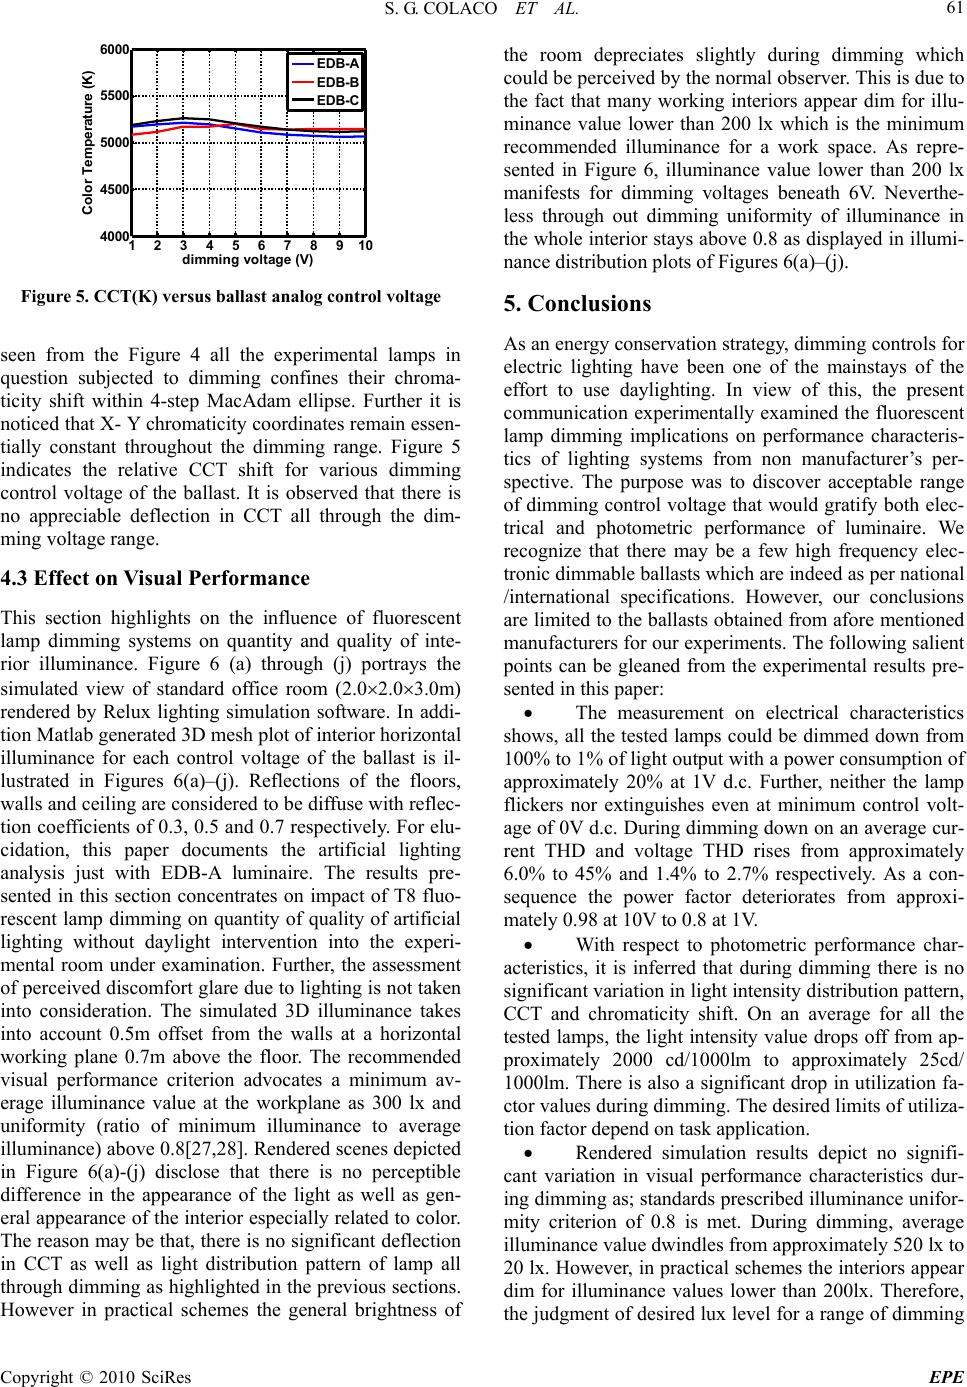 S. G. COLACO ET AL. Copyright © 2010 SciRes EPE 61 1 2 3 4 56 7 8 910 4000 4500 5000 5500 6000 dimming voltage (V) Col or Temp erat u re ( K) EDB-A EDB-B EDB-C Figure 5. CCT(K) versus ballast analog control voltage seen from the Figure 4 all the experimental lamps in question subjected to dimming confines their chroma- ticity shift within 4-step MacAdam ellipse. Further it is noticed that X- Y chromaticity coordinates remain essen- tially constant throughout the dimming range. Figure 5 indicates the relative CCT shift for various dimming control voltage of the ballast. It is observed that there is no appreciable deflection in CCT all through the dim- ming voltage range. 4.3 Effect on Visual Performance This section highlights on the influence of fluorescent lamp dimming systems on quantity and quality of inte- rior illuminance. Figure 6 (a) through (j) portrays the simulated view of standard office room (2.02.03.0m) rendered by Relux lighting simulation software. In addi- tion Matlab generated 3D mesh plot of interior horizontal illuminance for each control voltage of the ballast is il- lustrated in Figures 6(a)–(j). Reflections of the floors, walls and ceiling are considered to be diffuse with reflec- tion coefficients of 0.3, 0.5 and 0.7 respectively. For elu- cidation, this paper documents the artificial lighting analysis just with EDB-A luminaire. The results pre- sented in this section concentrates on impact of T8 fluo- rescent lamp dimming on quantity of quality of artificial lighting without daylight intervention into the experi- mental room under examination. Further, the assessment of perceived discomfort glare due to lighting is not taken into consideration. The simulated 3D illuminance takes into account 0.5m offset from the walls at a horizontal working plane 0.7m above the floor. The recommended visual performance criterion advocates a minimum av- erage illuminance value at the workplane as 300 lx and uniformity (ratio of minimum illuminance to average illuminance) above 0.8[27 ,28]. Rendered scen es depicted in Figure 6(a)-(j) disclose that there is no perceptible difference in the appearance of the light as well as gen- eral appearance of the interior especially related to color. The reason may be that, there is no significant deflection in CCT as well as light distribution pattern of lamp all through dimming as highlighted in the previous sections. However in practical schemes the general brightness of the room depreciates slightly during dimming which could be perceived by the normal observer. This is due to the fact that many working interiors appear dim for illu- minance value lower than 200 lx which is the minimum recommended illuminance for a work space. As repre- sented in Figure 6, illuminance value lower than 200 lx manifests for dimming voltages beneath 6V. Neverthe- less through out dimming uniformity of illuminance in the whole interior stays abo ve 0.8 as displayed in illumi- nance distribution plots of Figures 6(a)–(j). 5. Conclusions As an energy conservation strategy, dimming controls for electric lighting have been one of the mainstays of the effort to use daylighting. In view of this, the present communication experimentally examined the fluorescent lamp dimming implications on performance characteris- tics of lighting systems from non manufacturer’s per- spective. The purpose was to discover acceptable range of dimming control voltage that would gratify both elec- trical and photometric performance of luminaire. We recognize that there may be a few high frequency elec- tronic dimmable ballasts which are indeed as per national /international specifications. However, our conclusions are limited to the ballasts obtained from afore mentioned manufacturers for our experiments. The following salient points can be gleaned from the experimental results pre- sented in this paper: The measurement on electrical characteristics shows, all the tested lamps could be dimmed down from 100% to 1% of light output with a power consumption of approximately 20% at 1V d.c. Further, neither the lamp flickers nor extinguishes even at minimum control volt- age of 0V d. c. During d imming d own on an a verage cur- rent THD and voltage THD rises from approximately 6.0% to 45% and 1.4% to 2.7% respectively. As a con- sequence the power factor deteriorates from approxi- mately 0.98 at 10V to 0.8 at 1V. With respect to photometric performance char- acteristics, it is inferred that during dimming there is no significant variation in light intensity distribution pattern, CCT and chromaticity shift. On an average for all the tested lamps, the light intensity value drops off from ap- proximately 2000 cd/1000lm to approximately 25cd/ 1000lm. There is also a significant drop in utilization fa- ctor values during dimming . Th e desired limits of u tiliza- tion factor depend on task application. Rendered simulation results depict no signifi- cant variation in visual performance characteristics dur- ing dimming as; stan dards prescribed illu minance unifor- mity criterion of 0.8 is met. During dimming, average illuminance value dwindles from approximately 520 lx to 20 lx. However, in practical schemes the interiors appear dim for illuminance values lower than 200lx. Therefore, the judgment of desired lux level for a range of dimming 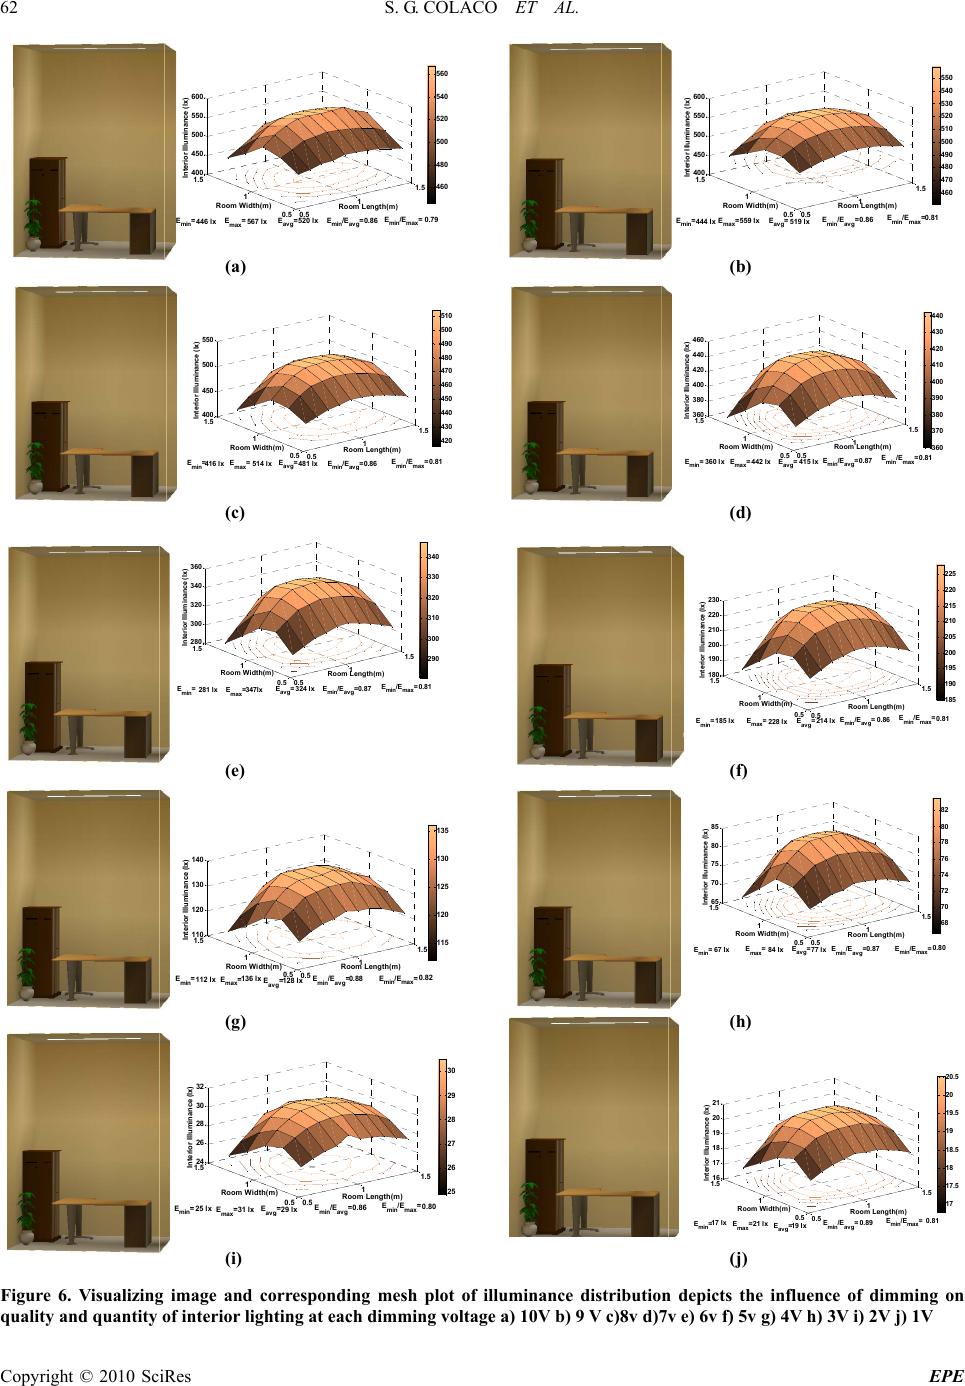 S. G. COLACO ET AL. Copyright © 2010 SciRes EPE 62 0.5 1 1.5 0.5 1 1.5 400 450 500 550 600 0.79 E min /E max = 0.86 Room Length(m) E min /E avg = 520 lx E avg = Room Width(m) 567 lx E max = 446 lx Interior Illuminance (lx) E min = 460 480 500 520 540 560 0.5 1 1.5 0.5 1 1.5 400 450 500 550 600 0.81 E min /E max = 0.86 Room Leng t h(m) E min /E avg = 519 lx Room Width(m) E avg = 559 lx E max = 444 lx Interior Illuminance (lx) E min = 460 470 480 490 500 510 520 530 540 550 0.5 1 1.5 0.5 1 1.5 400 450 500 550 0.81 E min /E max = 0.86 Room Length(m) E min /E av g = 481 lx Room Width(m) E av g = 514 lx E max = 416 lx Interior Illuminance (lx) E min = 420 430 440 450 460 470 480 490 500 510 0.5 1 1.5 0.5 1 1.5 360 380 400 420 440 460 0.81 E min /E max = 0.87 Room Length(m) E min /E avg = 415 lxE avg = Room Width(m) 442 lxE max = 360 lx Interior Illuminance (lx) E min = 360 370 380 390 400 410 420 430 440 0.5 1 1.5 0.5 1 1.5 180 190 200 210 220 230 0.81 E min /E max = 0.86 Room Length(m) E min /E avg = 214 lxE avg = Room Width(m) 228 lx E max = 185 lx Interior Illuminance (lx) E min = 185 190 195 200 205 210 215 220 225 0.5 1 1.5 0.5 1 1.5 280 300 320 340 360 0.81 E min /E max = 0.87 Room Length(m) E min /E avg = 324 lxE avg = Room Width(m) 347l xE max = 281 lx Interior Illuminance (lx) E min = 290 300 310 320 330 340 0.5 1 1.5 0.5 1 1.5 110 120 130 140 0.82 E min /E max = 0.88 Room Length(m) E min /E avg = 128 lx Room Width(m) E av g = 136 lx E max = 112 lx Interior Illuminance (lx) E min = 115 120 125 130 135 0.5 1 1.5 0.5 1 1.5 65 70 75 80 85 0.80 E min /E max = 0.87 Room Length(m) E min /E av g = 77 lx E avg = Room Width(m) 84 lx E max = 67 lx Interior Illuminance (lx) E min = 68 70 72 74 76 78 80 82 0.5 1 1.5 0.5 1 1.5 24 26 28 30 32 0.80 E min /E max = 0.86 Room Length(m) E min /E avg = 29 lx Room Width(m) E av g = 31 lx E m a x = 25 lx Interior Illuminance (lx) E min = 25 26 27 28 29 30 0.5 1 1.5 0.5 1 1.5 16 17 18 19 20 21 0.81 E min /E max = 0.89 Room Length(m) E min /E avg = 19 lx Room Width(m) E av g = 21 lxE max = 17 lx Interior Illuminance (lx) E min = 17 17.5 18 18.5 19 19.5 20 20.5 (a) (c) (e) (g) (i) (b) (d) (f) (h) (j) Figure 6. Visualizing image and corresponding mesh plot of illuminance distribution depicts the influence of dimming on quality and quantity of interior lighting at each dimming voltage a) 10V b) 9 V c)8v d)7v e) 6v f) 5v g) 4V h) 3V i) 2V j) 1V  S. G. COLACO ET AL. Copyright © 2010 SciRes EPE 63 control voltage requires particular attention based on task application. In summary it is concluded from our experimental analysis that in order to achieve superior electrical, photometric as well as visual performance from a lumi- naire; the optimum control voltage range of ballast dim- ming should preferably lie between 10V to 3V d.c. The laboratory result of this paper demonstrate that fluores- cent lamp dimming schemes are not an obstacle for wider use of energy efficient daylight artificial light in- tegrated schemes. 6. Acknowledgements The present research is funded by Department of Science & Technology under WOS-A scheme, Government of India. The authors gratefully acknowledge this contribu- tion. Any opinions, findings and conclusions or recom- mendations expressed in this material are of the authors. REFERENCES [1] S. G. Colaco, C. P. Kurian, V. I. George, and A. M. Co- laco, “Prospective techniques of effective daylight har- vesting in commercial buildings by employing window glazing, dynamic shading devices and dimming control-A literature review,” Building Simulation, Vol. 1, No. 4. P. 279–289, 2008. [2] C. P. Kurian, R. S. Aithal, J. Bhat, and V. I. George, “Ro- bust control and optimization of energy consumption in daylight-Artificial light integrated schemes,” Lighting Research and Technology, Vol. 40, No. 4, pp. 7–24, 2008. [3] M. S. Rea, “Lighting handbook: Reference and applica- tion,” Illuminating Engineering Society of North America (IESNA), 9th Edition, New York, 2000. [4] C. D. Louie, “Linear fluorescent dimming ballasts: Technology, methods,” Protocols Lighting Controls As- sociation, 2004, http://www.aboutlightingcontrols.org/education/papers/di mming.shtml) [5] E. Tetri and V. Gligor, “Dimming according to daylight- effect on lamp life,” Right Light 5, Proceedings of the 5th European Conference on Energy-Efficient Lighting. Nice, France, pp. 421–424, 2002. [6] Y. Akashi and J. Neches, “Detectability and acceptability of. illuminance reduction for load shedding,” Journal of Illuminating Engineering Society, Vol. 33, No. 1, pp. 3– 13, 2004. [7] M. Etezadi-Amoli and T. Florence, “Power factor and harmonic distortion characteristics of energy efficient lamps,” IEEE Transactions on Power De livery lamps, Vol. 4, No. 3, pp. 1965–1969, 1989. [8] J. Yunfen, D. Robert, C. O'Rourke, E. Wai Mun Chui, “Compatibility testing of fluorescent lamp and ballast systems,” IEEE Transactions on Industry Applications Vol. 35, No. 6, pp. 1271–1276, 1999. [9] “Dimming Electronic Ballasts,” National Lighting Prod- uct Information Program Specifier Reports, Troy, Light- ing Research Center, NY, Rensselaer Polytechnic Institute, Vol. 7, No. 3, October 1999. [10] R. Benoit, A. Deneyer, P. D’Herdt, and S. M. Diga, “Per- formance evaluation of dimmable lighting sources with fluorescent tubes for indoor applications,” Proceedings of International Lighting Symposium, Modern Quality Solu- tions for an Efficient Lighting, Sinaia, Romania, October 12–14, 2006 [11] L. Doulos, A. Tsangrassoulis, and F. Topalis, “Quantify- ing energy savings in daylight responsive systems: The role of dimming electronic ballasts,” Energy and Build- ings, Vol. 40, No. 1, pp. 36–50, 2008. [12] Commission internationale de l'éclairage, “The measure- ment of absolute luminous intensity distributions,” CIE Technical Report, No. 70, 1987. [13] Commission internationale de l'éclairage, “The photome- try and goniophotometery of luminaires,” CIE Technical Report, No. 121, 1996. [14] Illuminating Engineering Society of North America (1999), IESNA guide to lamp seasoning, IES committee on testing procedures IES LM-54- 9,. New York. [15] Illuminating Engineering Society of North America, “IESNA approved method for electrical and photometric measurements of fluorescent lamps,” IES comitee on test- ing procedures IES LM-9-99, New York, 1999. [16] Matlab R2009a version 7.5 user manual, http://www.mathworks.com. [17] A. Choi, K. Song, and Y. Kim, “The characteristics of photosensors and electronic dimming ballasts in daylight responsive dimming systems,” Building and Environment, Vol. 40, pp. 39–50, 2005 [18] F. V. Topalis, “Efficiency of energy saving lamps and harmonic distortion in distribution systems,” IEEE Transactions on Power Delivery, Vol. 8, No. 4, pp. 2038– 2042, 1993. [19] T. Jednacz, “Power quality design implications of high fre- quency lighting ballasts and controls,” Industry Applications Society Annual Meeting, Vol. 2, pp. 1833–1835, 1991. [20] R. Wolsey, “Lighting answers: power quality,” Lighting Research Center, Rensselaer Polytechnic Institute, Vol. 2, No. 2, 1995, http://www.sdeg.org/docs/LAPQ.pdf. [21] Harmonic Emission Limits—Related Power Quality Re- quirements for Lighting, American National Standards Institute (ANSI), C82.77, New York, 1993. [22] IEEE recommended practice and requirements for har- monic control in electrical power systems, IEEE standard pp. 519, 1992 [23] Limits for harmonic current emission equipment input current 16A per phase (2004) International Electrotech- nical Commission (IEC) Edition 2.2 [24] C. P. Kurian, R. S. Aithal, and S. G. Colaco, “Perform- ance evaluation of lamp-luminaire combination: A soft- ware approach using MATLAB,” Journal of Institution of  S. G. COLACO ET AL. Copyright © 2010 SciRes EPE 64 Engineers, Vol. 85, pp. 98–101, 2004. [25] G. Wyszecki and W. S. Stiles, Color Science, Wiley, New York, 1982. [26] “American national standard for electric lamps: Specifi- cations for the chromaticity of fluorescent lamps,” American National Standards Institute (ANSI) C78.376, National Electrical Manufacturers Association, Rosslyn, VA, 2001. [27] Code Bureau of Indian Standards, Code of practice for interior illumination: Part 1 General requirements and recommendations for working interiors IS 3646, Part 1, Section 0, 1992, Reaffirmed 2003 [28] R. Yarham, Code for Interior Lighting Chartered Institu- tion of Building Services Engineers (CIBSE), London, 1994. Nomenclatures: Luminaire efficiency cos Cosine of the phase angle between input volt- age and current. 1 I Fundamental current (A) n I Current at harmonic order number n pf Power factor given by cos THD Total Harmonic Distortion CCT Correlated Color Temperature (K) CU Coefficient of Utilization Emin Minimum Illuminance (lx) Emax Maximum Illuminance (lx) Eavg Average Illuminance (lx) |