Paper Menu >>
Journal Menu >>
 Energy and Power Engineering, 2010, 46-52 doi:10.4236/epe.2010.21008 Published Online February 2010 (http://www.scirp.org/journal/epe) Copyright © 2010 SciRes EPE Valuing Health Effects of Natural Radionuclides Releases from Yatağan Power Plant Tayfun BÜKE1, Aylin Çiğdem KÖNE2 1Department of Physics, Muğla University, Muğla, Turkey 2Department of Economics, Muğla University, Muğla, Turkey Email: tbuke@mu.edu.tr Abstract: The objective of this paper is the valuation of radiological health effects of Yatağan Power Plant. To this aim the radiation dose calculations are carried out for the population living within 80 km radius of the plant. The average of the maximum measured specific isotopes 238U, 232Th and 226Ra in the flying ash samples are considered as radioactive sources. Based on the dose calculations, first the stochastic health effects and then monetary health effects are estimated. The estimated total collective dose and economic value of the pre- dicted health effects are 0.3098 man Sv/y and 14791 US$/y respectively. The results obtained from the dose calculations are lower than the limits of International Commission of Radiation Protection (ICRP) and it does not pose any risk for public health. Monetary value of health risks is also negligible in comparison to the av- erage yearly sales revenue of the plant which is 250 million US$. Keywords: coal-fired power plants, collective dose, atmospheric dispersion, valuing health effects 1. Introduction Yatağan Power Plant (YPP) is one of the largest lignite- fired power plants in Turkey with a total capacity of 630 MW. It has been operated in Muğla province at the west- ern Anatolia since 1982 [1]. Lignite in Muğla province contains some uranium as all lignite does. That uranium passes to ash with a higher concentration during the fir- ing process in furnace chamber at 1000 oC. While well- urned ash goes to the plant chimney, the others are not burned perfectly, which are called slag ashen drops the furnace chamber floor [2,3]. The radioactive flying ash is released to the atmosphere, depending on the efficiency of the plant’s chimney emission control equipment. The major potential pathway, which might result in increased radiation doses to people are inhalation of flying ash, ingestion of food grown in contaminated soil or direct radiation exposure from the increased deposited radioac- tivity when flying ash are released from the plant chim- ney [4,5]. In this study, the radiation dose calculations have been carried out using the code CAP88-PC which stands for Clean Air Act Assessment Package [6] for the population living within 80 km radius of the YPP by using the aver- age of the maximum measured specific isotopes 238U, 232Th and 226Ra in the flying ash samples as radioactive sources. Based on the dose calculations, the stochastic health effects have been estimated by using the risk fac- tors, as recommended by the International Commission of Radiation Protection (ICRP) [7]. Then the predicted health effects have been monetized by using the methodology given in NucPacts model [8]. In order to estimate the average dispersion of radionu- clides released from a point source, a modified plume dispersion model has been used in the calculations. Pas- quill categories A-F with site-specific averaged mete- orological conditions are used in the modified dispersion model. The meteorological data on atmospheric stability conditions like mean wind speed and the frequency dis- tribution of wind direction are obtained from Turkish State Meteorological Service [9]. The population distri- bution around the YPP is taken from Turkish State Insti- tute of Statistics [10]. Annual radioactivity release rate for three different ra- dionuclides in the dose calculations is calculated by us- ing the ash emission rate from the plant chimney, the measured activity in flying ash and the plant loading factor [11,12]. The rest of the study is organized as follows. Section 2 introduces the source terms for 238U, 232Th and 226Ra. Section 3 deals with the assessment of radiation hazard. In Section 4 risk calculations are given in detail. Section 5 presents a monetary valuation of health effects. Finally, Section 6 gathers the main conclusions derived from this paper. 2. Source Terms In this study, the literature related to the maximum measured specific isotopes 238U, 232Th and 226Ra in the flying ashes of the YPP are reviewed. In those studies, the concentrations of 238U, 232Th and 226Ra have been 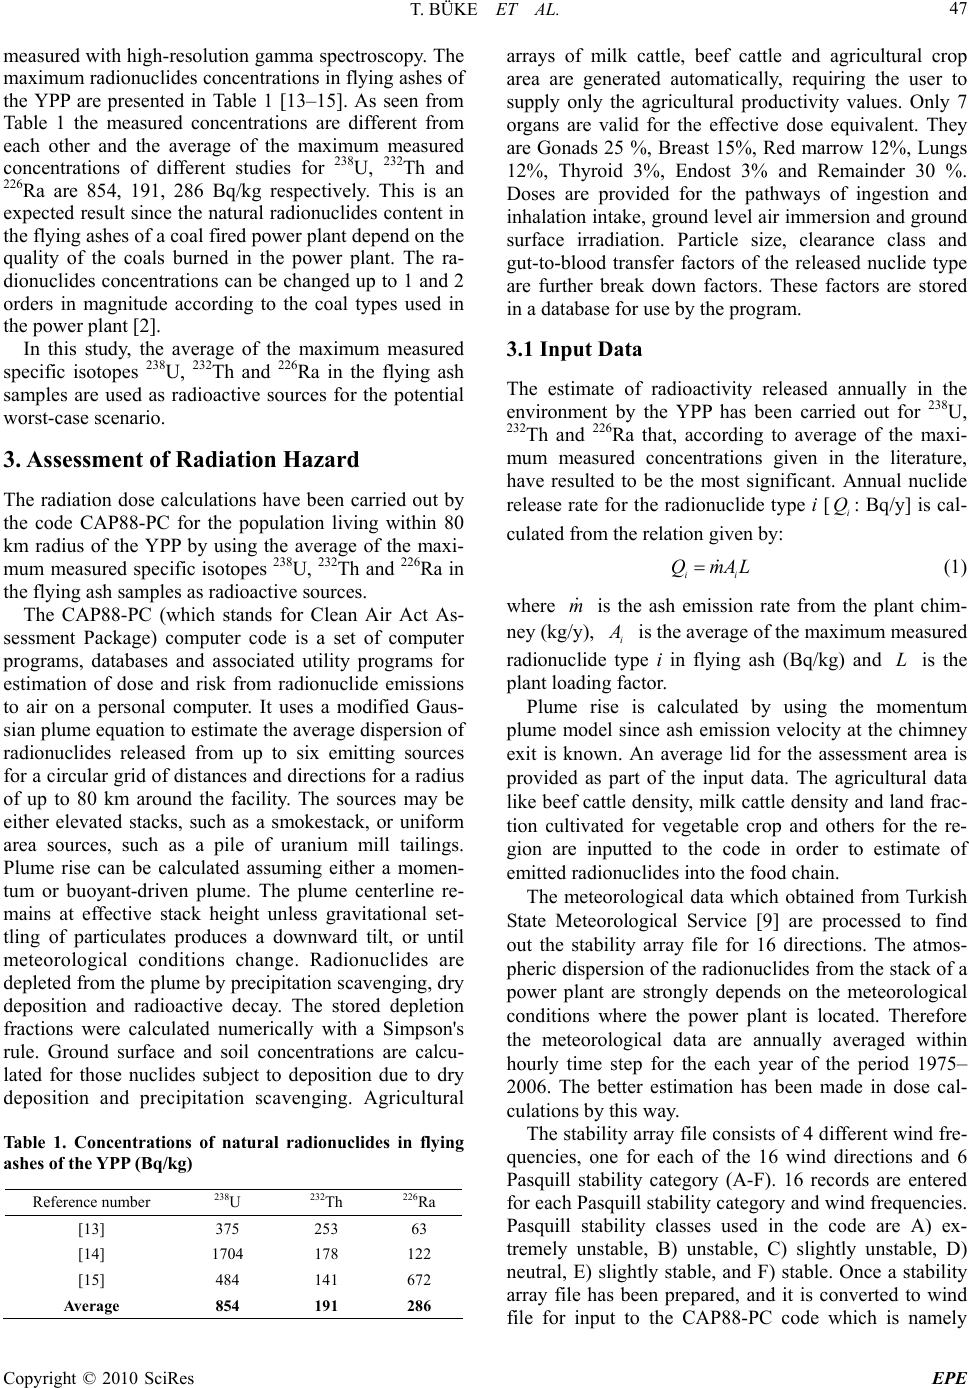 T. BÜKE ET AL. Copyright © 2010 SciRes EPE 47 measured with high-resolution gamma spectroscopy. The maximum radionuclides concentrations in flying ashes of the YPP are presented in Table 1 [13–15]. As seen from Table 1 the measured concentrations are different from each other and the average of the maximum measured concentrations of different studies for 238U, 232Th and 226Ra are 854, 191, 286 Bq/kg respectively. This is an expected result since the natural radionuclides content in the flying ashes of a coal fired power plant depend on the quality of the coals burned in the power plant. The ra- dionuclides concentrations can be changed up to 1 and 2 orders in magnitude according to the coal types used in the power plant [2]. In this study, the average of the maximum measured specific isotopes 238U, 232Th and 226Ra in the flying ash samples are used as radioactive sources for the potential worst-case scenario. 3. Assessment of Radiation Hazard The radiation dose calculations have been carried out by the code CAP88-PC for the population living within 80 km radius of the YPP by using the average of the maxi- mum measured specific isotopes 238U, 232Th and 226Ra in the flying ash samples as radioactive sources. The CAP88-PC (which stands for Clean Air Act As- sessment Package) computer code is a set of computer programs, databases and associated utility programs for estimation of dose and risk from radionuclide emissions to air on a personal computer. It uses a modified Gaus- sian plume equation to estimate the average dispersion of radionuclides released from up to six emitting sources for a circular grid of distances and directions for a radius of up to 80 km around the facility. The sources may be either elevated stacks, such as a smokestack, or uniform area sources, such as a pile of uranium mill tailings. Plume rise can be calculated assuming either a momen- tum or buoyant-driven plume. The plume centerline re- mains at effective stack height unless gravitational set- tling of particulates produces a downward tilt, or until meteorological conditions change. Radionuclides are depleted from the plume by precipitation scavenging, dry deposition and radioactive decay. The stored depletion fractions were calculated numerically with a Simpson's rule. Ground surface and soil concentrations are calcu- lated for those nuclides subject to deposition due to dry deposition and precipitation scavenging. Agricultural Table 1. Concentrations of natural radionuclides in flying ashes of the YPP (Bq/kg) Reference number 238U 232Th 226Ra [13] 375 253 63 [14] 1704 178 122 [15] 484 141 672 Average 854 191 286 arrays of milk cattle, beef cattle and agricultural crop area are generated automatically, requiring the user to supply only the agricultural productivity values. Only 7 organs are valid for the effective dose equivalent. They are Gonads 25 %, Breast 15%, Red marrow 12%, Lungs 12%, Thyroid 3%, Endost 3% and Remainder 30 %. Doses are provided for the pathways of ingestion and inhalation intake, ground level air immersion and ground surface irradiation. Particle size, clearance class and gut-to-blood transfer factors of the released nuclide type are further break down factors. These factors are stored in a database for use by the program. 3.1 Input Data The estimate of radioactivity released annually in the environment by the YPP has been carried out for 238U, 232Th and 226Ra that, according to average of the maxi- mum measured concentrations given in the literature, have resulted to be the most significant. Annual nuclide release rate for the radionuclide type i [i Q: Bq/y] is cal- culated from the relation given by: LAmQ ii (1) where m is the ash emission rate from the plant chim- ney (kg/y), i A is the average of the maximum measured radionuclide type i in flying ash (Bq/kg) and L is the plant loading factor. Plume rise is calculated by using the momentum plume model since ash emission velocity at the chimney exit is known. An average lid for the assessment area is provided as part of the input data. The agricultural data like beef cattle density, milk cattle density and land frac- tion cultivated for vegetable crop and others for the re- gion are inputted to the code in order to estimate of emitted radionuclides into the food chain. The meteorological data which obtained from Turkish State Meteorological Service [9] are processed to find out the stability array file for 16 directions. The atmos- pheric dispersion of the radionuclides from the stack of a power plant are strongly depends on the meteorological conditions where the power plant is located. Therefore the meteorological data are annually averaged within hourly time step for the each year of the period 1975– 2006. The better estimation has been made in dose cal- culations by this way. The stability array file consists of 4 different wind fre- quencies, one for each of the 16 wind directions and 6 Pasquill stability category (A-F). 16 records are entered for each Pasquill stability category and wind frequencies. Pasquill stability classes used in the code are A) ex- tremely unstable, B) unstable, C) slightly unstable, D) neutral, E) slightly stable, and F) stable. Once a stability array file has been prepared, and it is converted to wind file for input to the CAP88-PC code which is namely 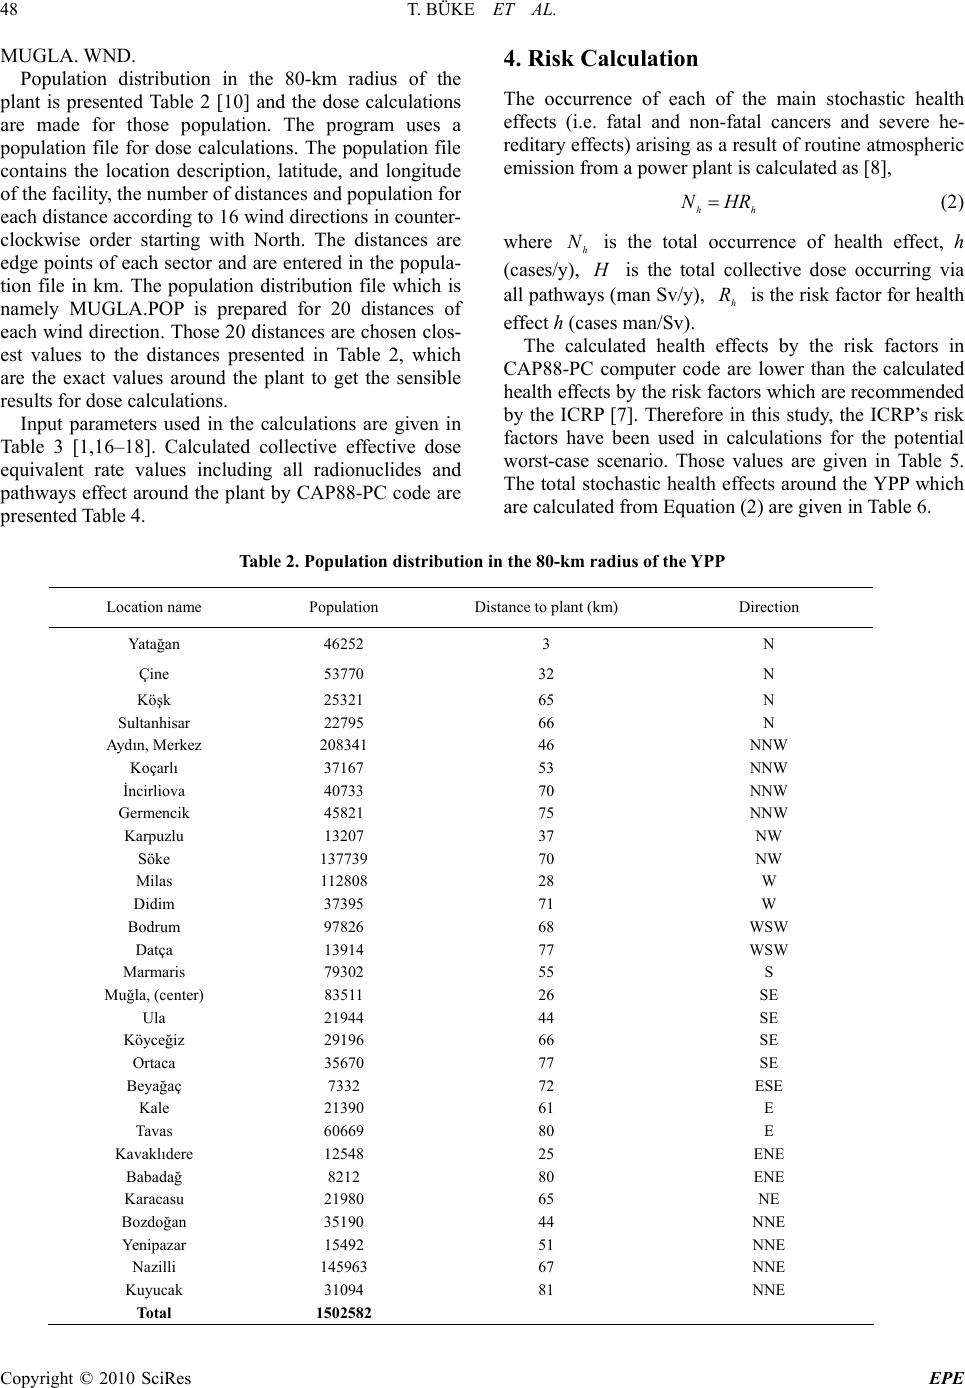 T. BÜKE ET AL. Copyright © 2010 SciRes EPE 48 MUGLA. WND. Population distribution in the 80-km radius of the plant is presented Table 2 [10] and the dose calculations are made for those population. The program uses a population file for dose calculations. The population file contains the location description, latitude, and longitude of the facility, the number of distances and population for each distance according to 16 wind directions in counter- clockwise order starting with North. The distances are edge points of each sector and are entered in the popula- tion file in km. The population distribution file which is namely MUGLA.POP is prepared for 20 distances of each wind direction. Those 20 distances are chosen clos- est values to the distances presented in Table 2, which are the exact values around the plant to get the sensible results for dose calculations. Input parameters used in the calculations are given in Table 3 [1,16–18]. Calculated collective effective dose equivalent rate values including all radionuclides and pathways effect around the plant by CAP88-PC code are presented Table 4. 4. Risk Calculation The occurrence of each of the main stochastic health effects (i.e. fatal and non-fatal cancers and severe he- reditary effects) arising as a result of routine atmospheric emission from a power plant is calculated as [8], hh HRN (2) where h N is the total occurrence of health effect, h (cases/y), H is the total collective dose occurring via all pathways (man Sv/y), h R is the risk factor for health effect h (cases man/Sv). The calculated health effects by the risk factors in CAP88-PC computer code are lower than the calculated health effects by the risk factors which are recommended by the ICRP [7]. Therefore in this study, the ICRP’s risk factors have been used in calculations for the potential worst-case scenario. Those values are given in Table 5. The total stochastic health effects around the YPP which are calculated from Equation (2) are given in Table 6. Table 2. Population distribution in the 80-km radius of the YPP Location name Population Distance to plant (km) Direction Yatağan 46252 3 N Çine 53770 32 N Köşk 25321 65 N Sultanhisar 22795 66 N Aydın, Merkez 208341 46 NNW Koçarlı 37167 53 NNW İncirliova 40733 70 NNW Germencik 45821 75 NNW Karpuzlu 13207 37 NW Söke 137739 70 NW Milas 112808 28 W Didim 37395 71 W Bodrum 97826 68 WSW Datça 13914 77 WSW Marmaris 79302 55 S Muğla, (center) 83511 26 SE Ula 21944 44 SE Köyceğiz 29196 66 SE Ortaca 35670 77 SE Beyağaç 7332 72 ESE Kale 21390 61 E Tavas 60669 80 E Kavaklıdere 12548 25 ENE Babadağ 8212 80 ENE Karacasu 21980 65 NE Bozdoğan 35190 44 NNE Yenipazar 15492 51 NNE Nazilli 145963 67 NNE Kuyucak 31094 81 NNE Total 1502582 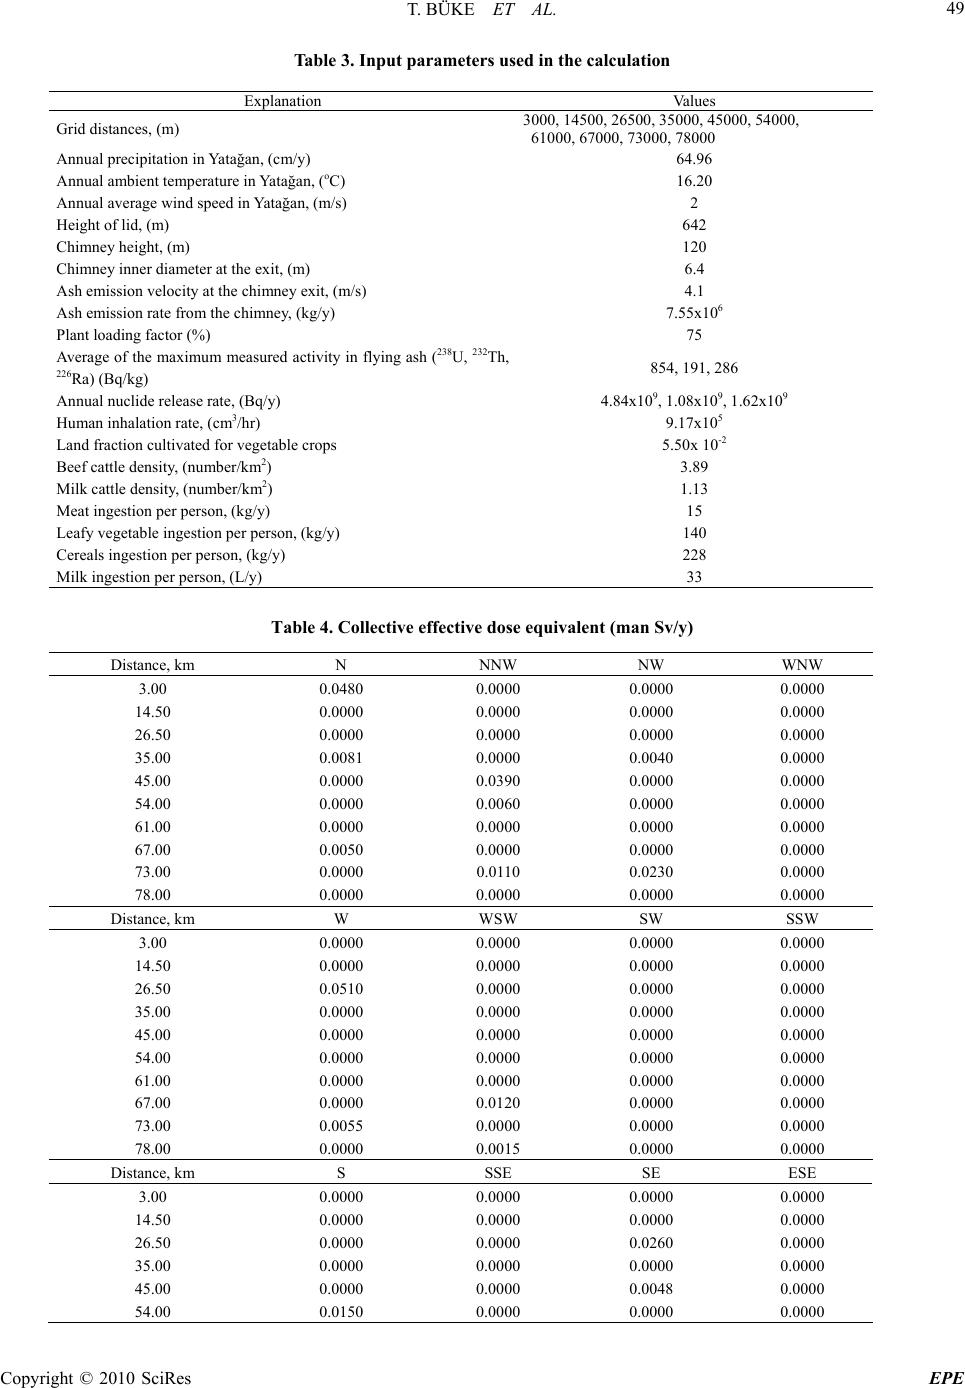 T. BÜKE ET AL. Copyright © 2010 SciRes EPE 49 Table 3. Input parameters used in the calculation Explanation Values Grid distances, (m) 3000, 14500, 26500, 35000, 45000, 54000, 61000, 67000, 73000, 78000 Annual precipitation in Yatağan, (cm/y) 64.96 Annual ambient temperature in Yatağan, (oC) 16.20 Annual average wind speed in Yatağan, (m/s) 2 Height of lid, (m) 642 Chimney height, (m) 120 Chimney inner diameter at the exit, (m) 6.4 Ash emission velocity at the chimney exit, (m/s) 4.1 Ash emission rate from the chimney, (kg/y) 7.55x10⁶ Plant loading factor (%) 75 Average of the maximum measured activity in flying ash (238U, 232Th, 226Ra) (Bq/kg) 854, 191, 286 Annual nuclide release rate, (Bq/y) 4.84x10⁹, 1.08x10⁹, 1.62x10⁹ Human inhalation rate, (cm3/hr) 9.17x10⁵ Land fraction cultivated for vegetable crops 5.50x 10⁻² Beef cattle density, (number/km2) 3.89 Milk cattle density, (number/km2) 1.13 Meat ingestion per person, (kg/y) 15 Leafy vegetable ingestion per person, (kg/y) 140 Cereals ingestion per person, (kg/y) 228 Milk ingestion per person, (L/y) 33 Table 4. Collective effective dose equivalent (man Sv/y) Distance, km N NNW NW WNW 3.00 0.0480 0.0000 0.0000 0.0000 14.50 0.0000 0.0000 0.0000 0.0000 26.50 0.0000 0.0000 0.0000 0.0000 35.00 0.0081 0.0000 0.0040 0.0000 45.00 0.0000 0.0390 0.0000 0.0000 54.00 0.0000 0.0060 0.0000 0.0000 61.00 0.0000 0.0000 0.0000 0.0000 67.00 0.0050 0.0000 0.0000 0.0000 73.00 0.0000 0.0110 0.0230 0.0000 78.00 0.0000 0.0000 0.0000 0.0000 Distance, km W WSW SW SSW 3.00 0.0000 0.0000 0.0000 0.0000 14.50 0.0000 0.0000 0.0000 0.0000 26.50 0.0510 0.0000 0.0000 0.0000 35.00 0.0000 0.0000 0.0000 0.0000 45.00 0.0000 0.0000 0.0000 0.0000 54.00 0.0000 0.0000 0.0000 0.0000 61.00 0.0000 0.0000 0.0000 0.0000 67.00 0.0000 0.0120 0.0000 0.0000 73.00 0.0055 0.0000 0.0000 0.0000 78.00 0.0000 0.0015 0.0000 0.0000 Distance, km S SSE SE ESE 3.00 0.0000 0.0000 0.0000 0.0000 14.50 0.0000 0.0000 0.0000 0.0000 26.50 0.0000 0.0000 0.0260 0.0000 35.00 0.0000 0.0000 0.0000 0.0000 45.00 0.0000 0.0000 0.0048 0.0000 54.00 0.0150 0.0000 0.0000 0.0000 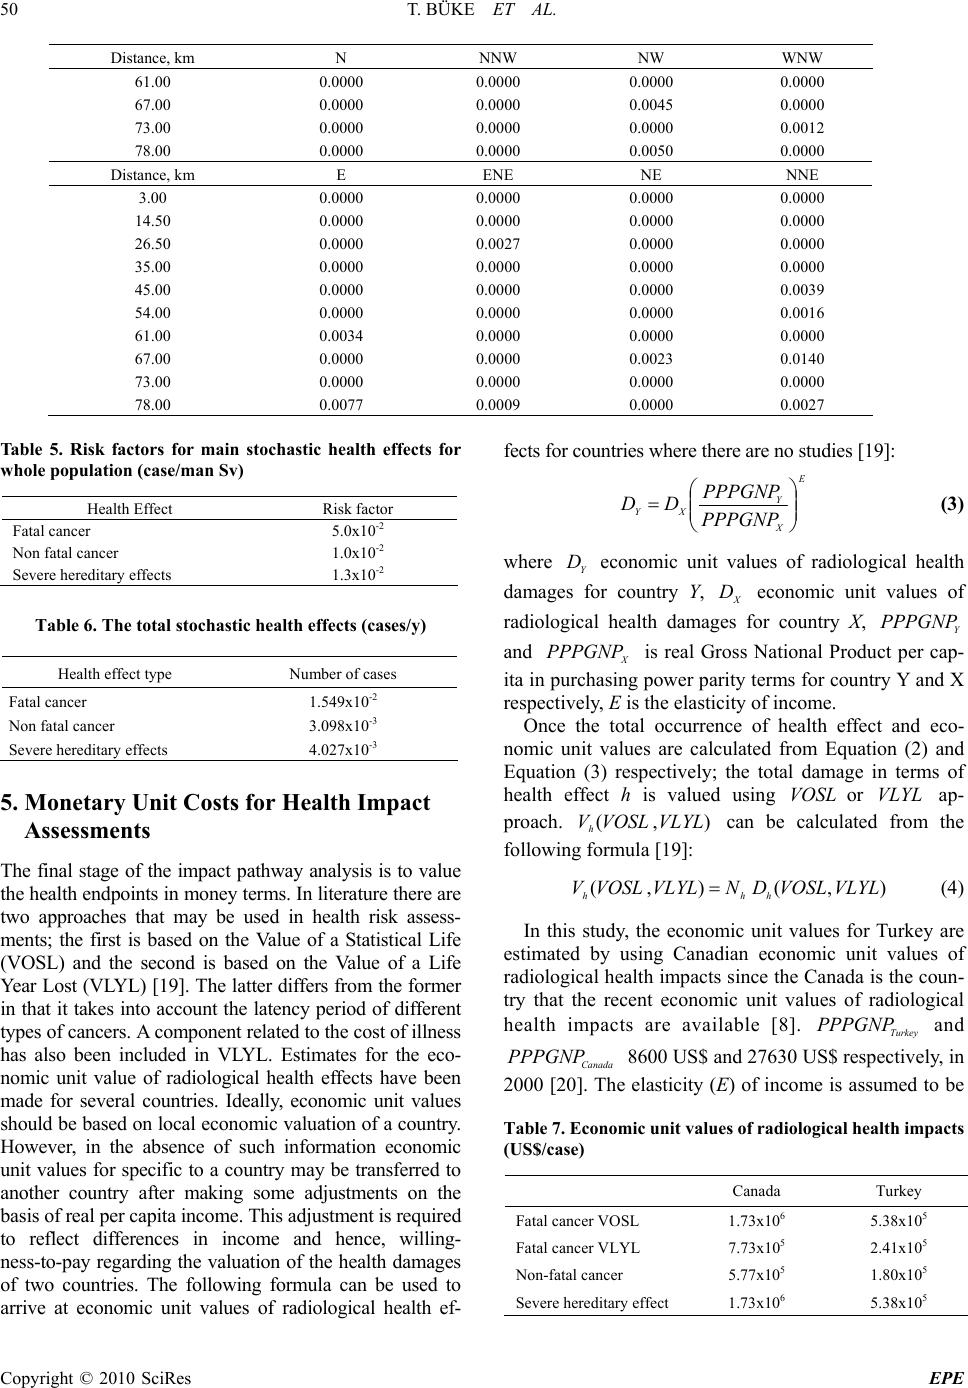 T. BÜKE ET AL. Copyright © 2010 SciRes EPE 50 Distance, km N NNW NW WNW 61.00 0.0000 0.0000 0.0000 0.0000 67.00 0.0000 0.0000 0.0045 0.0000 73.00 0.0000 0.0000 0.0000 0.0012 78.00 0.0000 0.0000 0.0050 0.0000 Distance, km E ENE NE NNE 3.00 0.0000 0.0000 0.0000 0.0000 14.50 0.0000 0.0000 0.0000 0.0000 26.50 0.0000 0.0027 0.0000 0.0000 35.00 0.0000 0.0000 0.0000 0.0000 45.00 0.0000 0.0000 0.0000 0.0039 54.00 0.0000 0.0000 0.0000 0.0016 61.00 0.0034 0.0000 0.0000 0.0000 67.00 0.0000 0.0000 0.0023 0.0140 73.00 0.0000 0.0000 0.0000 0.0000 78.00 0.0077 0.0009 0.0000 0.0027 Table 5. Risk factors for main stochastic health effects for whole population (case/man Sv) Health Effect Risk factor Fatal cancer 5.0x10⁻² Non fatal cancer 1.0x10⁻² Severe hereditary effects 1.3x10⁻² Table 6. The total stochastic health effects (cases/y) Health effect type Number of cases Fatal cancer 1.549x10⁻² Non fatal cancer 3.098x10⁻³ Severe hereditary effects 4.027x10⁻³ 5. Monetary Unit Costs for Health Impact Assessments The final stage of the impact pathway analysis is to value the health endpoints in money terms. In literature there are two approaches that may be used in health risk assess- ments; the first is based on the Value of a Statistical Life (VOSL) and the second is based on the Value of a Life Year Lost (VLYL) [19]. The latter differs from the former in that it takes into account the latency period of different types of cancers. A component related to the cost of illness has also been included in VLYL. Estimates for the eco- nomic unit value of radiological health effects have been made for several countries. Ideally, economic unit values should be based on local economic valuation of a country. However, in the absence of such information economic unit values for specific to a country may be transferred to another country after making some adjustments on the basis of real per capita income. This adjustment is required to reflect differences in income and hence, willing- ness-to-pay regarding the valuation of the health damages of two countries. The following formula can be used to arrive at economic unit values of radiological health ef- fects for countries where there are no studies [19]: E X Y XY PPPGNP PPPGNP DD (3) where Y D economic unit values of radiological health damages for country Y, X D economic unit values of radiological health damages for country X, Y PPPGNP and X PPPGNP is real Gross National Product per cap- ita in purchasing power parity terms for country Y and X respectively, E is the elasticity of income. Once the total occurrence of health effect and eco- nomic unit values are calculated from Equation (2) and Equation (3) respectively; the total damage in terms of health effect h is valued using VOSL or VLYL ap- proach. ), (VLYLVOSLVh can be calculated from the following formula [19]: ) ,( ), (VLYLVOSLDNVLYLVOSLV hhh (4) In this study, the economic unit values for Turkey are estimated by using Canadian economic unit values of radiological health impacts since the Canada is the coun- try that the recent economic unit values of radiological health impacts are available [8]. Turkey PPPGNP and Canada PPPGNP 8600 US$ and 27630 US$ respectively, in 2000 [20]. The elasticity (E) of income is assumed to be Table 7. Economic unit values of radiological health impacts (US$/case) Canada Turkey Fatal cancer VOSL 1.73x10⁶ 5.38x10⁵ Fatal cancer VLYL 7.73x10⁵ 2.41x10⁵ Non-fatal cancer 5.77x10⁵ 1.80x10⁵ Severe hereditary effect1.73x106 5.38x10⁵ 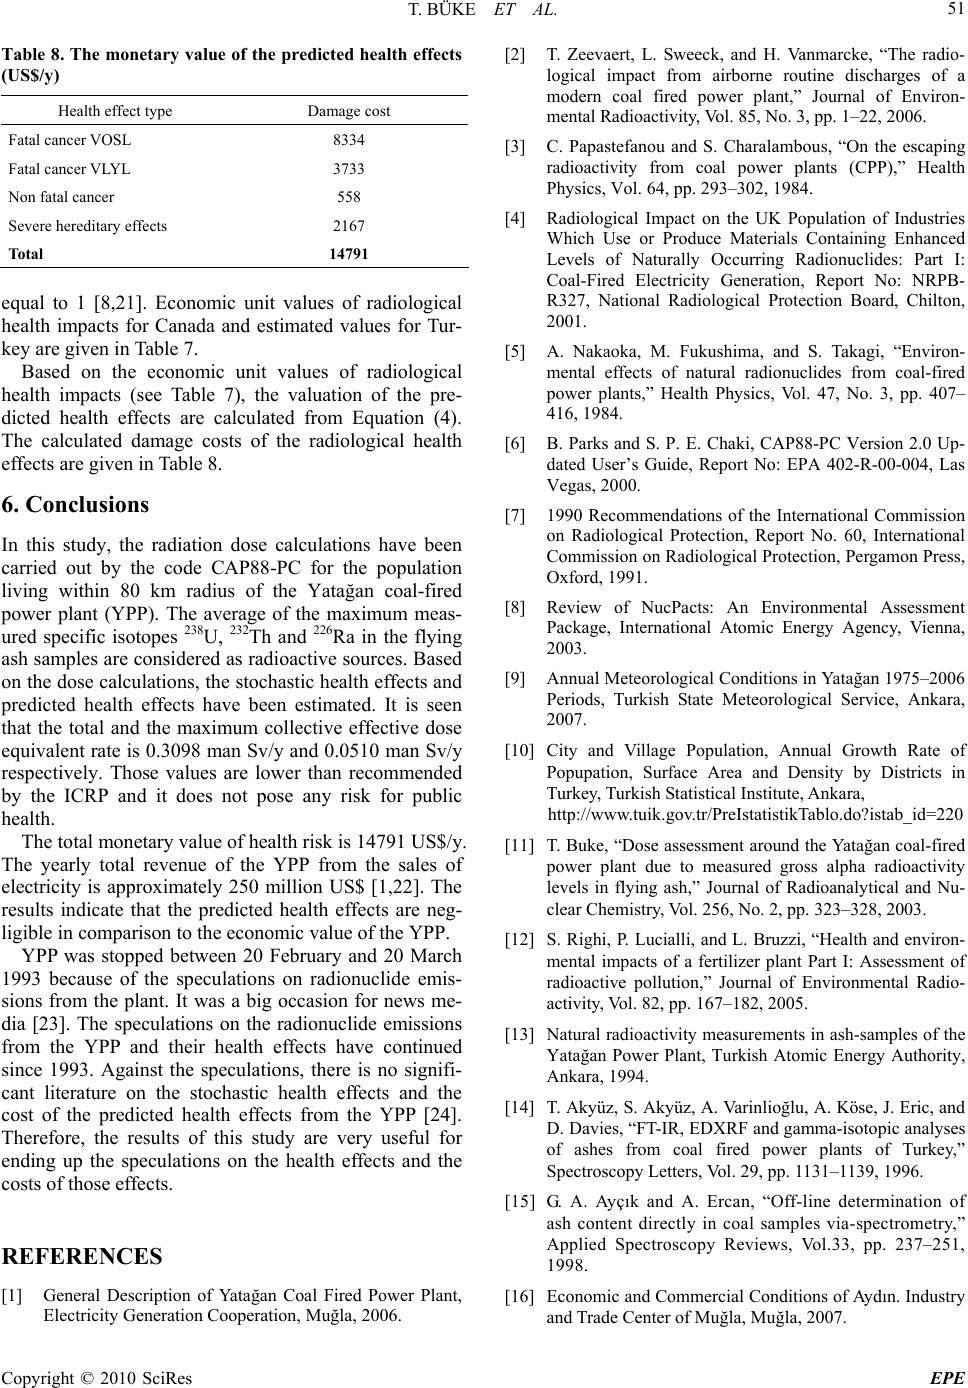 T. BÜKE ET AL. Copyright © 2010 SciRes EPE 51 Table 8. The monetary value of the predicted health effects (US$/y) Health effect type Damage cost Fatal cancer VOSL 8334 Fatal cancer VLYL 3733 Non fatal cancer 558 Severe hereditary effects 2167 Total 14791 equal to 1 [8,21]. Economic unit values of radiological health impacts for Canada and estimated values for Tur- key are given in Table 7. Based on the economic unit values of radiological health impacts (see Table 7), the valuation of the pre- dicted health effects are calculated from Equation (4). The calculated damage costs of the radiological health effects are given in Table 8. 6. Conclusions In this study, the radiation dose calculations have been carried out by the code CAP88-PC for the population living within 80 km radius of the Yatağan coal-fired power plant (YPP). The average of the maximum meas- ured specific isotopes 238U, 232Th and 226Ra in the flying ash samples are considered as radioactive sources. Based on the dose calculations, the stochastic health effects and predicted health effects have been estimated. It is seen that the total and the maximum collective effective dose equivalent rate is 0.3098 man Sv/y and 0.0510 man Sv/y respectively. Those values are lower than recommended by the ICRP and it does not pose any risk for public health. The total monetary value of health risk is 14791 US$/y. The yearly total revenue of the YPP from the sales of electricity is approximately 250 million US$ [1,22]. The results indicate that the predicted health effects are neg- ligible in comparison to the economic value of the YPP. YPP was stopped between 20 February and 20 March 1993 because of the speculations on radionuclide emis- sions from the plant. It was a big occasion for news me- dia [23]. The speculations on the radionuclide emissions from the YPP and their health effects have continued since 1993. Against the speculations, there is no signifi- cant literature on the stochastic health effects and the cost of the predicted health effects from the YPP [24]. Therefore, the results of this study are very useful for ending up the speculations on the health effects and the costs of those effects. REFERENCES [1] General Description of Yatağan Coal Fired Power Plant, Electricity Generation Cooperation, Muğla, 2006. [2] T. Zeevaert, L. Sweeck, and H. Vanmarcke, “The radio- logical impact from airborne routine discharges of a modern coal fired power plant,” Journal of Environ- mental Radioactivity, Vol. 85, No. 3, pp. 1–22, 2006. [3] C. Papastefanou and S. Charalambous, “On the escaping radioactivity from coal power plants (CPP),” Health Physics, Vol. 64, pp. 293–302, 1984. [4] Radiological Impact on the UK Population of Industries Which Use or Produce Materials Containing Enhanced Levels of Naturally Occurring Radionuclides: Part I: Coal-Fired Electricity Generation, Report No: NRPB- R327, National Radiological Protection Board, Chilton, 2001. [5] A. Nakaoka, M. Fukushima, and S. Takagi, “Environ- mental effects of natural radionuclides from coal-fired power plants,” Health Physics, Vol. 47, No. 3, pp. 407– 416, 1984. [6] B. Parks and S. P. E. Chaki, CAP88-PC Version 2.0 Up- dated User’s Guide, Report No: EPA 402-R-00-004, Las Vegas, 2000. [7] 1990 Recommendations of the International Commission on Radiological Protection, Report No. 60, International Commission on Radiological Protection, Pergamon Press, Oxford, 1991. [8] Review of NucPacts: An Environmental Assessment Package, International Atomic Energy Agency, Vienna, 2003. [9] Annual Meteorological Conditions in Yatağan 1975–2006 Periods, Turkish State Meteorological Service, Ankara, 2007. [10] City and Village Population, Annual Growth Rate of Popupation, Surface Area and Density by Districts in Turkey, Turkish Statistical Institute, Ankara, http://www.tuik.gov.tr/PreIstatistikTablo.do?istab_id=220 [11] T. Buke, “Dose assessment around the Yatağan coal-fired power plant due to measured gross alpha radioactivity levels in flying ash,” Journal of Radioanalytical and Nu- clear Chemistry, Vol. 256, No. 2, pp. 323–328, 2003. [12] S. Righi, P. Lucialli, and L. Bruzzi, “Health and environ- mental impacts of a fertilizer plant Part I: Assessment of radioactive pollution,” Journal of Environmental Radio- activity, Vol. 82, pp. 167–182, 2005. [13] Natural radioactivity measurements in ash-samples of the Yatağan Power Plant, Turkish Atomic Energy Authority, Ankara, 1994. [14] T. Akyüz, S. Akyüz, A. Varinlioğlu, A. Köse, J. Eric, and D. Davies, “FT-IR, EDXRF and gamma-isotopic analyses of ashes from coal fired power plants of Turkey,” Spectroscopy Letters, Vol. 29, pp. 1131–1139, 1996. [15] G. A. Ayçık and A. Ercan, “Off-line determination of ash content directly in coal samples via-spectrometry,” Applied Spectroscopy Reviews, Vol.33, pp. 237–251, 1998. [16] Economic and Commercial Conditions of Aydın. Industry and Trade Center of Muğla, Muğla, 2007.  T. BÜKE ET AL. Copyright © 2010 SciRes EPE 52 [17] Economic and Commercial Conditions of Muğla, Indus- try and Trade Center of Muğla, Muğla, 2007. [18] N Selçuk, A. Atımtay, O. Uslu, Ş. Cirik, H. Vurdu, G. Tuncel, Z. Kaya, M. Evirgen, and C. Yurteri, Scientific Committee Report for Kemerkoy Thermal Power Plant, Ankara, 1995. [19] A. Markandya and R. Boyd, “Valuing the human health effects of routine atmospheric releases from nuclear facili- ties,” International Atomic Energy Agency, Vienna, 1999. [20] World Development Indicators (WDI), http://ddp-xt.worldbank.org. [21] E. Liun, A. H. Kuncoro, and E. Sartono, “Environmental impacts assessment of Java’s electricity generation using SimPacts model,” International Conference on Advances in Nuclear Science and Engineering in Conjunction with LKSTN, pp. 379–384, 2007. [22] Electricity selling prices of Turkey for the year 2000, Directorate General of Turkish Electricity Distribution, 2000. [23] M. Aslan, “A typical example of the discussion about the environmental impacts of coal fired thermal power plants in Turkey: Yatağan thermal power plant experience,” Symposium on Environmental effects of Electricity Pro- duction from Coal, Ankara, 1995. [24] T. Oğuz “Personal communications,” Associate Mayor of Yatağan, 2008. |