Paper Menu >>
Journal Menu >>
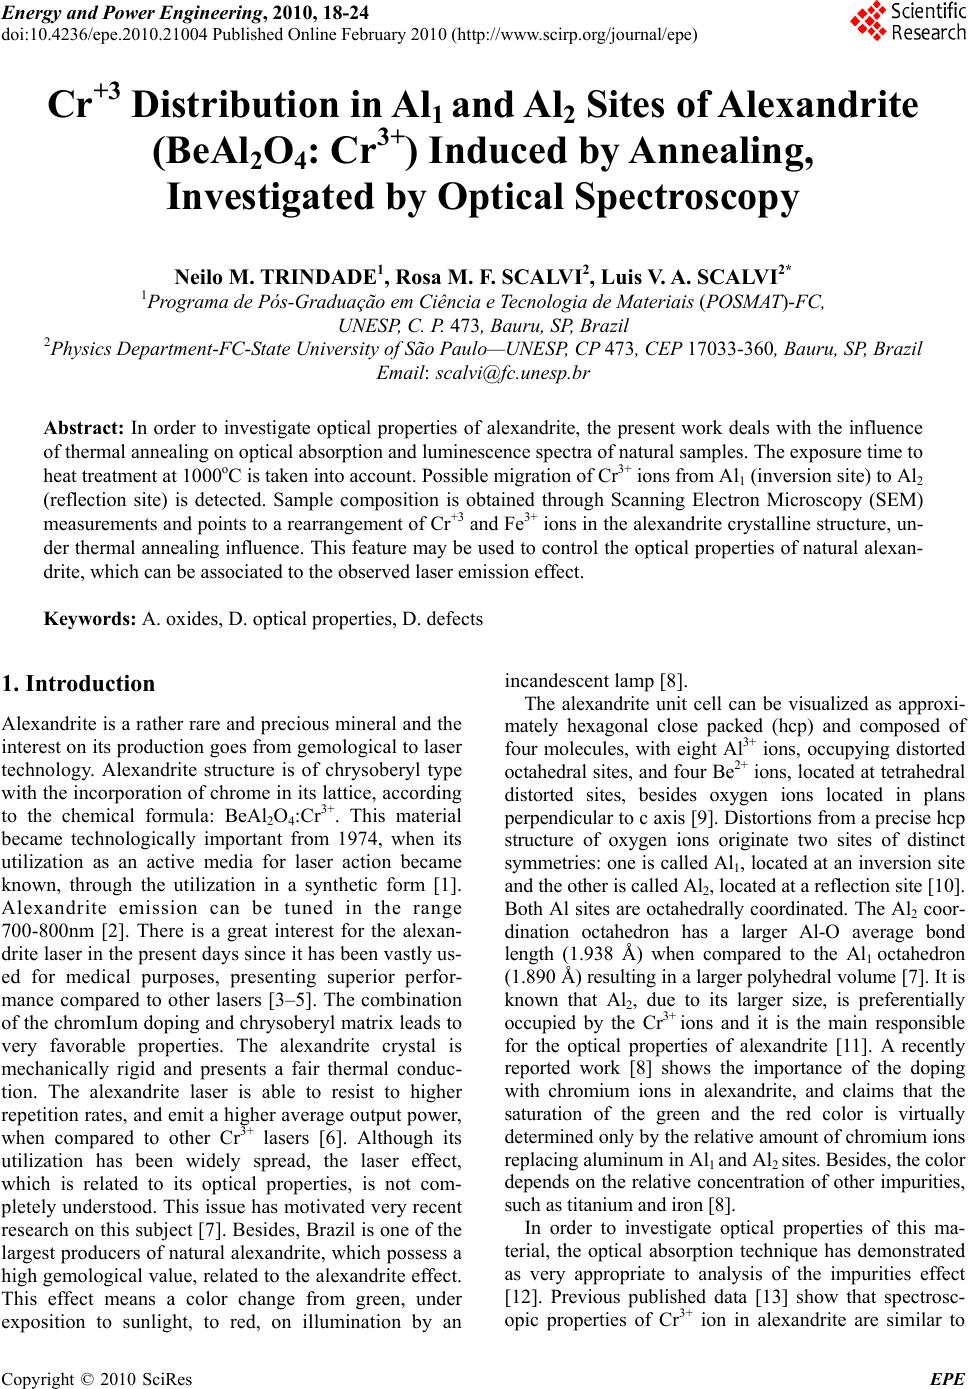 Energy and Power Engineering, 2010, 18-24 doi:10.4236/epe.2010.21004 Published Online February 2010 (http://www.scirp.org/journal/epe) Copyright © 2010 SciRes EPE Cr+3 Distribution in Al1 and Al2 Sites of Alexandrite (BeAl2O4: Cr3+) Induced by Annealing, Investigated by Optical Spectroscopy Neilo M. TRINDADE1, Rosa M. F. SCALVI2, Luis V. A. SCALVI2* 1Programa de Pós-Gra du ação em Ciência e Tecnologia de Mat eri ai s (POSMAT)-FC, UNESP, C. P. 473, Bauru, SP, Bra zil 2Physics Department-FC-State University of São Paulo—UNESP, CP 473, CEP 17033-360, Bauru, SP, Brazil Email: scalvi@fc.unesp.br Abstract: In order to investigate optical properties of alexandrite, the present work deals with the influence of thermal annealing on optical absorption and luminescence spectra of natural samples. The exposure time to heat treatment at 1000oC is taken into account. Possible migration of Cr3+ ions from Al1 (inversion site) to Al2 (reflection site) is detected. Sample composition is obtained through Scanning Electron Microscopy (SEM) measurements and points to a rearrangement of Cr+3 and Fe3+ ions in the alexandrite crystalline structure, un- der thermal annealing influence. This feature may be used to control the optical properties of natural alexan- drite, which can be associated to the observed laser emission effect. Keywords: A. oxides, D. optical properties, D. defects 1. Introduction Alexandrite is a rather rare and precious mineral and the interest on its production goes from gemological to laser technology. Alexandrite structure is of chrysoberyl type with the incorporation of chrome in its lattice, according to the chemical formula: BeAl2O4:Cr3+. This material became technologically important from 1974, when its utilization as an active media for laser action became known, through the utilization in a synthetic form [1]. Alexandrite emission can be tuned in the range 700-800nm [2]. There is a great interest for the alexan- drite laser in the present days since it has been vastly us- ed for medical purposes, presenting superior perfor- mance compared to other lasers [3–5]. The combination of the chromIum doping and chrysoberyl matrix leads to very favorable properties. The alexandrite crystal is mechanically rigid and presents a fair thermal conduc- tion. The alexandrite laser is able to resist to higher repetition rates, and emit a higher average output power, when compared to other Cr3+ lasers [6]. Although its utilization has been widely spread, the laser effect, which is related to its optical properties, is not com- pletely understood. This issue has motivated very recent research on this subject [7]. Besides, Brazil is one of the largest producers of natural alexandrite, which possess a high gemological value, related to the alexandrite effect. This effect means a color change from green, under exposition to sunlight, to red, on illumination by an incandescent lamp [8]. The alexandrite unit cell can be visualized as approxi- mately hexagonal close packed (hcp) and composed of four molecules, with eight Al3+ ions, occupying distorted octahedral sites, and four Be2+ ions, located at tetrahedral distorted sites, besides oxygen ions located in plans perpendicular to c axis [9]. Distortions from a precise hcp structure of oxygen ions originate two sites of distinct symmetries: one is called Al1, located at an inversion site and the other is called Al2, located at a reflection site [10]. Both Al sites are octahedrally coordinated. The Al2 coor- dination octahedron has a larger Al-O average bond length (1.938 Å) when compared to the Al1 octahedron (1.890 Å) resulting in a larger polyhedral volume [7]. It is known that Al2, due to its larger size, is preferentially occupied by the Cr3+ ions and it is the main responsible for the optical properties of alexandrite [11]. A recently reported work [8] shows the importance of the doping with chromium ions in alexandrite, and claims that the saturation of the green and the red color is virtually determined only by the relative amount of chromium ions replacing aluminum in Al1 and Al2 sites. Besides, the color depends on the relative concentration of other impurities, such as titanium and iron [8]. In order to investigate optical properties of this ma- terial, the optical absorption technique has demonstrated as very appropriate to analysis of the impurities effect [12]. Previous published data [13] show that spectrosc- opic properties of Cr3+ ion in alexandrite are similar to 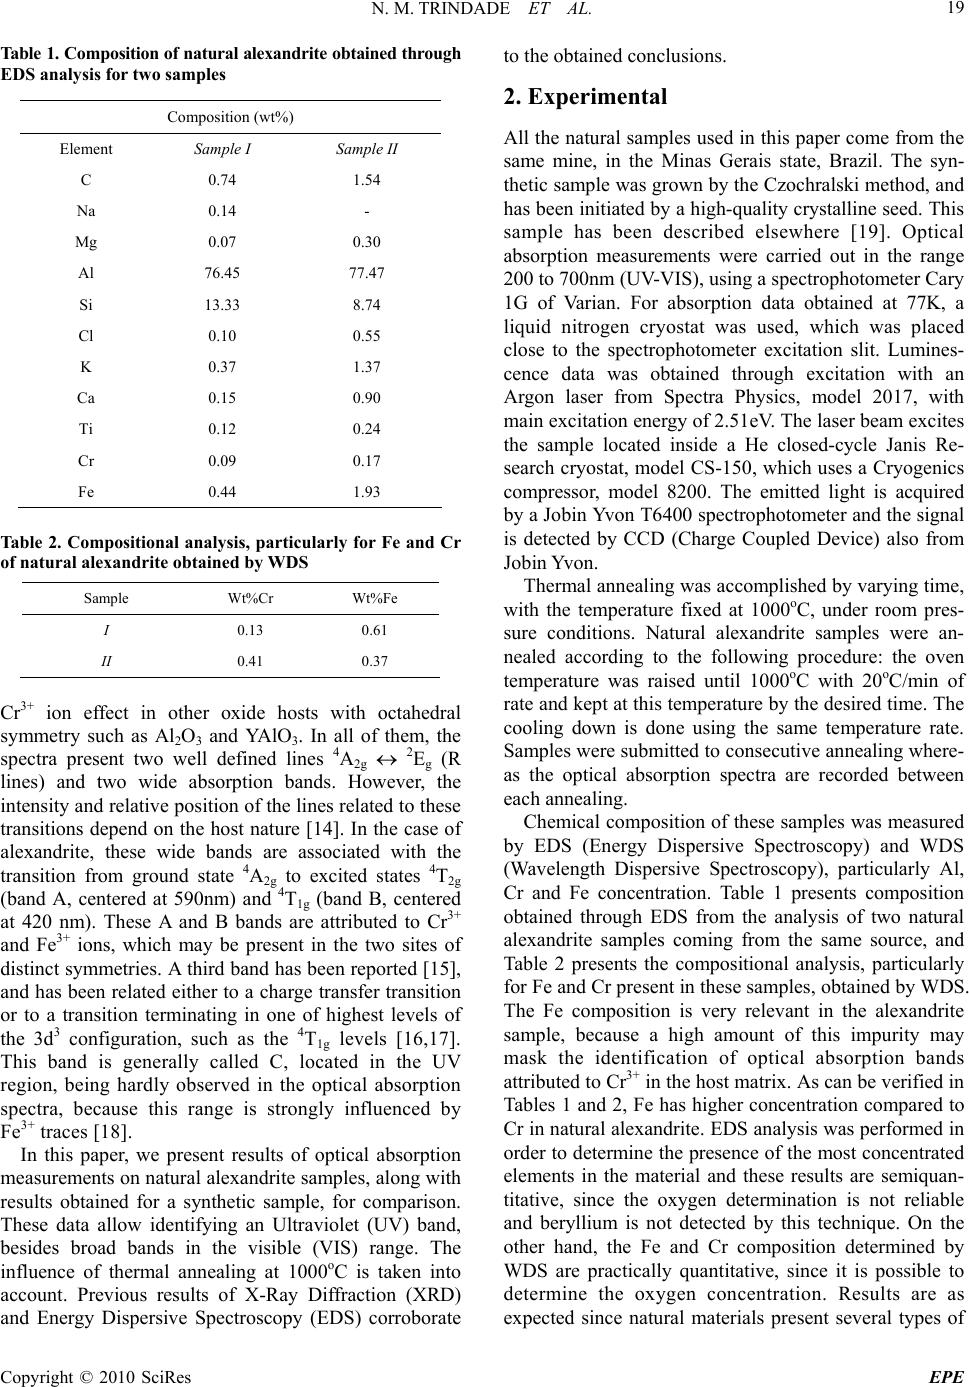 N. M. TRINDADE ET AL. Copyright © 2010 SciRes EPE 19 Table 1. Composition of natural alexandrite obtained through EDS analysis for two samples Composition (wt%) Element Sample I Sample II C 0.74 1.54 Na 0.14 - Mg 0.07 0.30 Al 76.45 77.47 Si 13.33 8.74 Cl 0.10 0.55 K 0.37 1.37 Ca 0.15 0.90 Ti 0.12 0.24 Cr 0.09 0.17 Fe 0.44 1.93 Table 2. Compositional analysis, particularly for Fe and Cr of natural alexandrite obtained by WDS Sample Wt%Cr Wt%Fe I 0.13 0.61 II 0.41 0.37 Cr3+ ion effect in other oxide hosts with octahedral symmetry such as Al2O3 and YAlO3. In all of them, the spectra present two well defined lines 4A2g 2Eg (R lines) and two wide absorption bands. However, the intensity and relative position of the lines related to these transitions depend on the host nature [14]. In the case of alexandrite, these wide bands are associated with the transition from ground state 4A2g to excited states 4T2g (band A, centered at 590nm) and 4T1g (band B, centered at 420 nm). These A and B bands are attributed to Cr3+ and Fe3+ ions, which may be present in the two sites of distinct symmetries. A third band has been reported [15], and has been related either to a charge transfer transition or to a transition terminating in one of highest levels of the 3d3 configuration, such as the 4T1g levels [16,17]. This band is generally called C, located in the UV region, being hardly observed in the optical absorption spectra, because this range is strongly influenced by Fe3+ traces [18]. In this paper, we present results of optical absorption measurements on natural alexandrite samples, along with results obtained for a synthetic sample, for comparison. These data allow identifying an Ultraviolet (UV) band, besides broad bands in the visible (VIS) range. The influence of thermal annealing at 1000oC is taken into account. Previous results of X-Ray Diffraction (XRD) and Energy Dispersive Spectroscopy (EDS) corroborate to the obtained conclusions. 2. Experimental All the natural samples used in this paper come from the same mine, in the Minas Gerais state, Brazil. The syn- thetic sample was grown by the Czochralski method, and has been initiated by a high-quality crystalline seed. This sample has been described elsewhere [19]. Optical absorption measurements were carried out in the range 200 to 700nm (UV-VIS), using a spectrophotometer Cary 1G of Varian. For absorption data obtained at 77K, a liquid nitrogen cryostat was used, which was placed close to the spectrophotometer excitation slit. Lumines- cence data was obtained through excitation with an Argon laser from Spectra Physics, model 2017, with main excitation energy of 2.51eV. The laser beam excites the sample located inside a He closed-cycle Janis Re- search cryostat, model CS-150, which uses a Cryogenics compressor, model 8200. The emitted light is acquired by a Jobin Yvon T6400 spectrophotometer and the signal is detected by CCD (Charge Coupled Device) also from Jobin Yvon. Thermal annealing was accomplished by varying time, with the temperature fixed at 1000oC, under room pres- sure conditions. Natural alexandrite samples were an- nealed according to the following procedure: the oven temperature was raised until 1000oC with 20oC/min of rate and kept at this temperature by the desired time. The cooling down is done using the same temperature rate. Samples were submitted to consecutive annealing where- as the optical absorption spectra are recorded between each annealing. Chemical composition of these samples was measured by EDS (Energy Dispersive Spectroscopy) and WDS (Wavelength Dispersive Spectroscopy), particularly Al, Cr and Fe concentration. Table 1 presents composition obtained through EDS from the analysis of two natural alexandrite samples coming from the same source, and Table 2 presents the compositional analysis, particularly for Fe and Cr present in these samples, obtained by WDS. The Fe composition is very relevant in the alexandrite sample, because a high amount of this impurity may mask the identification of optical absorption bands attributed to Cr3+ in the host matrix. As can be verified in Tables 1 and 2, Fe has higher concentration compared to Cr in natural alexandrite. EDS analysis was performed in order to determine the presence of the most concentrated elements in the material and these results are semiquan- titative, since the oxygen determination is not reliable and beryllium is not detected by this technique. On the other hand, the Fe and Cr composition determined by WDS are practically quantitative, since it is possible to determine the oxygen concentration. Results are as expected since natural materials present several types of 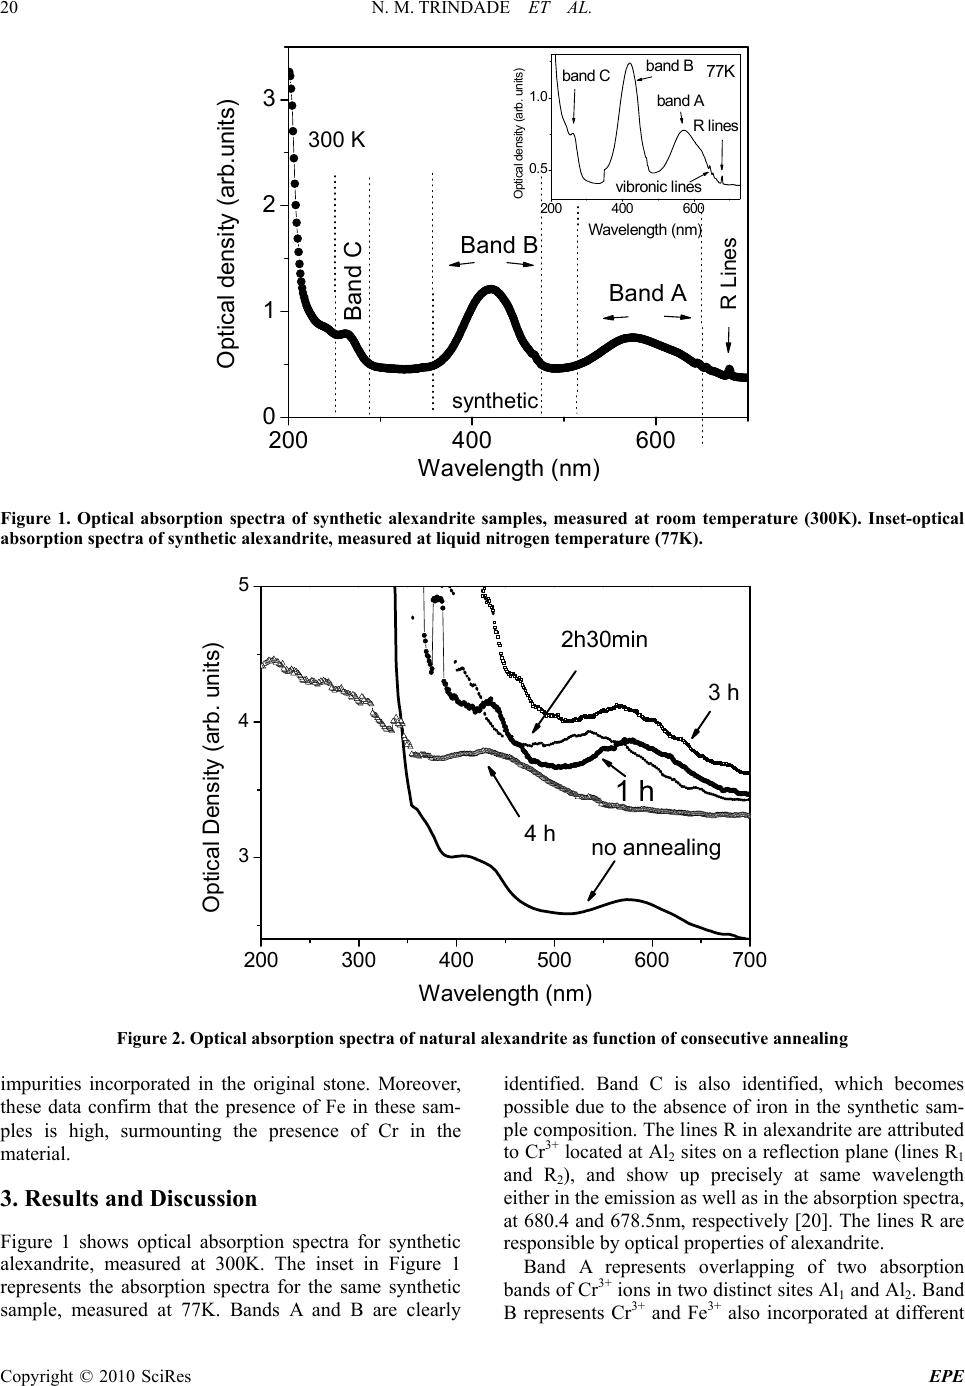 N. M. TRINDADE ET AL. Copyright © 2010 SciRes EPE 20 200 400 600 0 1 2 3 200 400 600 0. 5 1. 0 O p tical d ensity (arb . u nits ) Waveleng th (n m) 77K band Cband B band A vibronic lines R lines Optical density (arb.units) Wavelength (nm) Band C Band B Band A R Lines synthetic 300 K Figure 1. Optical absorption spectra of synthetic alexandrite samples, measured at room temperature (300K). Inset-optical absorption spectra of synthetic alexandrite, measured at liquid nitrogen temperature (77K). 200 300 400500 600 700 3 4 5 Optical Density (arb. units) Wavelength (nm) 3 h no annealing 1 h 2h30min 4 h Figure 2. Optical absorption spectra of natural alexandrite as function of consecutive annealing impurities incorporated in the original stone. Moreover, these data confirm that the presence of Fe in these sam- ples is high, surmounting the presence of Cr in the material. 3. Results and Discussion Figure 1 shows optical absorption spectra for synthetic alexandrite, measured at 300K. The inset in Figure 1 represents the absorption spectra for the same synthetic sample, measured at 77K. Bands A and B are clearly identified. Band C is also identified, which becomes possible due to the absence of iron in the synthetic sam- ple composition. The lines R in alexandrite are attributed to Cr3+ located at Al2 sites on a reflection plane (lines R1 and R2), and show up precisely at same wavelength either in the emission as well as in the absorption spectra, at 680.4 and 678.5nm, respectively [20]. The lines R are responsible by optical properties of alexandrite. Band A represents overlapping of two absorption bands of Cr3+ ions in two distinct sites Al1 and Al2. Band B represents Cr3+ and Fe3+ also incorporated at different  N. M. TRINDADE ET AL. Copyright © 2010 SciRes EPE 21 sites. Relevant parameters for the synthetic sample are obtained from Figure 1, such as band wavelength posi- tion, absorption coefficient and the full width a half maximum (), and are presented in Table 3. As can be verified, the results of optical absorption at room tem- perature and at liquid nitrogen temperature, in synthetic alexandrite, show agreement in the position of absorption bands, absorption coefficients and , with no signifi- cant variations. This sample is used as a reference in this paper, due to its outstanding optical quality. The meas- urement carried out at 77 K (inset of Figure 1) shows clearly the vibronic transition lines at 645, 654 and 663 nm [21]. The influence of consecutive thermal annealing on optical absorption bands of natural alexandrite is shown in Figure 2. The analysis of variation in the spectra allows investigation of the possible migration of Cr3+ between Al1 and Al2 sites. Relevant parameters for this material, such as and absorption coefficient are obtained from Figure 2, and are presented in Table 4. With the help of Tables 3 and 4, bands A and B of natural alexandrite samples without thermal annealing and the bands due to synthetic sample, recorded at room temperature, can be compared. It is easily verified that their central position ) ( shows a short shift. A larger difference occurs between their absorption coefficients, where the synthetic sample presents lower values than the natural alexandrite. Natural sample shows an absorp- tion coefficient 12 times higher for band A and 5 times higher for band B compared to the values of correspond- ing bands for the synthetic sample. That can be explained by the Cr concentration, which is higher for natural material and also due to the Fe concentration, which is present only in the natural samples. This is in good agreement with the lower optical density and higher transparency of synthetic sample. Concerning the natural sample, the absorption spec- tra present large bands centered about 580 and 585nm (band A) and 425 and 435 nm (band B), besides the R lines, close to 680nm. Thermal annealing causes a consecutive and discrete increase in the optical absorp- tion coefficients and a broadened band, which must be related to the increase of Cr3+ population in sites Al1 and Al2. This statement is reinforced by decomposition of this band, as shown in Figure 3. Band A vanishes with thermal annealing during 4 h, when the noise in the UV starts to disappear and band C begins to gain shape. This band had previously been found only with 5h of thermal annealing [21]. It shows that thermal treatment is an efficient method of refining the optical absorption data. Then, the emerging of band C can be related to the disappearing of band A. It is known that band A is an absorption band from Cr3+ ions in sites Al1 and Al2 and band C is also related with presence of Cr3+ [15]. Then, one may conclude that thermal an- nealing leads to diffusion of Cr3+ through the alexan- drite lattice. An increase of absorption coefficient of band B is taking place, presenting a maximum with 2h of annealing time, vanishing with 2 and a half hours and showing up back, but with lower absorption coef- ficient with 4 h of thermal treatment. These modifica- tions indicate migrations of Cr3+ and/or Fe3+ ions throughout the materials structure, revealed by the variation of . The lines R, either can be observed in a sole line, or separated in two lines, called R1 and R2. The line R1 is located around 680- 682nm and R2 around 678-680nm. The analysis of optical absorption bands behavior of natural alexandrite sample submitted to thermal anneal- ing can be done by comparing with synthetic sample (Figure 1). In our approach, the band A is decomposed in two Gaussian curves, in order to estimate the relative amount of Cr3+ ions between Al1 and Al2 sites [14] and the migration caused by thermal annealing. The data fitting for the synthetic sample, shown in Figure 3, leads to the best fitting of band A, when a regression of two Gaussian curves is used. Band A corresponds to overlap- ping of optical absorption bands from Cr3+ located in sites Al1 and Al2, as already mentioned. Al2 is larger than Al1, and then, it is preferentially occupied by Cr3+ ions. There is a dependency on color shift and other optical properties with Cr3+ distribution among these sites, Table 3. Parameters obtained from optical Absorption data for synthetic alexandrite, at 300 and 77 K. λ means the position of maxima. α is the optical absorption coefficient and Δλ is full width a half maximum Optical Absorption bands – Synthetic sample Band A (Cr3+) Band B (Cr3+, Fe3+) Band C (Cr3+) Absorption Lines of Cr3+ T (K) λ (nm) α (cm-1) ∆λ (nm) λ (nm) α (cm-1) ∆λ (nm)λ (nm) α (cm-1) ∆λ (nm) λ (nm) 300 583 0.31 91.5 420 0.75 59.5 267 0.11 16.8 680 77 582 0.32 90 419 0.76 56.6 265 0.11 15.8 680  N. M. TRINDADE ET AL. Copyright © 2010 SciRes EPE 22 Table 4. Parameters obtained from optical Absorption data (UV-Vis) for natural alexandrite sample after thermal annealing. λ means the position of maxima. α is the optical absorption coefficient and Δλ is full width a half maximum Absorption bands of natural alexandrite Absorption Banda A (Cr3+) Banda B (Cr3+, Fe3+) Banda C (Cr3+) Lines of Cr3+ λ (nm) α (cm-1) ∆λ (nm) λ (nm) α (cm-1) ∆λ (nm) λ (nm) α (cm-1) ∆λ (nm) λ (nm) STT 585 3.71 85 426 3.9 47.8 - - - 680 TT1000ºC/ 1h 585 5.76 93.8 429 4.36 46.2 - - - 680 and 682 TT1000ºC/ 1h 30min 583 4.24 84 428 6.08 48.9 - - - 679 TT1000ºC/ 2h 585 5.71 89.7 432 8.11 46.9 - - - 679 and 681 TT1000ºC/ 2h30min 563 4.9 89.64 - - - - - - - TT1000ºC/ 3h 577 7.2 96.98 - - - - - - - TT1000ºC/ 4h - - - 429 1.8 57.67 276 6.4 57.4 680 which was determined by Electron Paramagnetic Reso- nance (EPR) [11,22], and indicates that Cr3+ in BeAl2O4 enters in a average ration of 75% in Al2 and 25% in Al1, either in natural sample as well as synthetic alexandrite sample. Based on this ratio, the analysis of Figure 3 was performed and the results are shown in Table 5. With the help of Figures 1 and 2, it may be concluded from Table 5 that in the synthetic sample, we have the 1:3 ratio in agreement with previous mentioned reported data [11, 22]. The addition of two Gaussian curves leads to a perfect fitting of the experimental curve. Then, they can be used to the analysis of the absorption band of natural sample. In this case, the fitting by Gaussian curves is hard to be done, which is caused by the experimental noise. In the cases where a data fitting of band A became possible, it was observed that an increase of thermal annealing time leads to decrease of Cr3+ in Al1 sites and thus, an increase in the occupation of Al2 sites. Besides, there is an increase of the Gaussian curves area, which 500 550 600 650 0.0 0.1 0.2 0.3 experimental gaussian fitting Cr3+ in Al2 Cr3+ in Al1 Optical Density (arb.units) Wavelength (nm) Figure 3. Decomposition of band A of optical absorption spectra in two Gaussian curves for synthetic alexandrite 678694 695 696 0 3 6 9 12 S1 R1 Intensity (arb. units) Wavelength (nm) No T.A. T.A. 1000oC, 4 h R2 Natural alexandrite 20 K Figure 4. Photoluminescence spectra of natural alexandrite, measured ate 20 K, before any thermal annealing and after the final annealing at 1000oC, 4 hour Table 5. Analysis of bands A, B and C of natural and syn- thetic alexandrite samples, obtained from decomposition of optical absorption bands Band A Average total area (a. u.) Thermal annealing temperature/time Al1(%) Al2(%) Band A Band B Band C STT 33.5 66.5 15.7 20.4- 1000ºC/5min 22.1 77.9 24.2 15.4- 1000ºC/15min 14.5 85.5 24.7 17.5- 1000ºC/30min 15 85 28.1 44.8- 1000ºC/2h - - 29.0 79.3- 1000ºC/2h30min 18.2 81.8 35.6 - - 1000ºC/3h 4.8 95.2 41.4 - - 1000ºC/4h - - - 14.135.7 Synthetic sample 22.7 77.3 31.8 50.43.1 means an increase of Cr3+ concentration, responsible for the optical absorption in the sample. Cr3+ ions in Al2 sites are responsible for laser emission, which are character- ized by electric dipole transitions of high-probability, 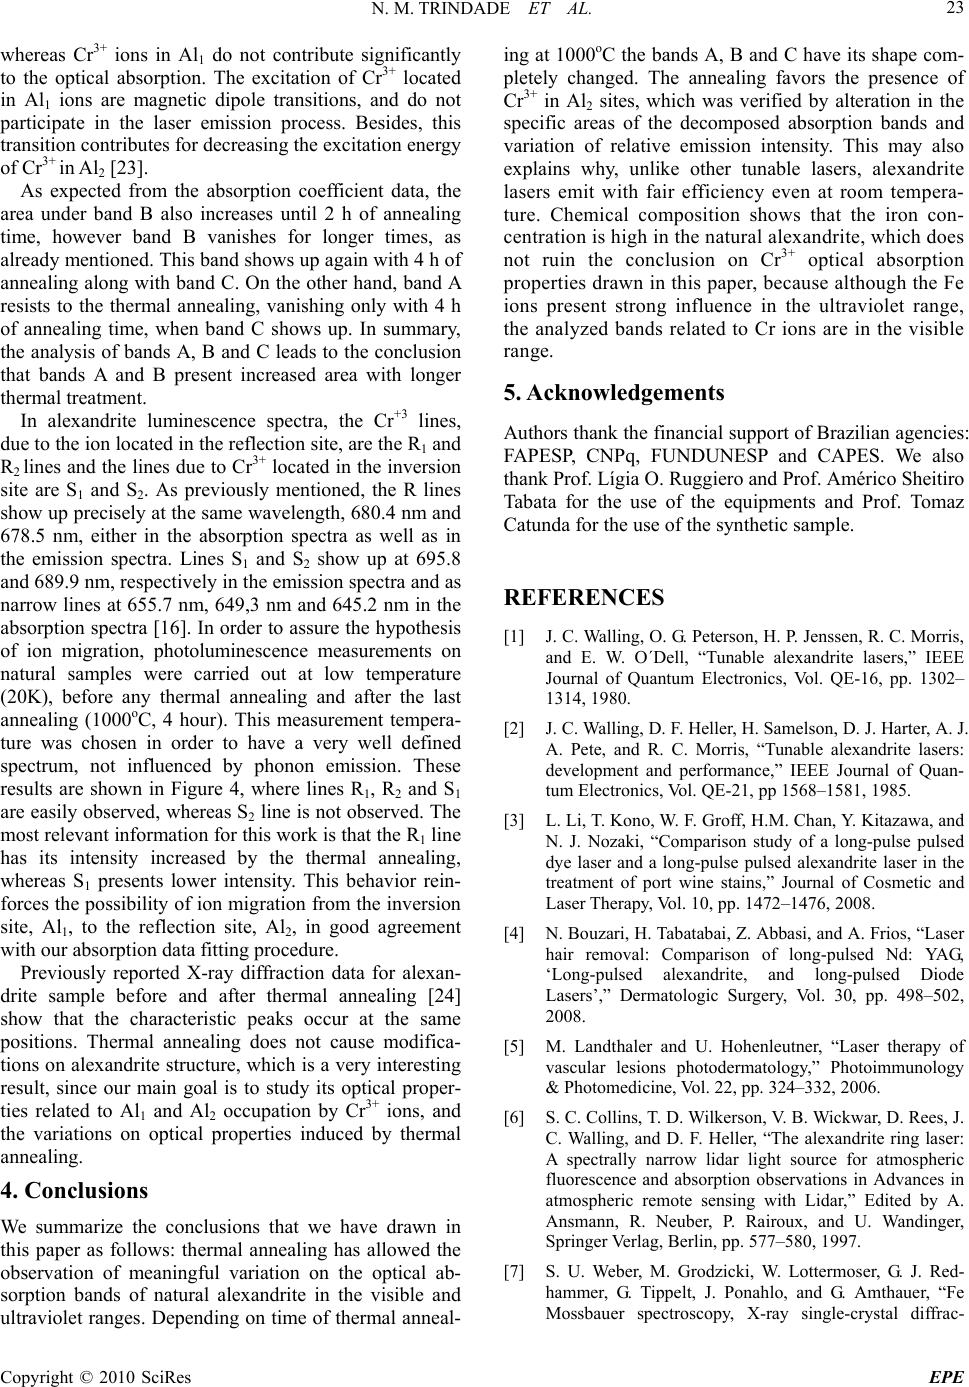 N. M. TRINDADE ET AL. Copyright © 2010 SciRes EPE 23 whereas Cr3+ ions in Al1 do not contribute significantly to the optical absorption. The excitation of Cr3+ located in Al1 ions are magnetic dipole transitions, and do not participate in the laser emission process. Besides, this transition contributes for decreasing the excitation energy of Cr3+ in Al2 [23]. As expected from the absorption coefficient data, the area under band B also increases until 2 h of annealing time, however band B vanishes for longer times, as already mentioned. This band shows up again with 4 h of annealing along with band C. On the other hand, band A resists to the thermal annealing, vanishing only with 4 h of annealing time, when band C shows up. In summary, the analysis of bands A, B and C leads to the conclusion that bands A and B present increased area with longer thermal treatment. In alexandrite luminescence spectra, the Cr+3 lines, due to the ion located in the reflection site, are the R1 and R2 lines and the lines due to Cr3+ located in the inversion site are S1 and S2. As previously mentioned, the R lines show up precisely at the same wavelength, 680.4 nm and 678.5 nm, either in the absorption spectra as well as in the emission spectra. Lines S1 and S2 show up at 695.8 and 689.9 nm, respectively in the emission spectra and as narrow lines at 655.7 nm, 649,3 nm and 645.2 nm in the absorption spectra [16]. In order to assure the hypothesis of ion migration, photoluminescence measurements on natural samples were carried out at low temperature (20K), before any thermal annealing and after the last annealing (1000oC, 4 hour). This measurement tempera- ture was chosen in order to have a very well defined spectrum, not influenced by phonon emission. These results are shown in Figure 4, where lines R1, R2 and S1 are easily observed, whereas S2 line is not observed. The most relevant information for this work is that the R1 line has its intensity increased by the thermal annealing, whereas S1 presents lower intensity. This behavior rein- forces the possibility of ion migration from the inversion site, Al1, to the reflection site, Al2, in good agreement with our absorption data fitting procedure. Previously reported X-ray diffraction data for alexan- drite sample before and after thermal annealing [24] show that the characteristic peaks occur at the same positions. Thermal annealing does not cause modifica- tions on alexandrite structure, which is a very interesting result, since our main goal is to study its optical proper- ties related to Al1 and Al2 occupation by Cr3+ ions, and the variations on optical properties induced by thermal annealing. 4. Conclusions We summarize the conclusions that we have drawn in this paper as follows: thermal annealing has allowed the observation of meaningful variation on the optical ab- sorption bands of natural alexandrite in the visible and ultraviolet ranges. Depending on time of thermal anneal- ing at 1000oC the bands A, B and C have its shape com- pletely changed. The annealing favors the presence of Cr3+ in Al2 sites, which was verified by alteration in the specific areas of the decomposed absorption bands and variation of relative emission intensity. This may also explains why, unlike other tunable lasers, alexandrite lasers emit with fair efficiency even at room tempera- ture. Chemical composition shows that the iron con- centration is high in the natural alexandrite, which does not ruin the conclusion on Cr3+ optical absorption properties drawn in this paper, because although the Fe ions present strong influence in the ultraviolet range, the analyzed bands related to Cr ions are in the visible range. 5. Acknowledgements Authors thank the financial support of Brazilian agencies: FAPESP, CNPq, FUNDUNESP and CAPES. We also thank Prof. Lígia O. Ruggiero and Prof. Américo Sheitiro Tabata for the use of the equipments and Prof. Tomaz Catunda for the use of the synthetic sample. REFERENCES [1] J. C. Walling, O. G. Peterson, H. P. Jenssen, R. C. Morris, and E. W. O´Dell, “Tunable alexandrite lasers,” IEEE Journal of Quantum Electronics, Vol. QE-16, pp. 1302– 1314, 1980. [2] J. C. Walling, D. F. Heller, H. Samelson, D. J. Harter, A. J. A. Pete, and R. C. Morris, “Tunable alexandrite lasers: development and performance,” IEEE Journal of Quan- tum Electronics, Vol. QE-21, pp 1568–1581, 1985. [3] L. Li, T. Kono, W. F. Groff, H.M. Chan, Y. Kitazawa, and N. J. Nozaki, “Comparison study of a long-pulse pulsed dye laser and a long-pulse pulsed alexandrite laser in the treatment of port wine stains,” Journal of Cosmetic and Laser Therapy, Vol. 10, pp. 1472–1476, 2008. [4] N. Bouzari, H. Tabatabai, Z. Abbasi, and A. Frios, “Laser hair removal: Comparison of long-pulsed Nd: YAG, ‘Long-pulsed alexandrite, and long-pulsed Diode Lasers’,” Dermatologic Surgery, Vol. 30, pp. 498–502, 2008. [5] M. Landthaler and U. Hohenleutner, “Laser therapy of vascular lesions photodermatology,” Photoimmunology & Photomedicine, Vol. 22, pp. 324–332, 2006. [6] S. C. Collins, T. D. Wilkerson, V. B. Wickwar, D. Rees, J. C. Walling, and D. F. Heller, “The alexandrite ring laser: A spectrally narrow lidar light source for atmospheric fluorescence and absorption observations in Advances in atmospheric remote sensing with Lidar,” Edited by A. Ansmann, R. Neuber, P. Rairoux, and U. Wandinger, Springer Verlag, Berlin, pp. 577–580, 1997. [7] S. U. Weber, M. Grodzicki, W. Lottermoser, G. J. Red- hammer, G. Tippelt, J. Ponahlo, and G. Amthauer, “Fe Mossbauer spectroscopy, X-ray single-crystal diffrac-  N. M. TRINDADE ET AL. Copyright © 2010 SciRes EPE 24 tometry, and electronic structure calculations on natural alexandrite,” Physics and Chemistry of Minerals, Vol. 34, pp. 507–515, 2007. [8] V. I. Solomonov, S. G. Mikhailov, and A. I. Lipchak, “Impurity luminescence of alexandrite crystals,” Journal of Applied Physics, Vol. 69, pp. 423–429, 2002. [9] R. M. F. Scalvi, M. S. Li, and L. V. A. Scalvi, “Thermal annealing-induced electric dipole relaxation in natural alexandrite,” Physics and Chemistry Minerals, Vol. 31, pp. 733–737, 2005. [10] C. F. Cline, R. C. Morris, M. Dutoit, and P. J. Harget, “Physical properties of BeAl2O4 single crystals,” Journal of Materials Science, Vol. 14, pp. 941–944, 1979. [11] G. V. Bukin, A. V. Eliseev, V. N. Matrosov, V. P. Solntsev, E. I. Kharchenko, and E. G. Tsvetjov, “The growth and examination of optical properties of gem alexandrite,” Proceedings of the XI IMA Meeting, Novosibirsk, pp. 317–328, 1980. [12] J. A. Hernandez, W. K. Cory, and J. O. Rubio, “A non destructive method for determining the Eu2+ concentra- tion in the alkali chlorides,” Japanese Journal of Applied Physics, Vol. 18, pp. 533–538, 1979. [13] M. J. Weber and T. E. Varitimos, “Optical spectra and relaxation of Cr3+ ion in YAlO3,” Journal of Applied Physics, Vol. 45, pp. 810–816, 1974. [14] J. Xu, K. Shi, G. Xiong, and X. Xu, “The vibrational relaxation processes in BeAl2O4:Cr3+”, Journal of Lumi- nescence, Vol. 40 & 41, pp. 611–612, 1988. [15] A. E. Underhill and D. E. Billing, “Calculation of the Racah parameter B for Nickel (II) and cobalt (II) com- pounds,” Nature, Vol. 210, pp. 834–835, 1966. [16] R. C. Powell, L. Xi, X. Gang, and G. J. Quarles, “Spec- troscopic properties of alexandrite crystals,” Physical Re- view B, Vol. 32, pp. 2788–2797, 1985. [17] A. B. Suchocki, G. D. Gilliland, R. C. Powell, and J. M Bowen, “Spectroscopy properties of alexandrite crystals II,” Journal of Luminescence, Vol. 37, pp. 29–37, 1987. [18] F. Hassan and A. El-Rakhawy, “Chromium III centers in synthetic alexandrite,” American Mineralogist, Vol. 59, pp. 159–165, 1974. [19] S. K. Pan and X. G. Wang, “Growth of laser crystal alexandrite,” Crystal Research and Technology, Vol. 29, pp. k31–k35, 1994. [20] P. Fabeni, G. P. Pazzi, and L. Salvini, “Impurity centers for tunable lasers in the ultraviolet and visible regions,” Journal of Physics and Chemistry of Solids, Vol. 52, pp. 299–317, 1991. [21] R. M. F. Scalvi, M. S. Li, and L. V. A. Scalvi, “Annealing effects on optical properties of natural alexandrite,” Journal of Physics: Condensed Matter, Vol. 15, pp. 7437– 7443, 2003. [22] H. Rager, A. Bakhshand-Khiri, and K. Schmetze, “Inves- tigation of the intracrystalline Cr3+ distribution in natural and synthetic alexandrites,” N. Jb. Miner. Mh, Vol. 2 , pp. 545–557, 1998. [23] B. K. Sevast’yanov, “Excited-state absorption spectros- copy of crystal dopede with Cr3+, Ti3+, and Nd3+ ions, re- view,” Crystallography Reports, Vol. 48, pp. 989–1011, 2003. [24] R. M. F. Scalvi, L. O. Ruggiero, and M. S. Li, “Influence of annealing on X-Ray diffraction of natural alexandrite,” Powder Diffraction, Vol. 17, pp. 135–138, 2002. |