Journal of Water Resource and Protection
Vol. 2 No. 6 (2010) , Article ID: 2120 , 12 pages DOI:10.4236/jwarp.2010.26069
Multifactorial Fuzzy Approach for the Assessment of Groundwater Quality
Civil Engineering Department, National Institute of Technology, Tiruchirappalli, S. India
E-mail: venkatkumar.nit@gmail.com
Received March 1, 2010; revised April 23, 2010; accepted May 4, 2010
Keywords: Groundwater, Potability, Fuzzy Simulation, GIS, Tiruchirappalli
ABSTRACT
This paper describes the utility of fuzzy Simulink model to assess the groundwater quality levels in Tiruchirappalli city, S. India. Water quality management is an important issue in the modern times. The study aimed at examining the influence of multiple parameters of ground water on potable quality. The data collected for Tiruchirappalli city have been utilized to develop fuzzy Simulink approach. This is illustrated with seventy nine ground water samples collected from Tiruchirappalli Corporation, S. India. The chara cteristics of the groundwater groundwater for this plain were monitored during the years 2006 and 2008. The quality of groundwater at several established stations within the plain were assessed using Fuzzy simulation. The results of the calculated fuzzy logic Simulink model and the monitoring study have yielded good agreement. Groundwater quality for potability indicated high to moderate water pollution levels at Srirangam, Ariyamangalam, Golden Rock and K. Abisekapuram depending on factors such as depth to groundwater, constituents of groundwater and vulnerability of groundwater to pollution. Fuzzy logic simulation approach was a practical, simple and useful tool to assess groundwater quality. This approach was capable of showing the water quality assessment for drinking on fuzzy Simulink model
1. Introduction
The quality, quantity and availability of drinking water are one of the most important environmental, social and political issues at global level. There are quality variation specifications of water for its intended use. Groundwater chemistry is affected from many factors such as movement through the rocks, recycling by irrigation practices, natural or artificial recharge and discharge.
Therefore, the determination of water quality is of primary prerequisite for public, agricultural and industrial supplies. Monitoring of water quality and qualitative decision-making on the basis of a data is challenge for environmental engineers and hydrologists as every step from sampling to analysis contains uncertainties. The regulatory limits for various pollutants/contaminants in drinking water proposed by various regulatory bodies like Bureau of Indian Standards (BIS) and World Health Organization (WHO) [1,2] are having limitations due to variation in intake to water by individuals during various seasons throughout the year. A prescribed limit from any regulatory body contains uncertainties as these are the extrapolated values from the data either from animal experiments or very trivial epidemiological studies [3-5].
The applications of artificial intelligence techniques have been used to convert human experience into a form of understandable by computers. Fuzzy logic provides a powerful and convenient formalism for classifying environmental conditions and for describing both natural and anthropogenic changes. Whereas traditional indices are based either on crisp sets with discontinuous boundaries between them, or on continuous variables whose values are only meaningful to experts, fuzzy sets make it possible to combine these approaches. From fuzzy logic it can be used to classify and quantify environmental effects of a subjective nature and it even provides formalism for dealing with missing data. The fuzzy memberships developed in this paper were used as water quality indices, but it is also possible to “defuzzify” them and to obtain a more traditional type of index [6].
A new groundwater modeling technique was developed in which fuzzy set theory is combined with finite difference modeling methods. Additionally, a rule based fuzzy-set approach to risk analysis of nitrate contaminated groundwater was presented in the study of Dahab [3]. Recently, neuro fuzzy techniques have been applied to predict groundwater vulnerability using GIS [4,7,8].
In this present paper, a fuzzy Simulink system was developed to assess the groundwater quality of Tiruchirappalli city corporation at previously selected seventy nine sampling stations. The applied water quality assessment system involves the selection of water quality parameters and index values to from BIS and WHO standards. Ranges of values were assigned to these parameters to form the input Membership Functions (MBF). In this application, twelve input variables, namely as pH, Ec, Ca++, Mg++, Na+, Cl-, Alkalinity, Total Hardness, SO4, F, NO3, and Coli forms were used to describe Water Quality Index (WQI) [9]. The input membership functions of the selected parameters have three linguistic terms defined as Acceptable, Non Acceptable and Rejected levels of groundwater.
The groundwater hydrochemistry records of the study area were used for the preparation of water quality maps. These maps were obtained by geostatistical (Kriging) methodology and the results are presented in the form of equal ion concentration lines [10]. The MATLAB V. 2008 (a) software was also used to analyse the data.
2. Study Area, Materials and Methods
2.1. Study Area
The Base map of Tiruchirappalli city was drawn from Survey of India Topo sheets Nos. 58 J/9, 10, 13 and 14 and satellite imagery (IRS-1C and LISS III) is lies between 10° 48' 18'' North: 78° 41' 7'' East. The general topology of Tiruchirappalli is flat and lies at an altitude of 78 m above sea level. Tiruchirappalli is fed by the rivers Cauvery and Kollidam. There are reserve forests along the river Cauvery. Golden Rock and the Rock Fort are the prominent hills. The southern/south-western part of the district is dotted by several hills which are thought to be an offset of the Western Ghats Mountain range and the soil is considered to be very fertile. For the sample collection, seventy nine bore well locations were identified. These locations were identified in such a way that the bore wells were evenly distributed over the study area.
The water samples were collected for periods between March 2006 and December 2008. The water from these bore wells were used for drinking, house hold utilities and bathing by the residents. The Laboratory tests were conducted on these samples for 16 different physicochemical potable water quality parameters as per the standard procedure [1,2,11] criteria are adopted for testing these samples.
2.2. Thematic Maps
The base map data used for the study included digitized data sets originally developed by Survey of India, the Tiruchirappalli city corporation. The data sets were originally digitized from 1:20,000 scale topographic maps. The work maps were prepared from 1 : 20,000 scale topographic paper maps using AutoCAD, Arc GIS 9.2 and Surfer V.7.
The groundwater hydrochemistry records of the study area were used for the preparation of maps. These maps are obtained by geostatistical (Kriging) methodology and the results were presented in the form of equal ion concentration lines [10,12,13].
The groundwater quality data were used as the hidden layer for the preparation of base maps. These features were the boundary lines between mapping units, other linear features (streets, rivers, roads, etc.) and point features (bore well points, etc.). The contours were developed for pH, EC, Cl-, Na+, Ca++, Mg++, Total Hardness, Alkalinity, F, SO4-, Coli form and NO-3 for the seasonal conditions of the study period between 2006 and 2008.
The monitoring and sampling program was initiated in 2006 and finalized the year 2008. A total of seventy nine monitoring stations were established of them represented groundwater conditions. The groundwater stations had different depths to groundwater. The sampling locations of all the stations are shown in Figure 1. A total of seventy nine separate ground water quality monitoring sessions were realized during the study period during the months of June, August, October and November of the year 2006-2008 and March, June and October of the year 2006-2008.
2.2.1. Potable Water Quality Maps
The data used for the mapping water quality assessment for potability were developed from the laboratory water quality analysis. Data for these studies were based on the sampling conducted by the first author for groundwater samples collected from predetermined locations of existing bore wells in Tiruchirappalli city. The data were linked to the sampling bore well locations using geodata base creation of Arc GIS 9.2 and surfer software.
The decision on the water quality assessment for potability gives that the water is desirable, acceptable and not acceptable as per the guidelines from BIS and WHO [1, 12] regulatory bodies. But, in the border line cases of water quality parameters, it becomes a Herculean task as different types of uncertainties are involved at various part of experimental and measurement process right from sampling, sample storage, processing and analysis. The sets of the monitored data and limits should not be as crisp set, but as fuzzy sets. One way of avoiding the difficulty in uncertainty handling in water quality assessment is to introduce a margin of safety or degree of precaution before applying a single value to drinking water quality standards as the same technique was also used by other workers in the field of environmental science [14-16]. These methodologies based on fuzzy set theory
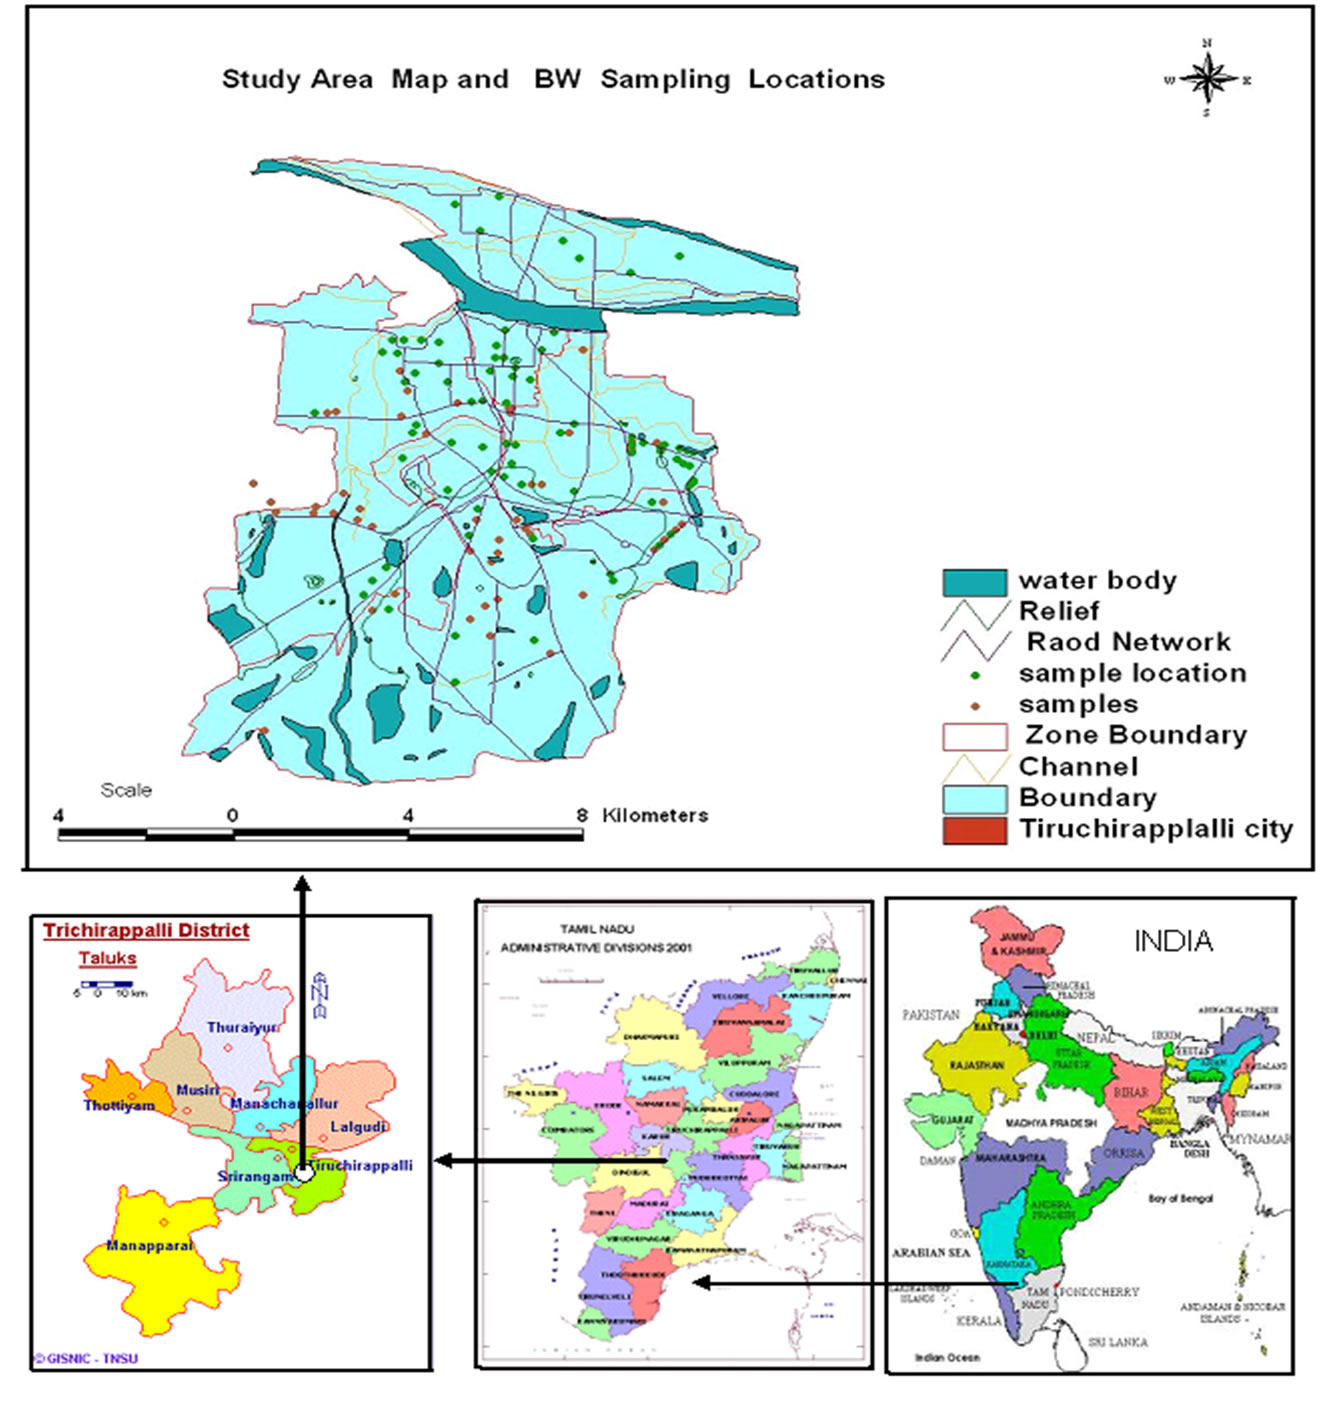
Figure 1. Study area map with sampling locations.
were utilized with real environmental water quality assessment to handle the uncertainties in imprecise environment in decision-making on the potability water quality can be handled. Keeping the importance of uncertainty handling in the drinking water quality assessment and versatility of the fuzzy set theory in decision-making. An attempt was made to classify the under ground water from Tiruchirappalli corporation, South India for the drinking purposes.
2.3. Fuzzy Sets
The theory of fuzzy sets was first introduced by [17] to model uncertainty in subjective information. Fuzzy sets are defined as sets whose members are vague objects. Data can generally be received in terms of linguistic judgments and beliefs (natural language), which can then be converted to the form of fuzzy sets in order to provide a base for logical and mathematical reasoning [18]. A fuzzy set is represented by a membership function defined on the universe of discourse. The universe of discourse is the space where the fuzzy variables are defined. The membership function gives the grade, or degree, of membership (m) within the set, of any element of the universe of discourse. The membership function maps the elements of the universe on to numerical values in the interval (0, 1). A membership function value of zero implies that the corresponding element is definitely not an element of the fuzzy set, while a value of unit means that the element fully belongs to the set. A grade of membership in between corresponds to the fuzzy membership to set [13].
2.3.1. Fuzzy Rule Evaluation
Fuzzy rules appear no different to standard rules. They take the familiar form “IF x is a, THEN y is b”, where x and y are linguistic variables, and where a and b are linguistic values. Under classical logic, the THEN implication is true of the IF condition, known as the antecedent, is evaluated as true. For fuzzy rules, the implication is set to be true to the same degree as the antecedent. Considering two linguistic variables length and width, and the rule “IF length is a, THEN width is b”, If a is instantiated to a value then b is assigned to the value such that the membership of b is the same as that for a, each to their respective fuzzy sets. This process is known as monotonic selection. Antecedents with more than one statement are not a problem as the earlier rules for fuzzy union (disjunction, OR) and intersection (conjunction, AND) are applied. Similarly for consequents with multiple parts, the resultant antecedent membership is applied to all parts of the consequent.
2.3.2. Matching between Fuzzy Values
The fuzzy number for field data (A) on parameters and the fuzzy numbers (A') characterizing linguistic terms are matched together to arrive at a measure called a Degree of Match (DM) defined by: Erosy et al. (1992), [13]. DM ff (AA') = ∫ µ A ∩ A' (x) dx / ∫ µA' (x) S dx, x ÎX. in which x denotes the universe, and µA ∩ A' , x is membership grade for A∩A'.
Furthermore, if A and A' are the discrete possibility distributions the measure is defined as:
DM ff (AA') = S µ A ∩ A' (x) / S µA' (x), x ÎX.
2.4. Fuzzification
Fuzzification is the process of decomposing a system input and/or output into one or more fuzzy sets. Many types of curves can be used, but triangular or trapezoidal shaped membership functions are the most common. In this present study trapezoidal functions were used for the Input variables and triangular functions were utilized for output variables. Fuzzy sets span a region of input (or output) value graphed with the membership. Any particular input is interpreted from this fuzzy set and a degree of membership is interpreted. The membership functions should overlap to allow smooth mapping of the system. The process of fuzzification allows the system inputs and outputs to be expressed in linguistic terms so that rules can be applied in a simple manner to express a complex system.
2.4.1. Defuzzification
After fuzzy reasoning a linguistic output variable which needs to be translated into a crisp value. The objective is to derive a single crisp numeric value that best represents the inferred fuzzy values of the linguistic output variable. Defuzzification is such inverse transformation which maps the output from the fuzzy domain back into the crisp domain. Some defuzzification methods tend to produce an integral output considering all the elements of the resulting fuzzy set with the corresponding weights. Other methods take into account just the elements corresponding to the maximum points of the resulting membership functions [13]. The Mean of Maximum (MoM) method is used only in some cases where the Center of Maximum (CoM) approach does not work. In the CoM method, only the peaks of the membership functions are used. The defuzzified crisp compromise value is determined by finding the place where the weights are balanced. Thus the areas of the membership functions play no role and only the maxima are used. The crisp output is computed as a weighted mean of the term membership maxima, weighted by the inference results.
2.4.2. Fuzzy Logic Simulation System
In fuzzy logic system, the knowledge of the human is put in the form of a set of fuzzy linguistic rules. These rules would produce approximate decisions, just as a human would. The human expert observes quantities by observing the inputs, and leads to a decision or output using his judgment. The human expert can be replaced by a combination of a fuzzy rule-based system (FRBS) and a block called a defuzzifier. The inputs are fed into the FRBS, where physical quantities are represented into linguistic variables with appropriate membership functions. These linguistic variables are then used in a set of fuzzy rules within an inference engine, resulting in a new set of fuzzy linguistic variables. In defuzzification stage, the variables are combined and changed to a crisp output which represents an approximation to actual output [19].
Simulink models and sub models representing the complex interaction between various parameters are framed and used for twelve selected parameters. The grouping of parameters and rules designed for Simulink. A typical block diagram showing Simulink of first group water quality parameters viz. pH, EC, Cl-, Na+ is presented in Figure 2. Data collected from the study area for various seasons were used as the inputs for Fuzzy simulation model. The simulation was used for the collected data for seasonal variations. Based on Field experience, Delphi technique [20] and expert knowledge 66 rules are designed for physico-chemical water quality parameters in Group I as shown in Figure 2.
The parameters of the kind Total Alkalinity, Total Hardness, Calcium and Magnesium were the members of second group parameters and were selected with 73 design IFTHEN rules used in the Simulink process. The schematic block diagram is shown in Figure 3. The health concern parameters such as Sulphate, Fluoride [21], Nitrate and Coli forms were selected in group three and 42, IF – THEN rules were utilized based up on expert’s knowledge and shown in Figure 4. Out puts from all the three groups that is the results obtained from first, second and third groups were combined and framed as final simulation model as shown in Figure 5. The quality assessment of groundwater of Tiruchirappalli city, a total of 27 rules was fired for the final assessment of ground-
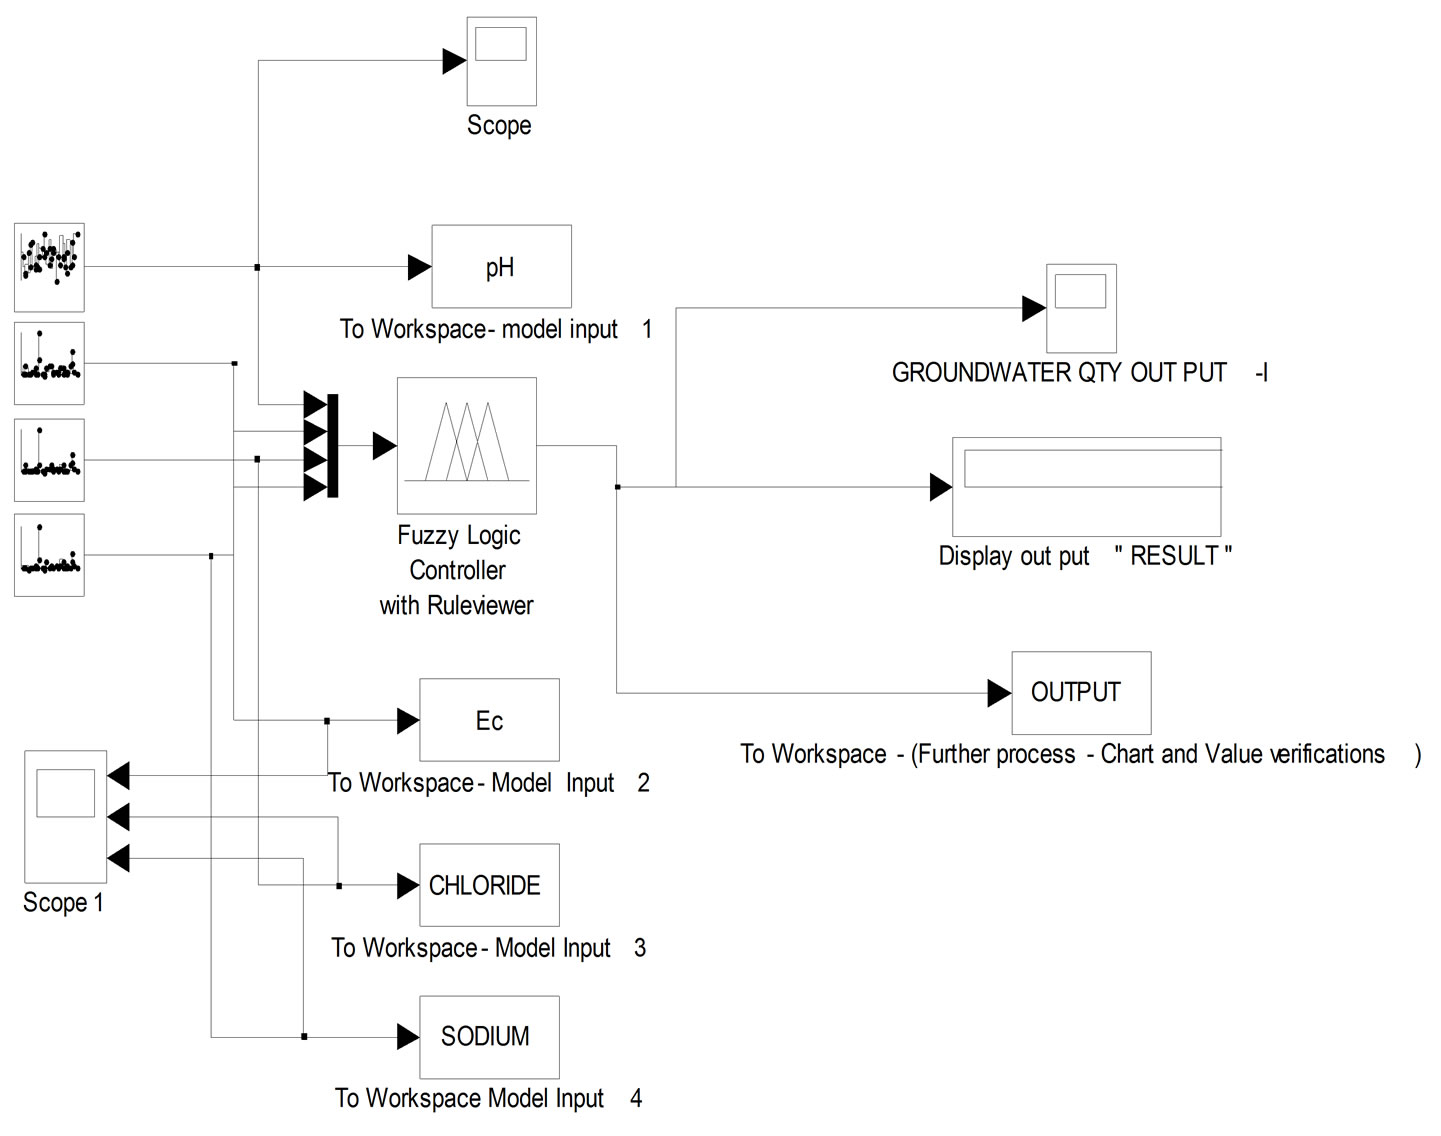
Figure 2. Block diagram for simulink process of FIP - First group water quality parameters.
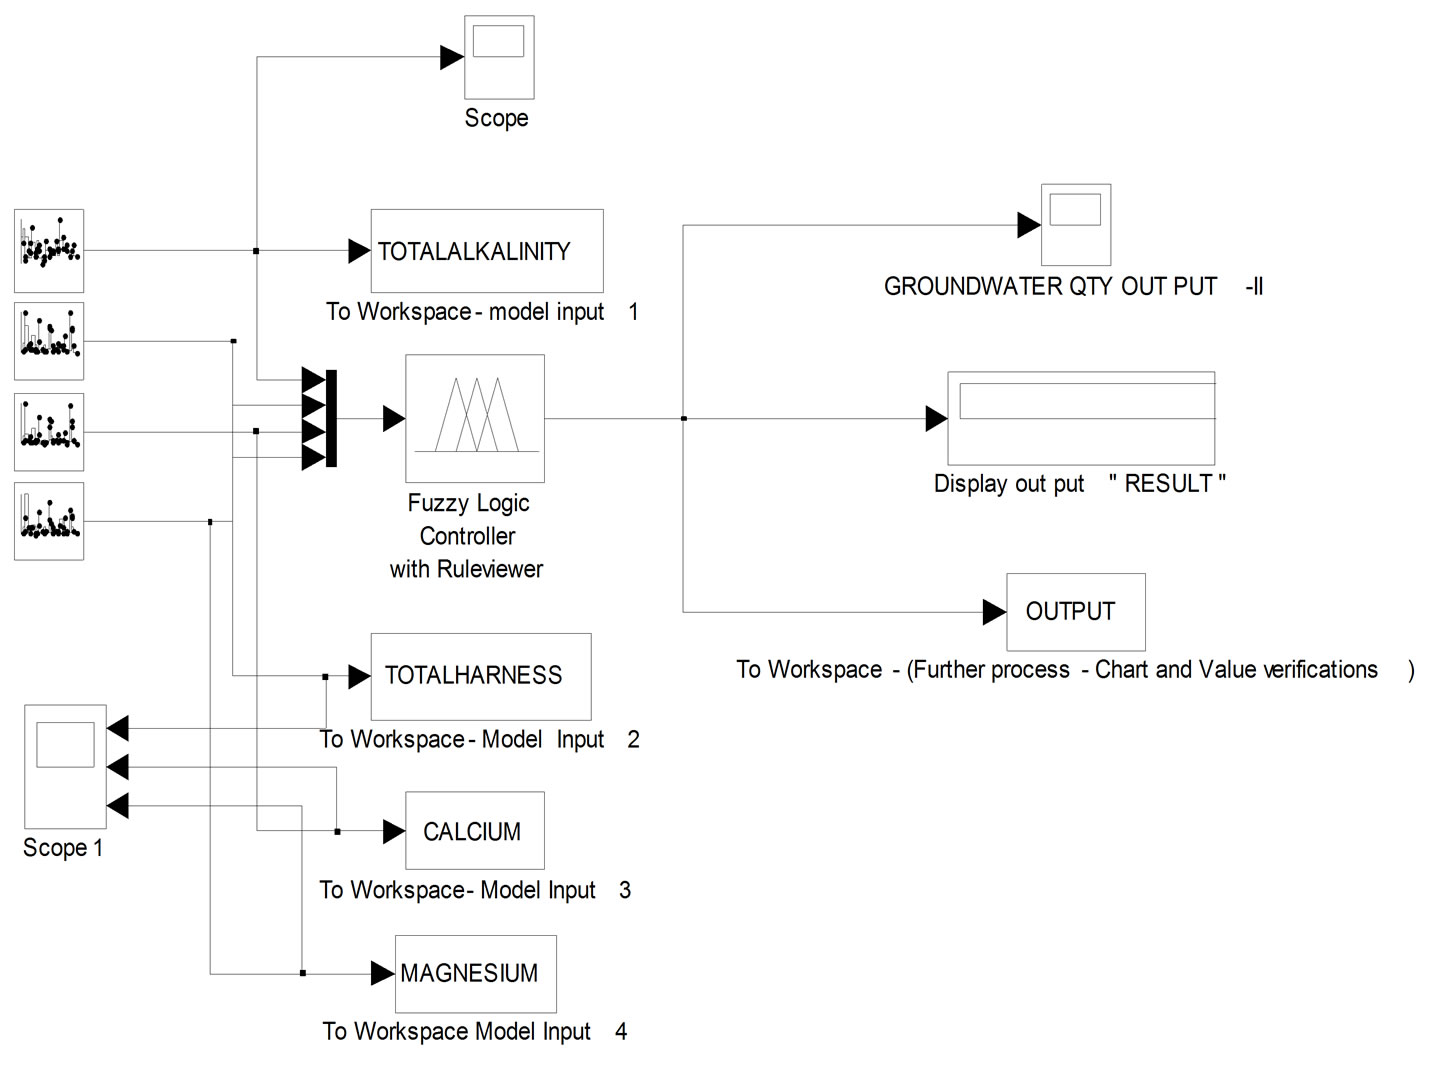
Figure 3. Block diagram for simulink process of FIP - Second group water quality parameters.
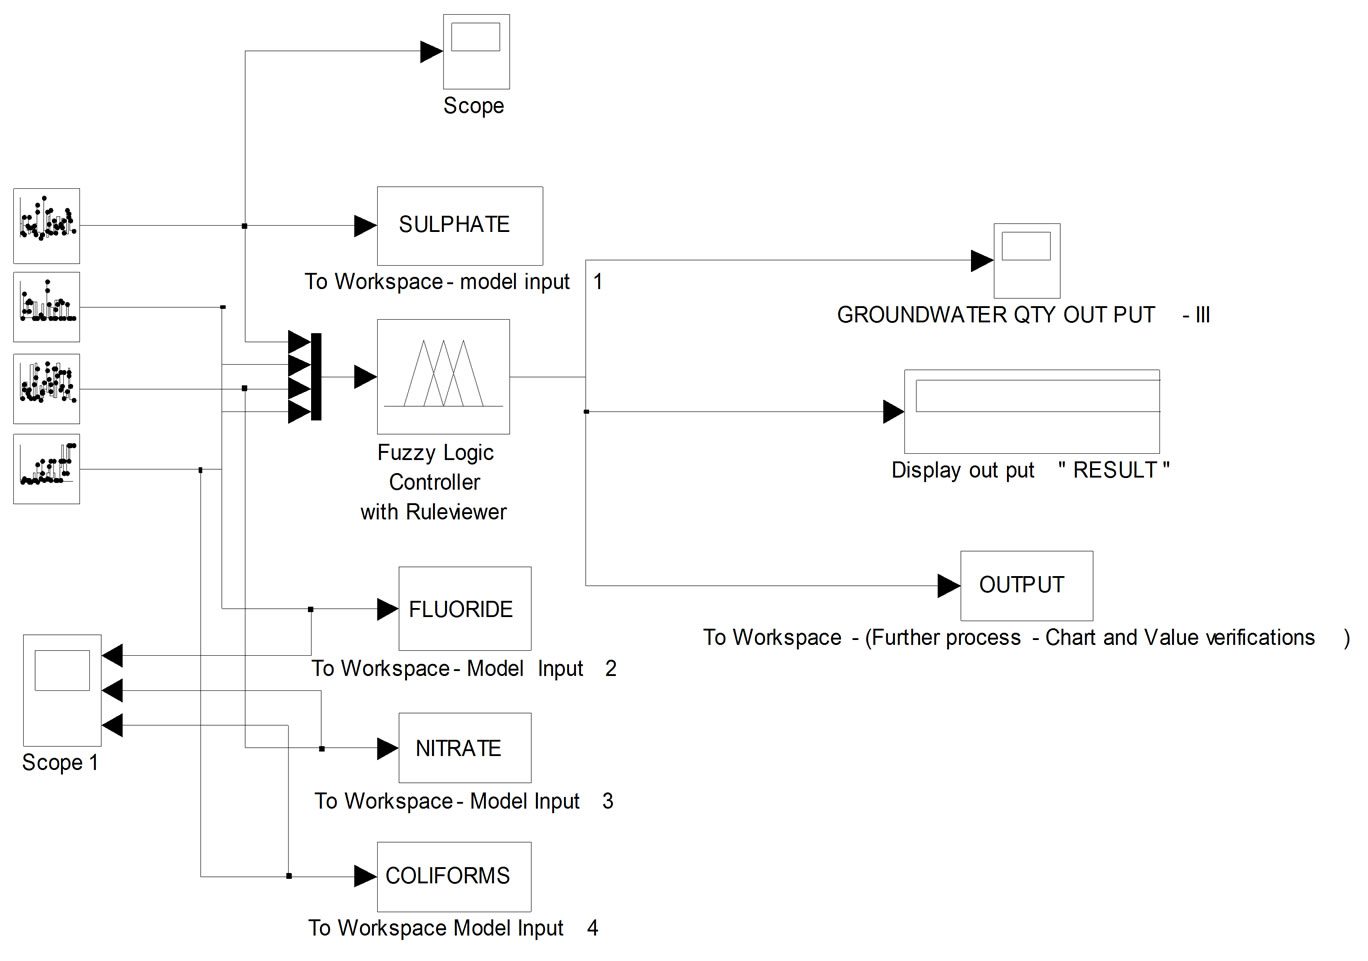
Figure 4. Block diagram showing simulink process of FIP - Third group water quality parameters.
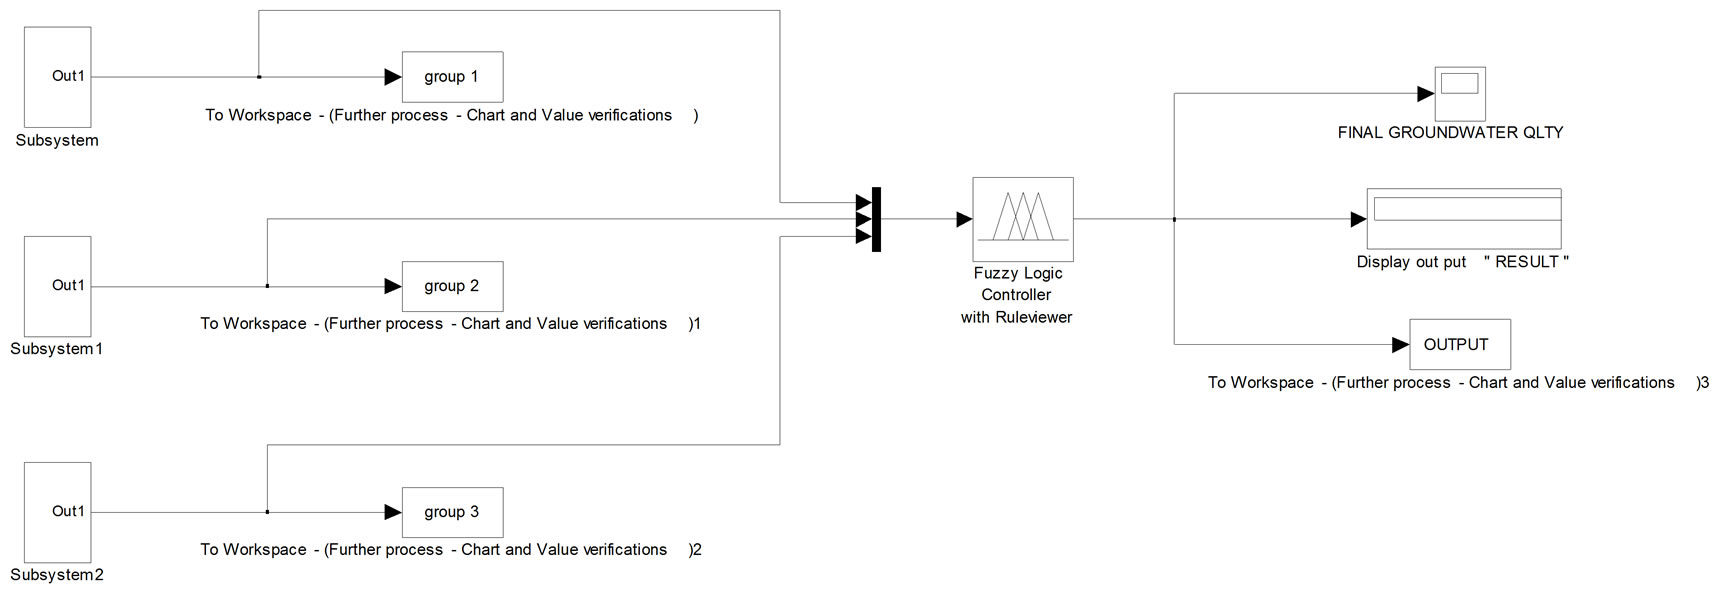
Figure 5. Block diagram for the fuzzy simulink process of FIP for water quality assessment.
water quality. The results from all the three groups are aggregated to assess the final classification of water as shown in block diagram Figure 5. The processes are applied to all the seasonal water samples and the results obtained are as shown in Figure 6.
The rule based decision on expert’s perception was fired using Mamdani implification of maximum and minimum operator [22]. To assess the drinking water quality of the groundwater samples, 181 rules are fired.
2.5. Approach towards Groundwater Quality Assessment for Potability
A fuzzy rule based system is generated in which users classify the water according to given data in Desirable, Acceptable, Not acceptable, Rejected quality with respect to different parameters, all connected using AND operator [23]. The user’s feedback is also taken with respect to overall quality for different parameters connected by AND operator. For example, one of the feedbacks taken may be like this, If TDS = good AND pH = medium and Sulphate = good then, overall water quality = High. After this, Delphi’s technique [20] is applied to converge the feedback of various users to a single value; a degree of match is computed between the user’s perception and field data for different parameters. For every type of water quality viz. good (Desirable) medium (Acceptable) or bad (Not Desirable). The water quality for which degree of match is the highest is considered to rerepresent the quality of the water sample.
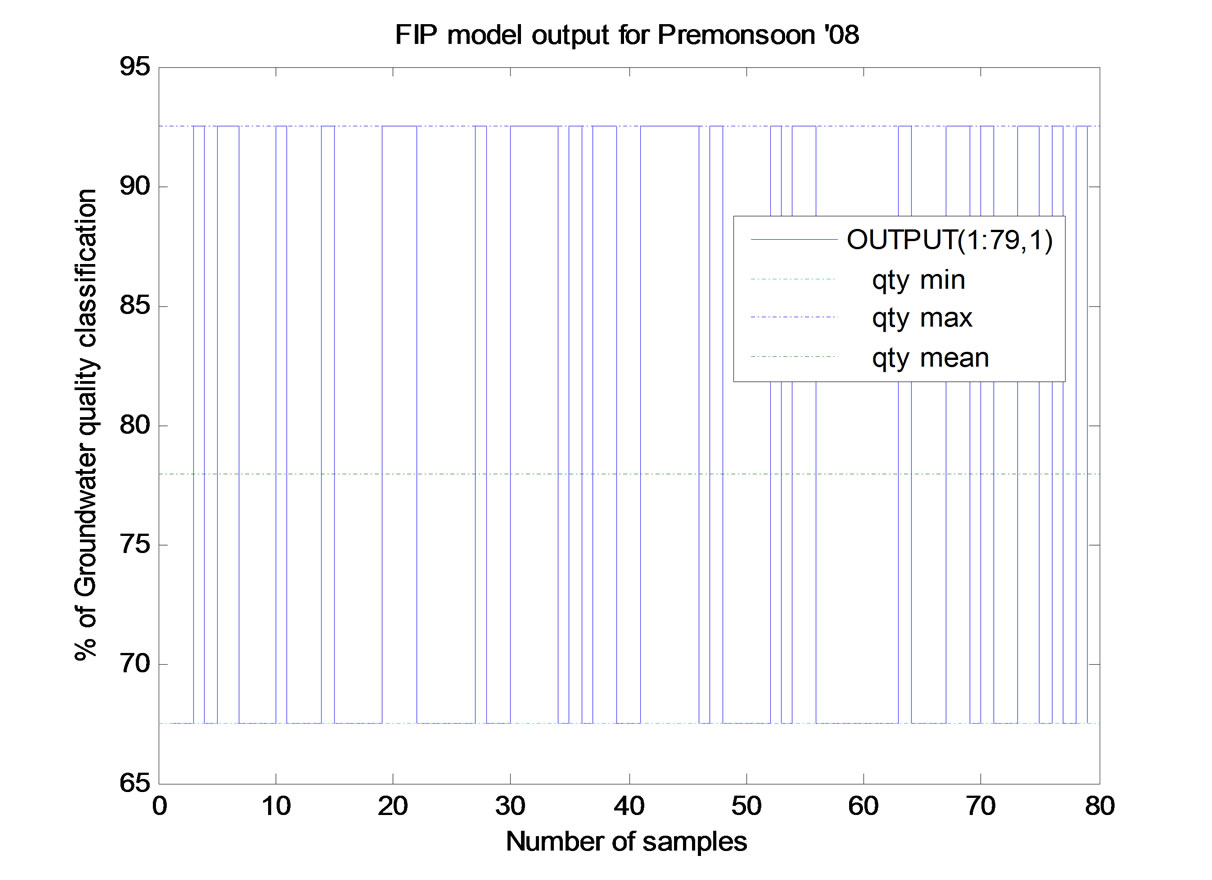
Figure 6. Subsurface water potable frequency showing Pre monsoon 2008.
3. Results and Discussions
Physio-chemical Groundwater quality assessment by deterministic method for drinking groundwater usage on the basis of 8 water quality parameters were compared with the concentration in the water with point value prescribed limits [21,23]. In case Groundwater quality model approach, these 8 parameters were divided in the four categories on the basis of expert opinion having their importance with respect to drinking water quality criteria.
The major findings of the research study are:
1) The accuracy of chemical analysis was verified by ionic balance errors and was found Minimal.
2)The hydro chemical analyses revealed that water samples in the study area was characterized by hard to very hard, fresh to brackish and alkaline in nature. The highly turbid water may cause health risk as excessive turbidity can protect pathogenic microorganisms from the effects of disinfectants and also stimulate the growth of bacteria during storage.
3) Characteristic by pH values, most of the water samples were alkaline in nature which are well within permissible limit (6.5 – 8.5) and some of the samples have been found acceptable for usage and the ranges are between 6.5 and 9.2 meeting BIS standards of IS: 10500: 1991 and WHO (2006) guidelines.
4) Based on Electrical Conductivity (Ec) values measured all water samples Zone-I (Srirangam) are desirable (< 1 mS/cm) for potability.
5) The microbial results indicated that all the samples exceeded the acceptable limit of drinking water. Presence of Salmonella and Shigella was also detected.
6) Although, the water samples contain significant concentrations of calcium, magnesium, sulphate, alkalinity (HCO3 + CO3) and potassium ions, predominant presence of two ions, sodium and chloride were found in the samples.
7) It was found that 60% of drinking water samples were found desirable for drinking purpose and the remaining samples could also acceptable for drinking in the absence of alternate water sources.
8) The groundwater quality assessment for potability using fuzzy logic controller has been estimated for Pre monsoon period (March to July) for the years 2006 to 2008. Potability indices show that the groundwater quality of bore well No. 25 of Zone–II (Ariyamangalam) was very low, as it is near to Municipal solid waste dumping yard. The lowest potability of 32.5% was found in bore well No. 73 of Zone–IV (K. Abisekapuram), located very near to sewer line and an open pond with stagnant water. The remaining bore wells in all the four zones records the potability between 67.5% and 92.5% and is illustrated in Figure 7.
9) The groundwater quality assessment for potability using fuzzy logic controller has been estimated for Post monsoon period (August to November) for the years 2006 and 2008. The potability of 32.5% for the bore well No. 59, 62, 63 and 73 of Zone–IV (K. Abisekapuram). The potability indices show that the groundwater qualities of these Bore wells were located very near to an open ponds and stagnant waste water during the rainy season. The remaining bore wells have the potability between 67.5% and 92.5% and are illustrated in Figure 8.
10) Digital Surface Model (DSM) diagrams were con-
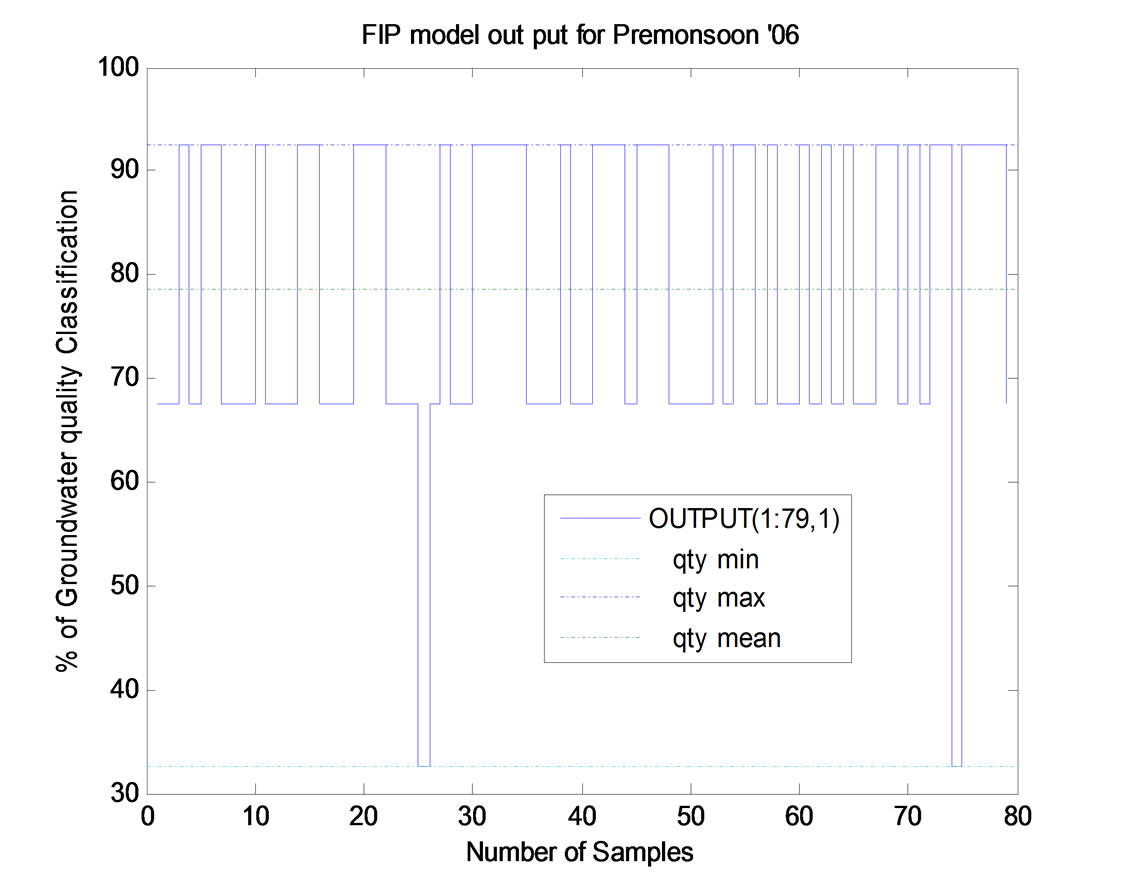
Figure 7. Subsurface water potable frequency during premonsoon periods 2006.
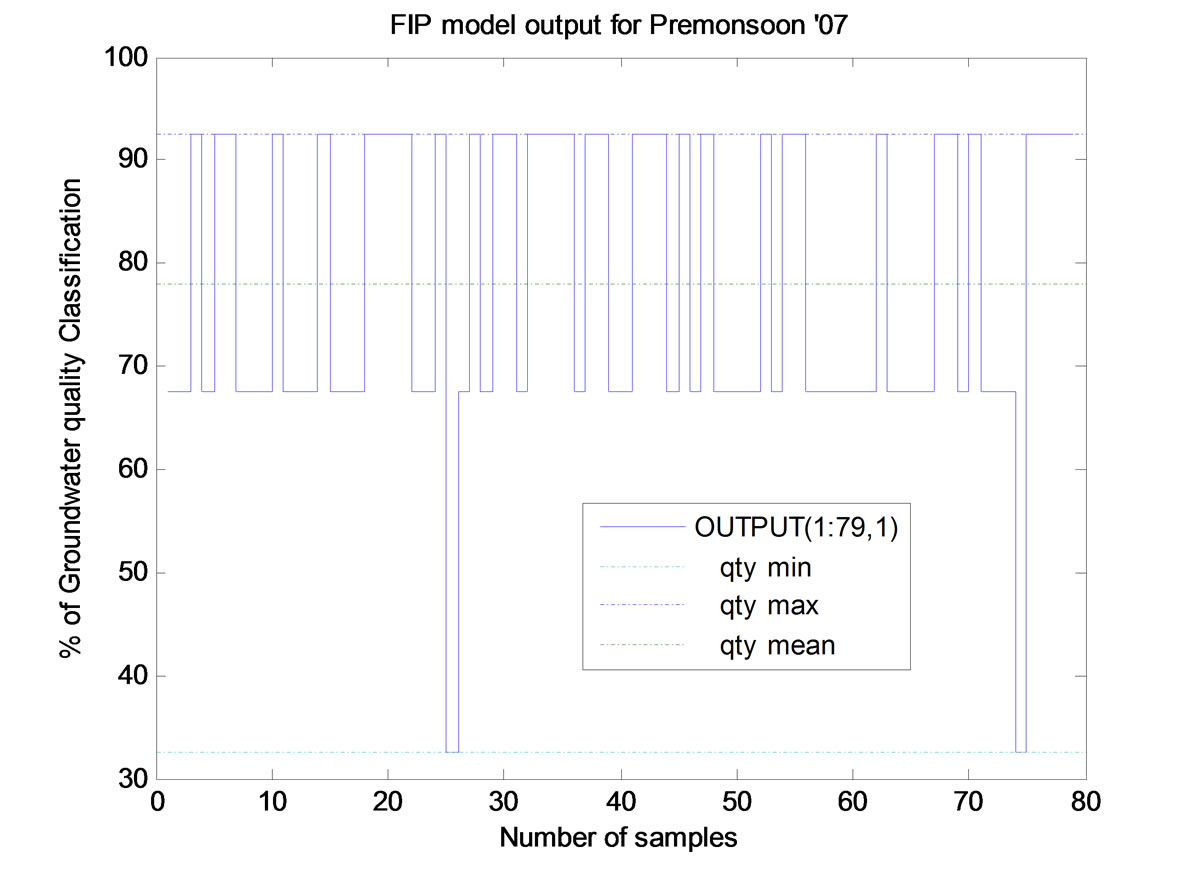
Figure 8. Subsurface water potable frequency during pre monsoon periods 2007.
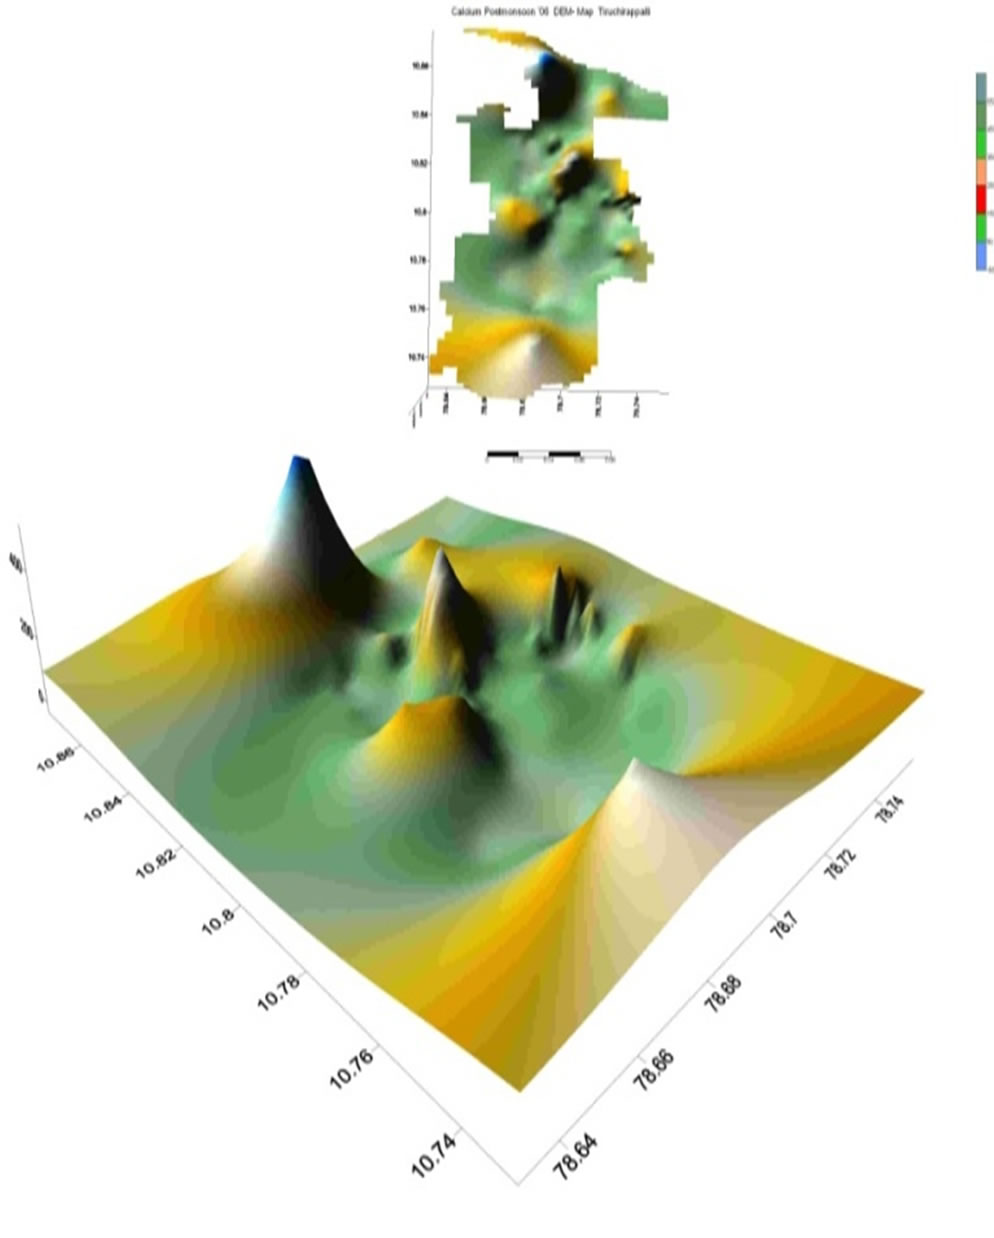
structed directly from major anions and cations, so as to consider common behaviors within the study area. A typical DSM concentration based on Cl- and HCO3- map is presented in Figure 9. There was high concentration in the Ariyamangalam zone makes the water non potable more than 50% of the sampled groundwater showed high chloride.
11) Pre-monsoon and post-monsoon contour potable water quality maps are constructed directly from major anions and cations from fuzzy Simulink model is shown in Figure 10. The contour maps of the equal concentrations based on standards is given in Figure 10.
The high risk was observed in the regions of Ariyamangalam zone consumption of ground water from the model during pre monsoon 2007. It was also noted that the market area and Ariyamangalam zone were the alarming zones of non potability regions during pre monsoon period 2006.
The high risks were noticed in some central parts of K. Abishekapuram towards Ariyamangalam due to the open pond and improper disposal of solid sluges.
 (a)
(a)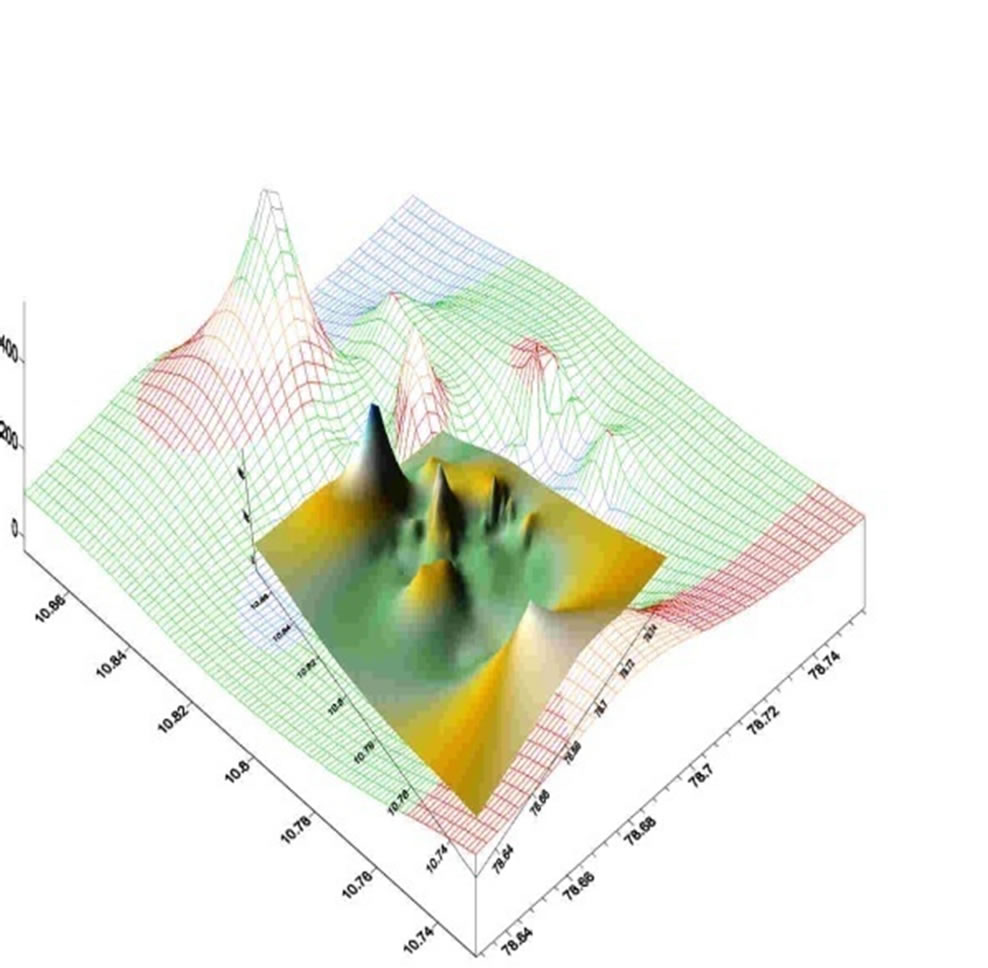 (b)
(b)
Figure 9. (a) DSM for chloride dispersion in Zone IV of Tiruchirappalli city; (b) DSM with Wire frame model for chloride dispersion in Zone IV of Tiruchirappalli city.
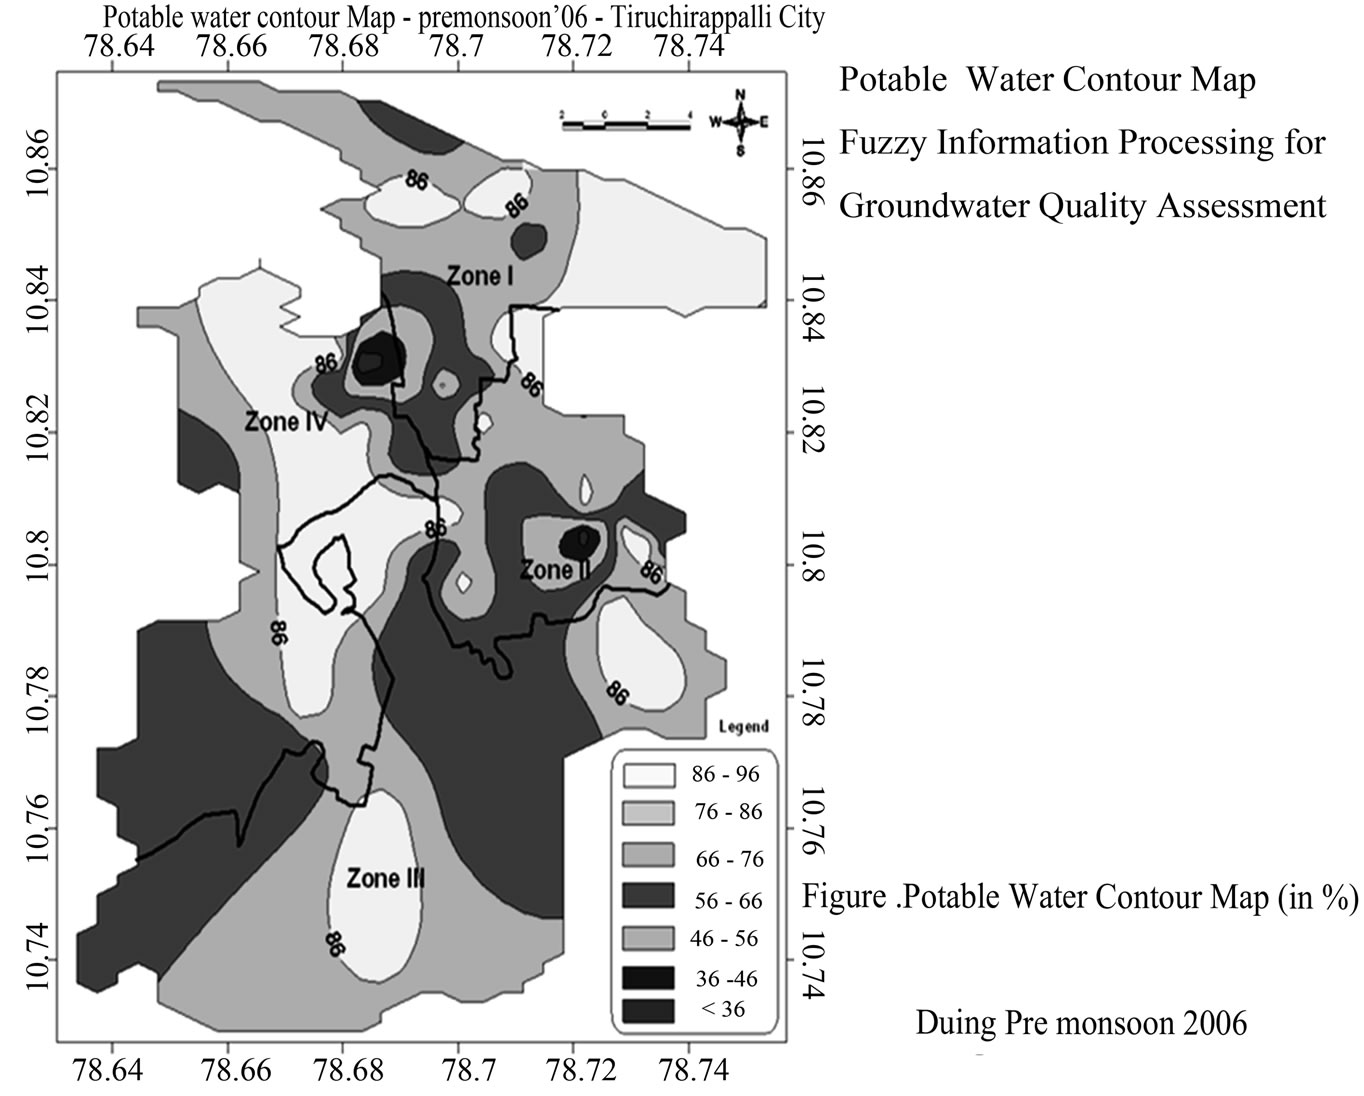
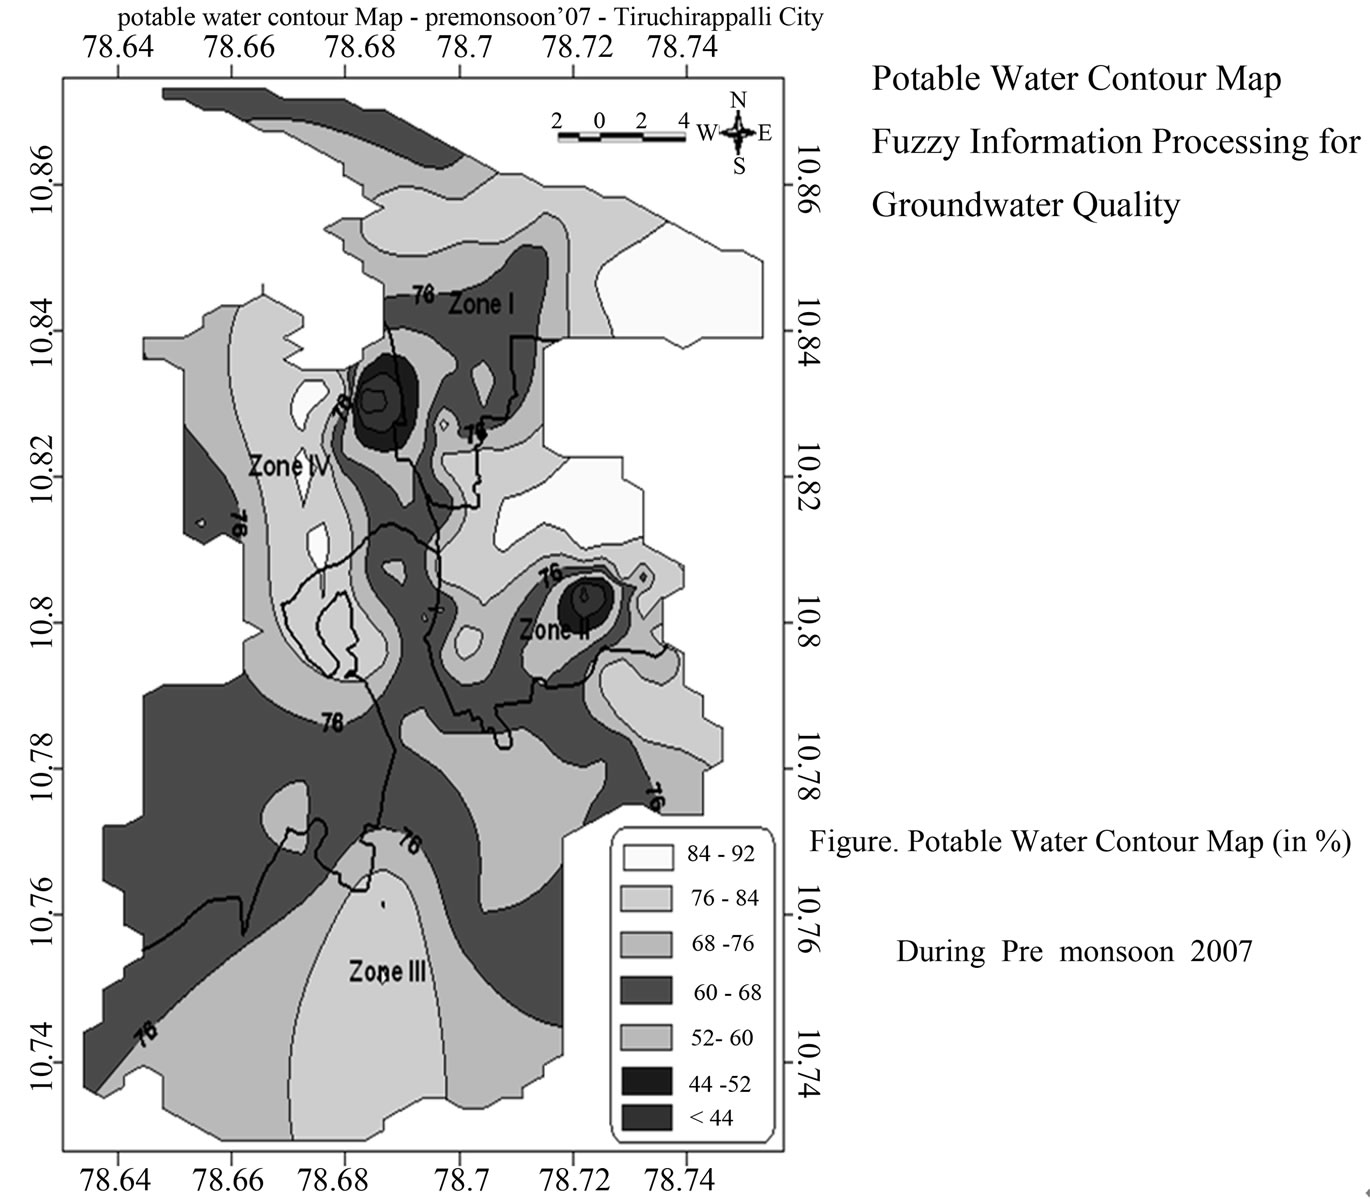
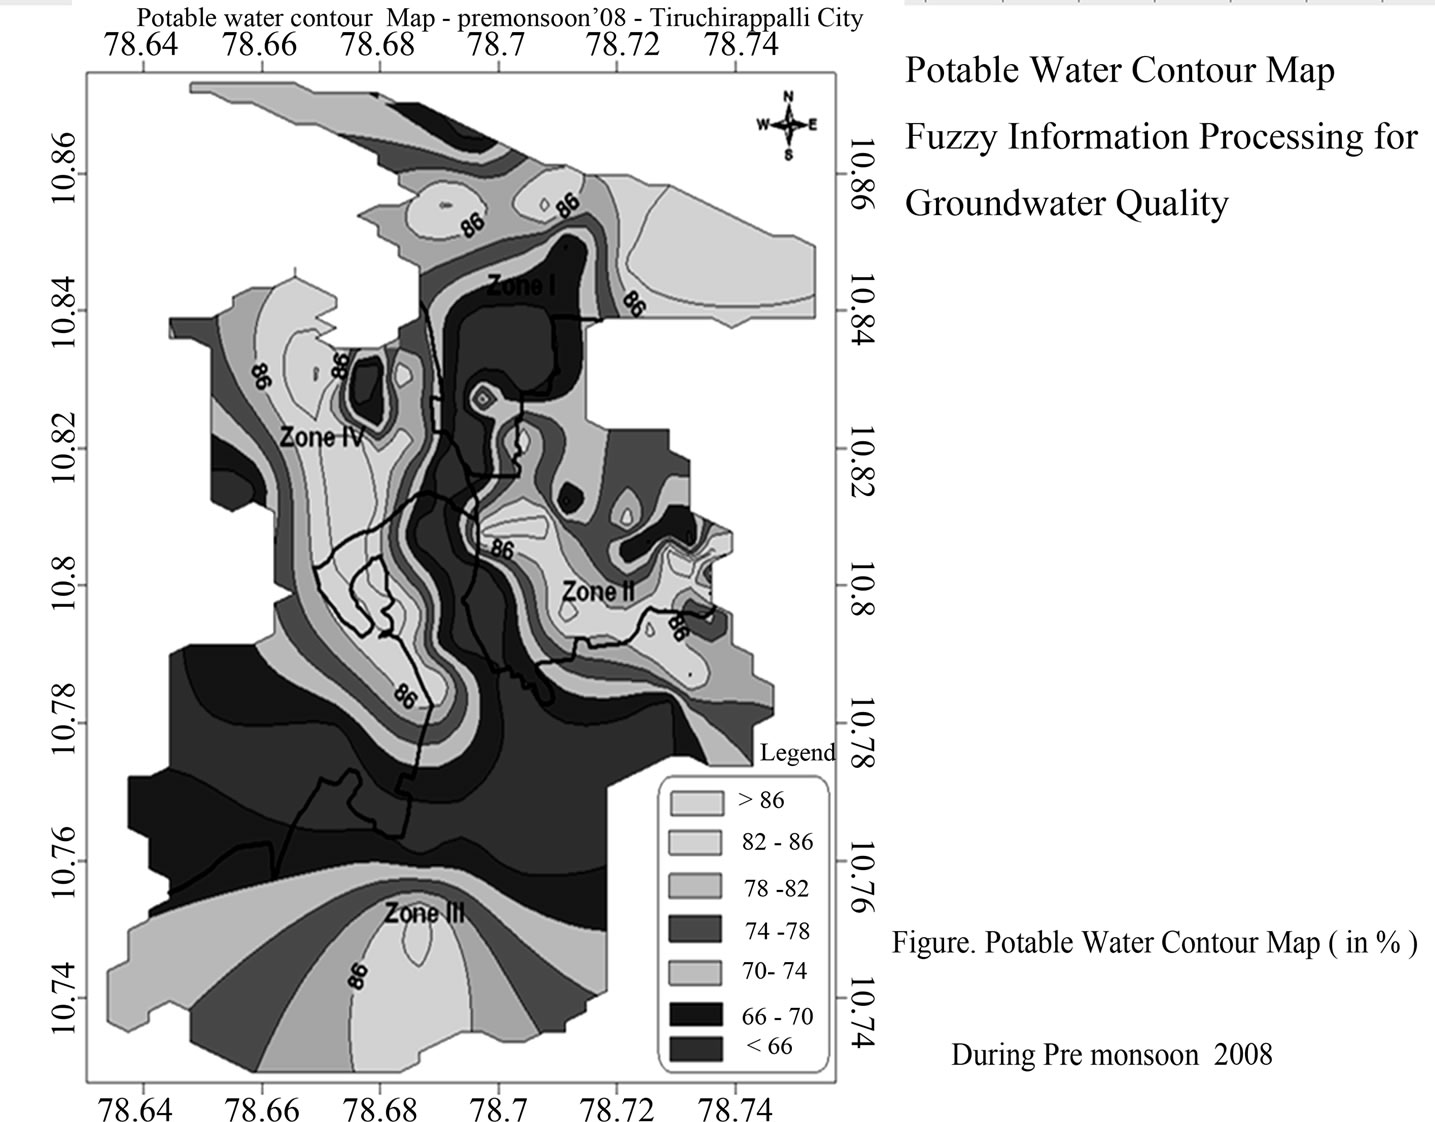
Figure 10. FIP potable water contour maps for pre monsoon 2006, 2007 and 2008.
4. Conclusions
The quality of the groundwater of the Tiruchirappalli city was monitored in 79 sampling wells for 3 years and major recorded data revealed that the concentrations of cations and anions were above the maximum, desirable for human consumption. The Electrical Conductivity was found to be the most significant parameter within input parameters used in the modeling. The developed model enabled well to test the data obtained from 79 samples of bore wells of Tiruchirappalli city.
• The groundwater in Tiruchirappalli meets all WHO drinking water standards with in the range of 67.5% to 92.5% for potable during pre monsoon condition of all the sampling durations.
• As the sampling station of 24 and 73 were found in non potable condition due to vicinity of wastewater discharging areas and solid waste dumping sites.
• During post monsoon all the sampling stations satisfies WHO [2] drinking water standards within in the range of 67.5% to 92.5%.
• At the stations 59, 62 and 72 were reported with non potablity of 32.5% due to unhealthy environmental conditions of wastewater and local waste dumps near by the sampling points.
• Solid wastes including sledges were disposed, and without any pre treatment before dumping and no protection towards the subsurface water for potability.
• In the previous study by the authors [13] the subsurface water quality in Ariyamangalam, Zone Tiruchirappalli City Corporation was seriously under threat by carbonates and sulphates near the sampling points of Ariyamangalam zone. Also contaminated by several pollutants as Ariyamangalam itself was currently polluted due to the waste dumping site and improper waste water vicinity.
• Without immediate response, the subsurface water is currently degrading its consumption quantity and will not be potable in near future if the proper steps have not been taken care.
5. Acknowledgements
The First author gratefully acknowledges the support by Fellowship under TEQIP, MHRD, and Govt. of India for his Doctoral study. The authors wish to express their sincere appreciation is also extended to the anonymous reviewers for their valuable comments to enhance the quality of this paper. Special thanks to Sarva Mangala Preveena for her constant support in preparation of this manuscript.
REFERENCES
- Bureau of Indian Standard, “Indian Standard Specification for Drinking Water,” BIS Publication No. IS (10501), New Delhi, 1991.
- World Health Organization, “Guidelines for Drinking Water Quality Recommendation,” Vol. 2, World Health Organization, Geneva, 2008.
- M. F. Dahab, Y. W. Lee and I. Bogardi, “A Rule Based Fuzzy-Set Approach to Risk Analysis of Nitrate Contaminated Groundwater,” Water Sciences Technology, Vol. 30, No. 7, 1994, pp. 45-52.
- B. Dixon, “Prediction of Groundwater Vulnerability Using an Integrated GIS Based Neuro-Fuzzy Techniques,” Journal of Spatial Hydrology, Vol. 4, No. 2, 2004, pp. 38-41.
- R. Khaiwal and V. K. Garg, “Distribution of Fluoride in Groundwater and its Suitability Assessment for Drinking Purposes,” International Journal of Environmental Health Research, Vol. 16, No. 2, 2006, pp. 163-166.
- K. Schulz and B. Howe, “Uncertainty and Sensitivity Analysis of Water Transport Modeling in a Layered Soil Profile Using Fuzzy Set Theory,” Journal of Hydroinformatics, Vol. 1, No. 2, 1999, pp. 127-138.
- B. Dixon, H. D. Scott, J. C. Dixon and K. F. Steele, “Prediction of Aquifer Vulnerability to Pesticides Using Fuzzy-Rule Based Models of the Regional Scale,” Physical Geography, Vol. 23, 2002, pp. 130-152.
- B. Dixon, “Application of Neuro-Fuzzy Techniques in Predicting Groundwater Vulnerability: A GIS Based Sensitivity Analysis,” Journal of Hydrology, Vol. 309, No. 1-4, 2005, pp. 17-38.
- S. M. Preveena, M. H. Abdullah, A. Z. Aris and K. Bidin, “Groundwater Solution Techniques: Environmental Applications,” Journal of Water Resource and Protection, Vol. 2, 2010, pp. 8-13.
- Z. K. Sen, “Fuzzy Groundwater Classification Rule Derivation from Quality Maps,” Water Quality Exposure Health, Vol. 1, No. 1, 2009, pp. 115-112.
- American Public Health Association, “Standard Method for Examination of Water and Waste Water,” 21st Edition, American Public Health Association, Washington, DC., 2005.
- B. Shomar, S. A. Fkher and Alfred Yahya, “Assessment of Groundwater Quality in the Gaza Strip, Palestine Using GIS Mapping,” Journal of Water Resource and Protection, Vol. 2, No. 2, 2010, pp. 93-104.
- V. Kumar, N. S. Mathew and G. Swaminathan, “Fuzzy Information Processing for as Assessment of Groundwater Quality,” International Journal of Soft Computing, Vol. 4, No. 1, 2009, pp. 1-9.
- Z. Chen, G. H. Huan and A. Chakma, “Hybrid FuzzyStochastic Modeling Approach for Assessing Environmental Risks at Contaminated Groundwater Systems,” Journal of Environmental Engineering, Vol. 129, 2003, pp. 79-88.
- S. Liou and S. A. L. Wang, “Generalized Water Quality Index for Taiwan,” Environmental Monitor Assessment, Vol. 9635-52, 2004.
- S. Liou and S. L. Lo, “A Fuzzy Index Model for Tropic Status Evolution of Reservoir Waters,” Water Research, Vol. 96, No. 1, 2004, pp. 35-52.
- L. A. Zadeh, “Fuzzy Set,” Information Control, Vol. 8, No. 3, 1965, pp. 338-353.
- L. A. Zadeh, ‘The Concept of a Linguistic Variable and its Application to Approximate Reasoning,” Information Science, Vol. 8, 1975, pp. 199-249.
- M. Jamshidi, “Tools for Intelligent Control: Fuzzy Controllers, Neural Networks and Genetic Algorithms,” Philosophical Transactions of the Royal Society, Vol. 361, No. 1809, 2003, pp. 1781-1808.
- C. Okoliand and S. D. Pawlowski, “The Delphi Method as a Research Tool an Example, Design Considerations and Applications,” Information and Management, Vol. 42, No. 1, 2004, pp. 15-29.
- V. K. Garg, S. Dahiya, A. Chaudhary and Deepshikha “Fluoride Distribution in Underground Waters of Jind District, Haryana, India,” Ecology Environmental Conservation, Vol. 4, No. 172, 1998, pp. 19-23
- E. M. Mamdani, “Advances in the Linguistic Synthesis of Fuzzy Controllers,” International Journal of Man-Machine Studies, Vol. 8, No. 6, 1976, pp. 669-678.
- N. Chang, H. W. Chen and S. K. King, “Identification of River Water Quality Using the Fuzzy Synthetic Evaluation Approach,” Journal Environmental Management, Vol. 63, 2001, pp. 293-305.
- C. O. Cude, “Water Quality Index: A Tool for Evaluation Water Quality Management Effectiveness,” Journal of the American Water Resources Association, Vol. 37, No. 1, 2001, pp. 125-137.