Journal of Geographic Information System
Vol. 4 No. 2 (2012) , Article ID: 18790 , 12 pages DOI:10.4236/jgis.2012.42023
Creation of a Geo-Spatial Database to Analyse Railways in Europe (1830-2010). A Historical GIS Approach
Department of Geography and Sociology, University of Lleida, Lleida, Spain
Email: mmorillas@geosoc.udl.cat
Received January 31, 2011; revised March 5, 2012; accepted March 16, 2012
Keywords: Railways; Historical GIS; Historical Geography; Europe
ABSTRACT
The GIS is a tool that allows us to study the logic of the distribution of phenomena that occur on the Earth’s surface. In this article, we propose exploring its potential for historical research over long periods. Here, we present a Historical GIS (HGIS) of the railways of Europe for the period 1830-2010. This is a response to the need to carry out spatialtemporal analyses in order to evaluate the territorial impact of the railway and its influence on the distribution of population. The main objectives of this work are: to publicise the existence of this spatial database; to explain the approach followed in order to produce it; and to highlight some of the results that have already been achieved by using it. To date, the possibilities offered by HGIS have hardly been explored in research into the territorial impact of the railway. Similarly, until now, little work has been done in this area at the European scale. The most innovative aspects of this HGIS therefore lie in the methodology used and the subject treated.
1. Introduction
The railway has played an important role in the territorial organisation of Europe as it has been one of the main engines behind its urban and economic growth and transformation [1]. This is evident from the inauguration of the first regular passenger and freight service between Liverpool and Manchester in 1830 until the emergence of mass car transport in the second half of the 20th century.
This article presents a Historical GIS (HGIS from here on) of Europe’s railways for the period 1830-2010. It also makes an important methodological contribution on two different levels. Firstly, it explains how this work was conducted, as this is an approach that could be adapted for similar studies in other parts of the world or for other types of transport infrastructure. Secondly, it explores the potential of our historical and georeferenced database.
We conceived the HGIS as a tool for analysing the impact of the railway network in Europe. The Old Continent is of particular interest as a case study because it was the first place where the railway network developed. In Europe, the industrialised countries took part in a race to develop their respective railway networks from 1830 onwards and also to invest in more peripheral countries. This overview is relevant, but this database can also be used for studies conducted at a more detailed scale—at the national level—as we shall see later.
Exploiting the potential of GIS offers the advantage that “...using these tools and techniques allows historians to re-examine radically the way that space is used in the discipline” [2]. HGIS offers a new analytical approach with an empirical base that complements the traditional way of undertaking descriptive studies. This methodology for analysing the railway network from a historical perspective has, until now, been little explored.
We shall now go on to discuss some other, earlier, studies and to establish our main lines of work. We shall then detail the sources consulted and their respective characteristics before explaining and justifying the approach employed to establish the database. We shall then show some of the results obtained with the analysis of these data, presenting them in the form of maps, graphs and tables. Finally, we shall identify future lines of research: how we can work with this information; which data can be crossed; and what results can be obtained.
2. The State of the Art
The creation of this HGIS was a response to the need to carry out several pieces of descriptive and quantitative research related to the evolution of railways in Europe. In essence, we wanted to give the spatial component the importance that it merits when analysing this infrastructure. In this section, we shall show how other authors have worked in this direction, although there is still a need for a historical database of socio-economic factors for the whole of Europe. This is an empirical task that calls for a good degree of organisation and Siebert [3] has provided a guide as to how this could be achieved.
The potential of GIS and its applications in different disciplines has been well documented in recent years. In research, it has not only been recognised as a tool for making descriptive maps, but also as providing a repository for storing socio-economic data about territory and a tool for analysing historical patterns and their spatiotemporal evolution [4,5]. The construction and impact of railways in Europe is one of several possible cases for study.
GIS is present in the management and analysis of present-day railway networks, but it is not so common for it to contemplate the historical component. Even so, there are initiatives for which geographical databases have been created in GIS that include historical data relating to railways. They have even been used to carry out a number of different socio-economic studies [6-11]. However, these databases only cover national territories and contained detailed information about railway infrastructure. There is therefore a need for a more comprehensive focus, at a continental scale, which should respond to rather generalist interests, as in the case treated in this article.
Of all the studies that have addressed the development of railways at the regional scale using HGIS, we should perhaps highlight those conducted by Loren Siebert and Jeremy Atack. Siebert [3] described a procedure for constructing a railway database for Kanto (Japan) with the objective of taking advantage of GIS to study the history of transport networks. Atack et al. [12] also developed a railway HGIS to analyse urbanisation and population growth in the American Midwest during the period 1850- 1860.
In the case of Europe, when we seek to analyse a national or regional area, we often find that complete and reliable data are available for our research but that they tend to focus on the peculiarities of each region or State. There is therefore a need for a historic database for the whole of European territory. Without one, the task of investigating socio-economic processes at the pan-European level, without limiting research to the national scale, will be complex [13,14].
To facilitate this process, the INSPIRE1 directive aims to create an infrastructure of spatial data for the whole European Union and to integrate geographic information from all the member states [15]. Within this framework, GISCO2 will offer a set of spatial data for the whole of Europe which will include: urban centres, transport networks, hydrography, relief, etc. These initiatives mainly aim to collect geographical data for the whole of Europe. Unfortunately, however, for the moment, the historical component still remains very underdeveloped.
The contribution that we present here follows this general line: it is a historical railway database that permits a quantitative analysis of the evolution and impact of the railway on the whole of Europe. However, to do this requires having a database that is homogenous and comparable across all the different European countries.
3. Sources of Information
Looking for historical data tends to be the slowest and most difficult part of any research process because documentation is often limited and difficult to find. To cover these limitations, it is necessary to look for and integrate various sources [4], though it should be added that this can also compromise the comparability of the results obtained. This is the case with historical data relating to railways, because there is no one single homogeneous series of documents that offers information about the evolution of the railway network for the whole of Europe for the period 1830-2010.
It is for this reason that we have devoted a separate section of this article to our sources of information. We first comment on the types of sources, separating them into written documents and maps. This classification is a response to the different formats that we must work with and which we shall subsequently explain. Finally, we shall mention and explain the main documents that were consulted in order to produce the railway database.
Written sources can generally be found in the historical archives of the different national railway companies and/or foundations. These are completed, with detailed information on the railway history of each country. There is, however, a lack of uniformity between these sources and this makes it difficult to undertake comparative studies of the evolution of the network for the whole of Europe.
Maps usually provide a snapshot of space at a particular moment in time, although some show the evolution of a specific subject. They tend to be complex as they synthesise a variety of information. In our case, however, we used thematic maps of railways as our preferred source as they highlight railway lines. Although these sources are often old editions aimed at tourists, these maps tend to be accurate and allow us to trace the historical evolution of the railway network. The first step is to establish the year of publication, the map scale, the categories of the lines shown and the criteria used to distinguish between them. Unfortunately, there is no single homogeneous railway map series for Europe for the period 1830-2010. We therefore selected the largest series available and filled in the information gaps with the help of national railway maps or more general thematic maps, such as atlases.
A georeferenced map with an overlaid vector layer of the Digital Chart of the World allows us to distinguish each railway line. Meanwhile, written documentation provide us with information about the year in which a particular line opened and/or closed and about the municipalities (or stations) of origin and destination. This is rather slow to consult, as cartographic support is required to cover the visual shortcomings, but the result obtained tends to be more complete and detailed.
There are several important cartographic sources where it is possible to find historical maps on which railway lines appear, including: the University of Cambridge Library, the British Library, the Bibliothèque Nationale of France and the National Library of Scotland.
The main sources of information that we used for this project were:
1) The Digital Chart of the World3, which is a vector data model at a scale of 1:1,000,000, which was created by the US Defense Mapping Agency (DMA) and published by the Environmental Systems Research Institute, Inc. (ESRI) in 1992. Amongst other features, this contains a layer with the railways in Europe. From it, we took the spatial component of the railways, including the layout of the railway lines of Europe, with the exception of Great Britain.
2) The Railways of Great Britain, a Historical Atlas [17] is a railway atlas of Great Britain published in two volumes: a first, on England and Wales, and a second on Scotland. The author, Michael H. Cobb, affirms that “the purpose of this Atlas is to show all the railway lines in Great Britain opened to traffic between 1807 and 1994 annotated with historical detail” [17]. The map scale is one inch to one mile, so these maps are both detailed and precise. From this source it was not only possible to obtain the spatial component: the layout of the lines and the location of the stations, but also the years in which they opened and closed.
3) Thomas Cook publishing offers a series of railway maps for Europe in which each map shows the lines recommended to tourists visiting Europe at the time when each edition was published. Although this series was originally aimed at tourists, it is a data source to seriously consider when researching railway history. The maps published before the 1970s have the inconvenience of being schematic. However, from the 1978 onwards, they became more complete and also included information relating to the type of line (e.g. narrow gauge, main line, high-speed line, etc.).
4) John Bartholomew and Son is a publishing company that was acquired by Harper-Collins. Since its foundation in 1826, it published numerous different theme-orientated atlases and maps of Europe. This publishing company gained prestige through its links with the Royal Scottish Geographical Society [18].
5) The Historie Chronologique des Chemins de Fer Europeens4 website contains maps of Europe’s railways for each year from 1834 through to 1939. This website shows the railway lines for the whole of Europe (with the exception of narrow gauge lines), on a year by year basis, over a period of more than 100 years. However, in some areas, it was necessary to check that all the information provided corresponded to reality.
6) To complete the database and fill in some of the information gaps that were not resolved with earlier material, we also consulted other national-level information sources. These are often provided by the work of research groups or national railway foundations. We also consulted national and international atlases that included complementary information about railway networks.
4. Methodology
The development of the railway database passed through the following phases: 1) the search for and evaluation of the information sources; 2) the reconstruction of the evolution of the European railway network from selected documents; and 3) the correction of topological errors. These different phases are detailed below.
The search for sources of information showed that there are differences in the availability of information between the territory corresponding to Great Britain and the rest of Europe; as a result, we decided to use different methodologies for these two cases. For Great Britain, there is a source that offers complete information from which it was possible to extract both the layout of the lines and the years in which they opened, and in some cases closed. We also obtained the locations of stations and their years of opening and closure. These data were not, however, available for the rest of the Continent. For the other countries of Europe, we included various sources of information, but it was not possible to obtain the same level of detail as we could not always find information about the year of opening and closure of each stretch of line.
One feasible way to achieve our database was to organise the historical series in homogenous time intervals; in this case, we used intervals of ten years. We established this time interval, with base years ending in 0, as it was necessary to relate our railway data to population data at both the municipal and regional scales. The interval was set at ten year intervals to coincide with national census data, which were the main sources of the information used. In the majority of countries, official population censuses are carried out at ten-year intervals, with the base references corresponding to years ending in 05; this is why we decided to use this interval and base reference.
The phase of reconstructing the evolution of the European railway network (except Great Britain) was based on the Digital Chart of the World. By consulting historical cartography and other documents, we identified which lines were in service on 1st January in years ending in 0 (1830, 1840, 1850...). However, although it is normally relatively accurate, this documentation does not generally refer to very precise data.
Figure 1 is an example of this process. The lines of the vector layer of the Digital Chart of the World (DCW) have been overlaid on the 2001 edition of the Thomas Cook railway map, after previous georeferencing. The green lines are the DCW lines that correspond to railway lines in service in 2000, while the red ones show those that were not operative in 2000.
In contrast, the Railways of Great Britain atlas [17] allowed us to carry out a more detailed analysis for Britain. It is unique in its genre as it provides the location and year of opening and closure of the different stretches of the British network and also of its stations. Furthermore, georeferencing the maps produced a low RMS6, which was always less than 0.2 mm, thanks to the availability of images in raster format without any deformations.
The railway lines of Great Britain were head-up digitalised with a computer mouse. The database fields were then edited using the information gathered from the same atlas.
Figure 2 shows an example of a fragment taken from the atlas [17]. This was used to obtain an optimum level of detail that it would be desirable to obtain for the whole of Europe.
The data produced for Great Britain are very precise and allow us to conduct detailed studies, but they must be simplified and homogenised with other data for Europe when undertaking combined analyses.
The next phase involved the correction of the topological errors which arise from the way in which spatial features were subsequently connected to each other [19].
The topological rules that were applied in order to correct the topological errors were as follows: lines cannot overlap (duplication of lines); railway lines must lie within European borders. This last condition requires a polygonal vector layer for borders.
It would also be ideal to conduct a validation to make sure that all the open stations are physically located on a
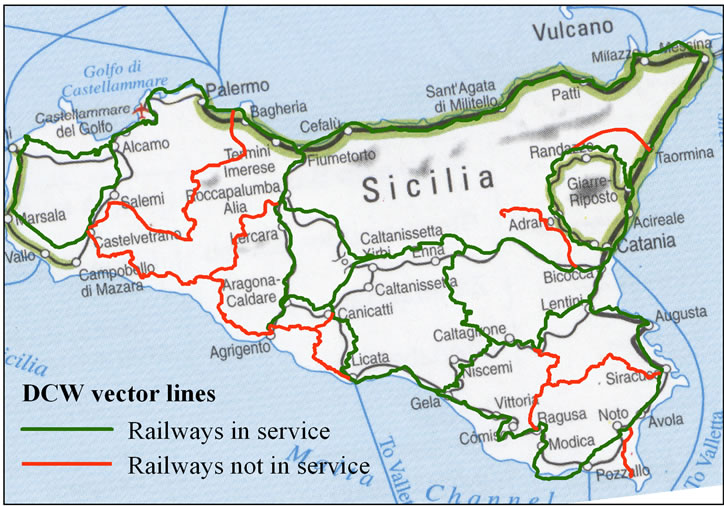
Figure 1. Example of the railways of Sicily in 2000.
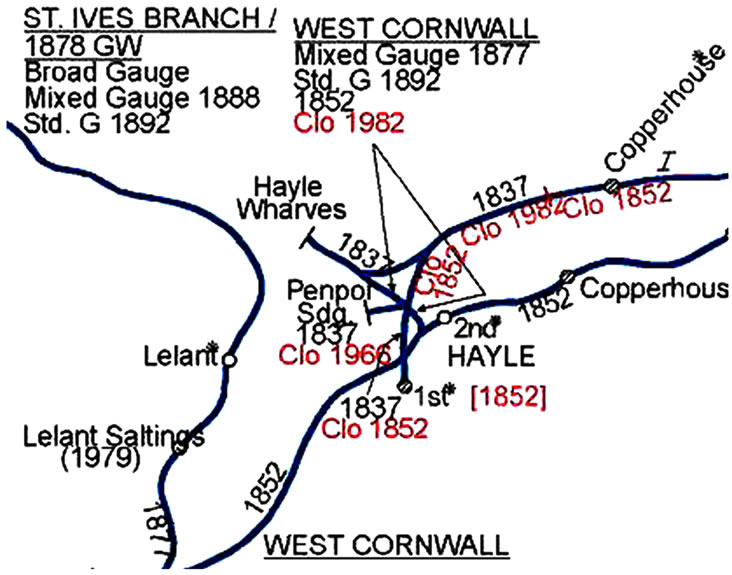
Figure 2. Atlas of the railways of Great Britain [17].
railway line in service. However, we do not have complete information concerning the locations of all the (open or closed) stations in Europe. It has therefore only been possible to carry out this operation for Britain.
The result is a vector layer of railways that contains all the main and high-speed lines. The database consists of a field for every year ending in zero, from 1830 to 2010, that provides information about whether lines were or were not in service. In the case of railway lines located in Great Britain, this database also contains information about the year of line opening and closure.
The main lines in Europe are of standard gauge (1435 mm), with those of Ireland (1600 mm), the Iberian Peninsula (1668 mm) and Finland and the Baltic Republics (1524 mm) being special cases. High-speed lines are of recent construction and for rapid transport (with commercial speeds of over 250 km/h). Narrow gauge, tourist and freight lines have been omitted because the aim was to focus on the basic passenger transport network and to leave aside lines of a more local nature. Furthermore, it was not feasible to include all of the narrow gauge railway lines in a study undertaken at the continental scale.
This railway vector layer is accompanied by another showing the railway stations of Great Britain. The database includes some fields which show the year of opening and closure of the different stations.
The geographic coordinate system of the final data is European Terrestrial Reference System 1989. This has been the recommended reference system for data on Europe of the International Association of Geodesy Reference Frame Sub Commission for Europe since 1990 [20].
5. Results and Lines of Work Currently Underway
This database does not only allow us to produce material in map, graph and table formats, but also to carry out territorial analysis when it is combined with other layers of information such as population at the municipal level. Some of the descriptive and analytical results that we have obtained are presented in this section. First, there is a cartographic representation of the railway lines that opened, closed and were in service during the periods: 1850-1890, 1890-1930, 1930-1970 and 1970-2010 (Figures 3 and 4). These periods were chosen because they are homogeneous, all covering 40-year intervals. Even so, a detailed analysis of the evolution of the railway network allows us to establish periods based on the specific characteristics of each period: large-scale opening of lines; consolidation and network stability; line closure; and construction of high-speed lines. These phases are evident in Figure 5, a graph that quantifies the total number of kilometres of track in use in Europe from 1850 to 2010.
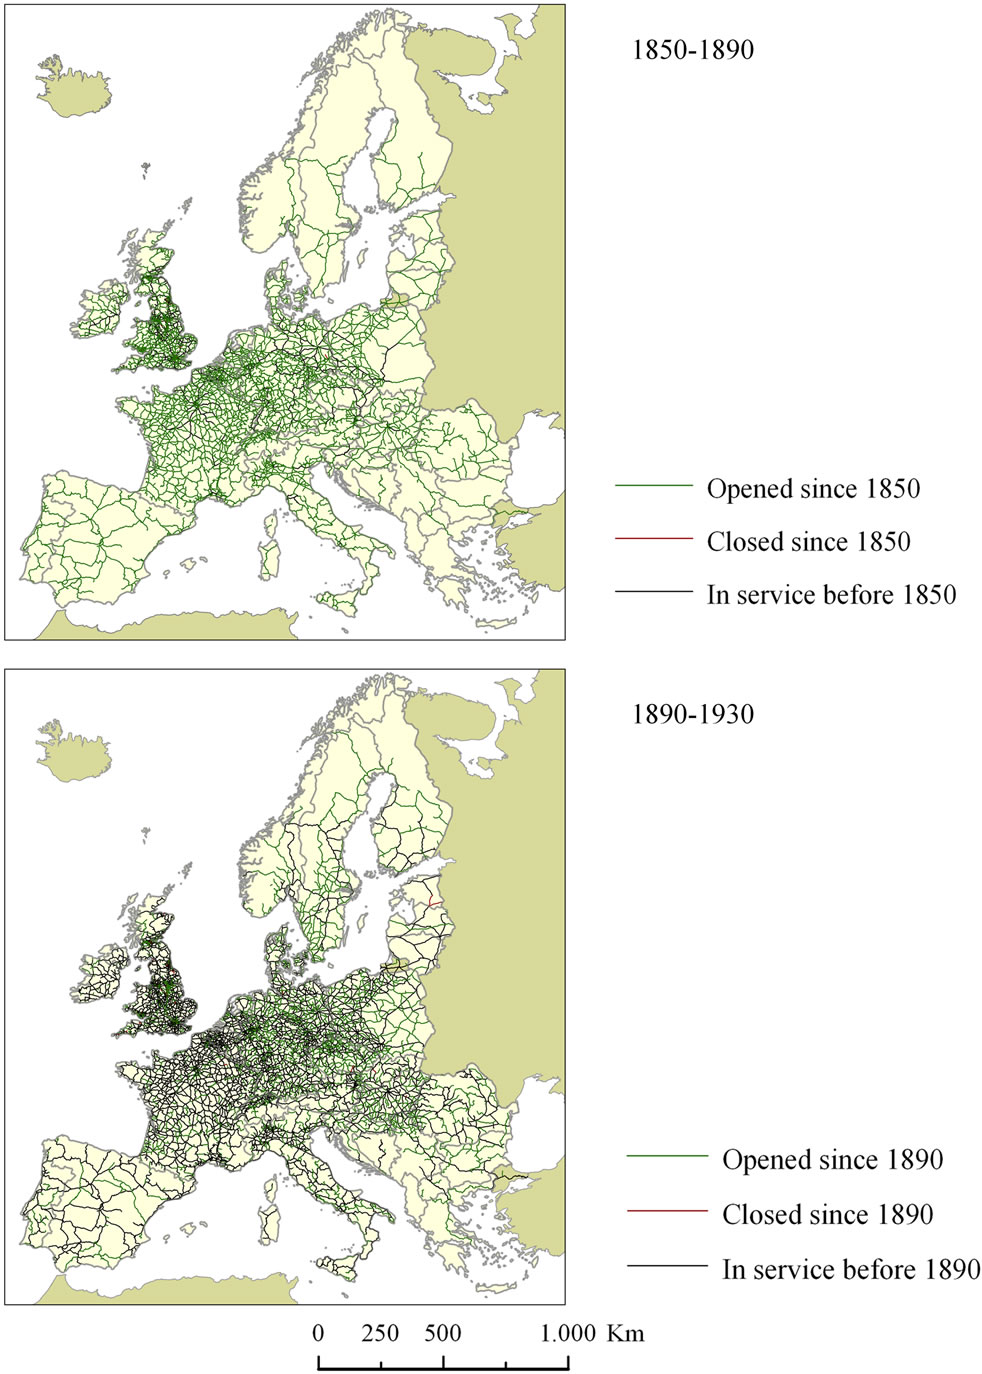
Figure 3. Railway maps of Europe: 1850-1890 and 1890-1930.
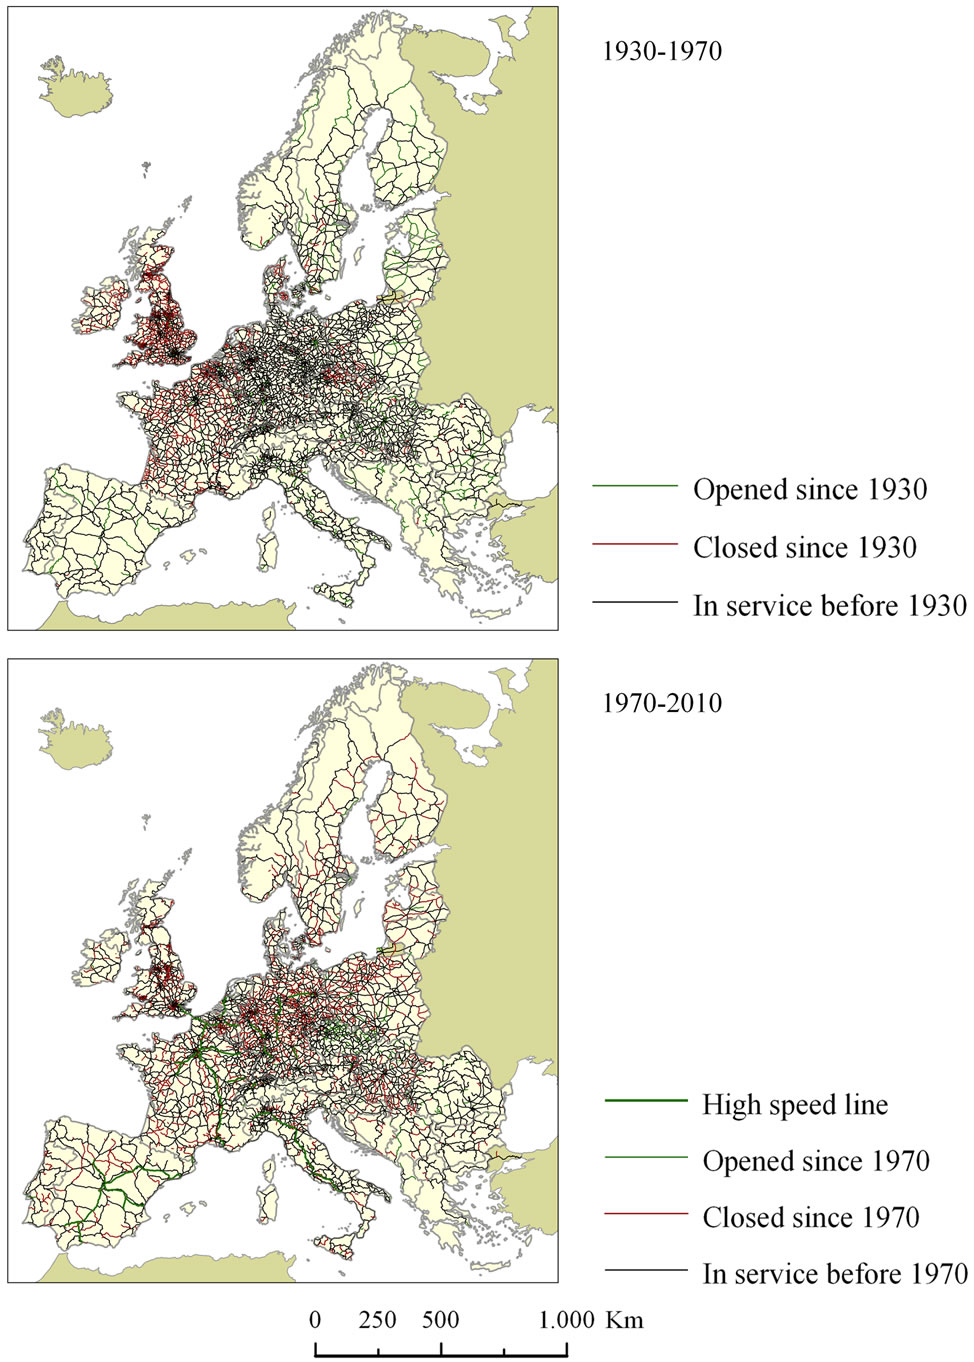
Figure 4. Railway maps of Europe: 1930-1970 and 1970-2010.
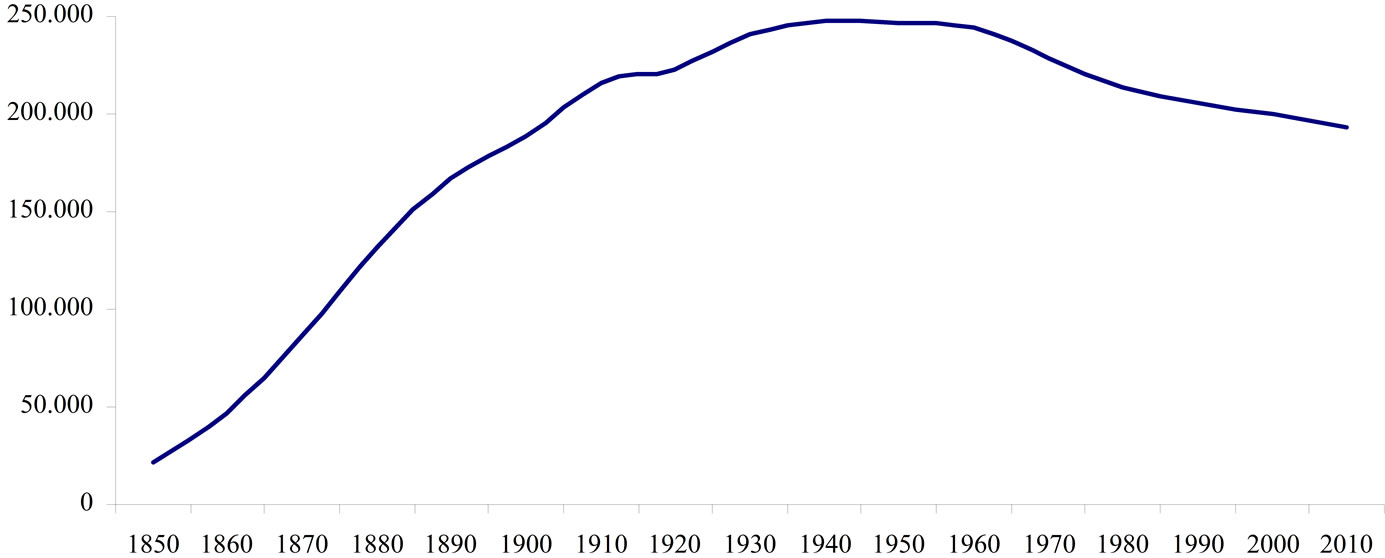
Figure 5. Kilometres of railway line in Europe: 1850-2010.
The subsequent figures show the wide range of scales at which these data can be analysed: continental, regional, local, etc., (Figure 6), and that it is possible to combine them with historical borders (Figure 7).
Finally, we present two examples of analysis. The first shows the relevance of relief when it comes to establishing a railway network in a given territory (Figure 8). The main focus of the following example is the evolution of the population with access to the railway network in Spain between 1850 and 2000. Figure 9 shows a map of the agglomerations that had access to the railway network in 1970 and those that lost such access during the period 1970-2000. Table 1 shows the percentage of Spain’s municipalities with access to rail connections and also the percentage of the national population that they represented, in each year ending in 0, for the period 1850-2000.
The section concludes with the future lines of work that will provide the railway database with more information, which will allow us to conduct more detailed analyses.
The information presented in these maps can also be shown in the form of a graph, although this then loses the geographical view of the spatial distribution of disparities in the railway system. It does, however, provide a much clearer vision of the stages of railway evolution for the whole of Europe: opening of new lines; consolidation and network stability; closure of lines; and the construction of high-speed lines. Figure 5 shows the kilometres of track in service in Europe between 1850 and 2010.
On the other hand, Figure 6 provides an example of three maps, at three different scales, that were produced using this database.
Adding the international borders that existed during each historical period allows us to study the importance that each state has given to its railway infrastructure over time. However, as in the case of railways, borders may change over time; for this reason, it is also necessary to have a layer of historical borders, as shown in Figure 7.
One type of study that derives from HGIS analysis seeks to compare rates of population growth at the local level, distinguishing between municipalities with and without railway connections. This line of research was first undertaken by Schwartz, Gregory and Martí-Henneberg (2011) [21], who presented an analytical approach focusing on the relationship between population change at the civil parish level and the presence of railways, based on the example of Wales. Amongst their work, it is possible to find the following image (figure 8), which shows how railway lines were generally constructed in the flattest and most low-lying areas.
A second analytical example combines railway data with that of population for urban agglomerations in Spain. Municipalities expand to form an urban continuum that stretches out beyond their administrative boundaries [22], until they come to constitute supra-municipal entities, called urban agglomerations. Given the lack of information regarding railway stations, it was assumed that agglomerations that were located two kilometres, or less, from a railway line were connected to the railway network.
In this study, the Accumulated Annual Growth Rates (AAGR) of the agglomerations that had railway connections were compared with those of agglomerations that did not. The results obtained showed that during the first half of the 20th century, railway access had a positive effect on the growth of municipalities with fewer than
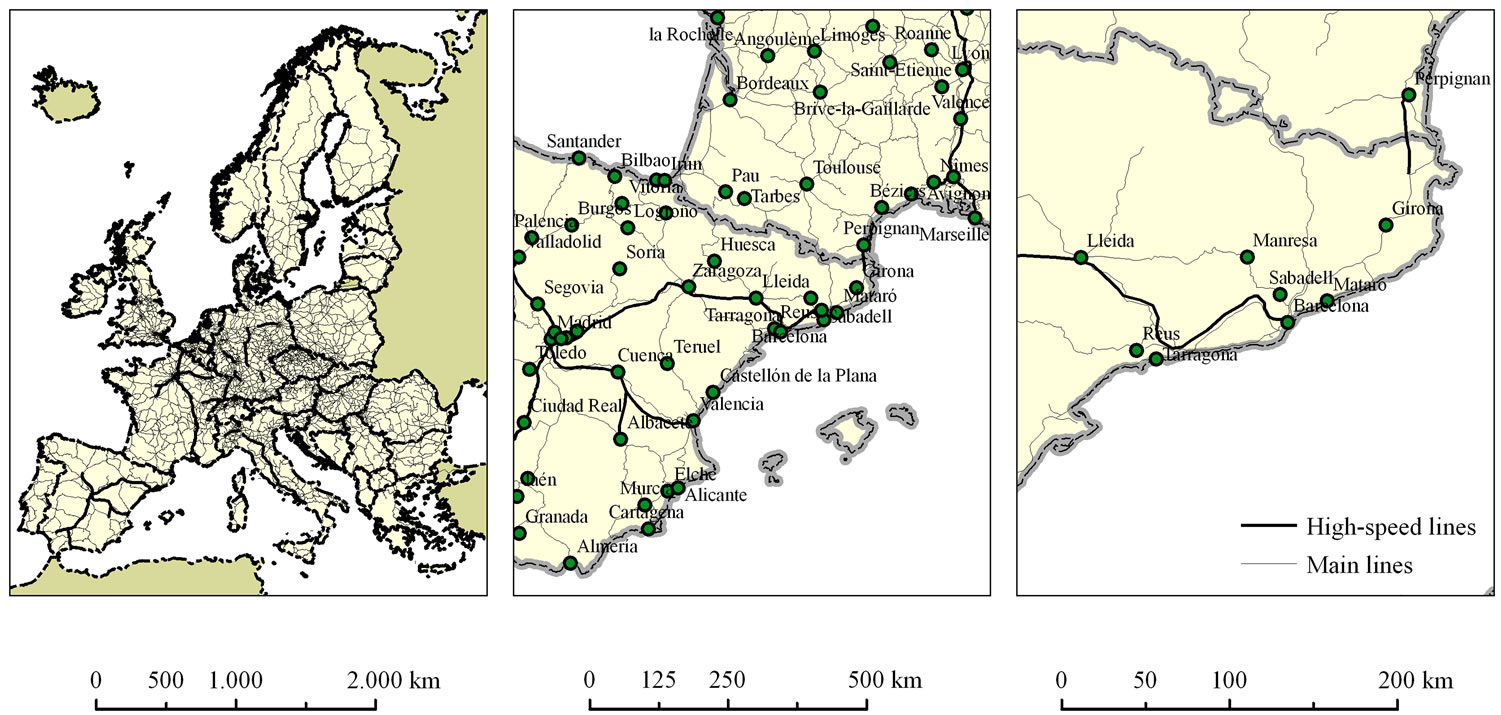
Figure 6. Three geographical scales of analysis.
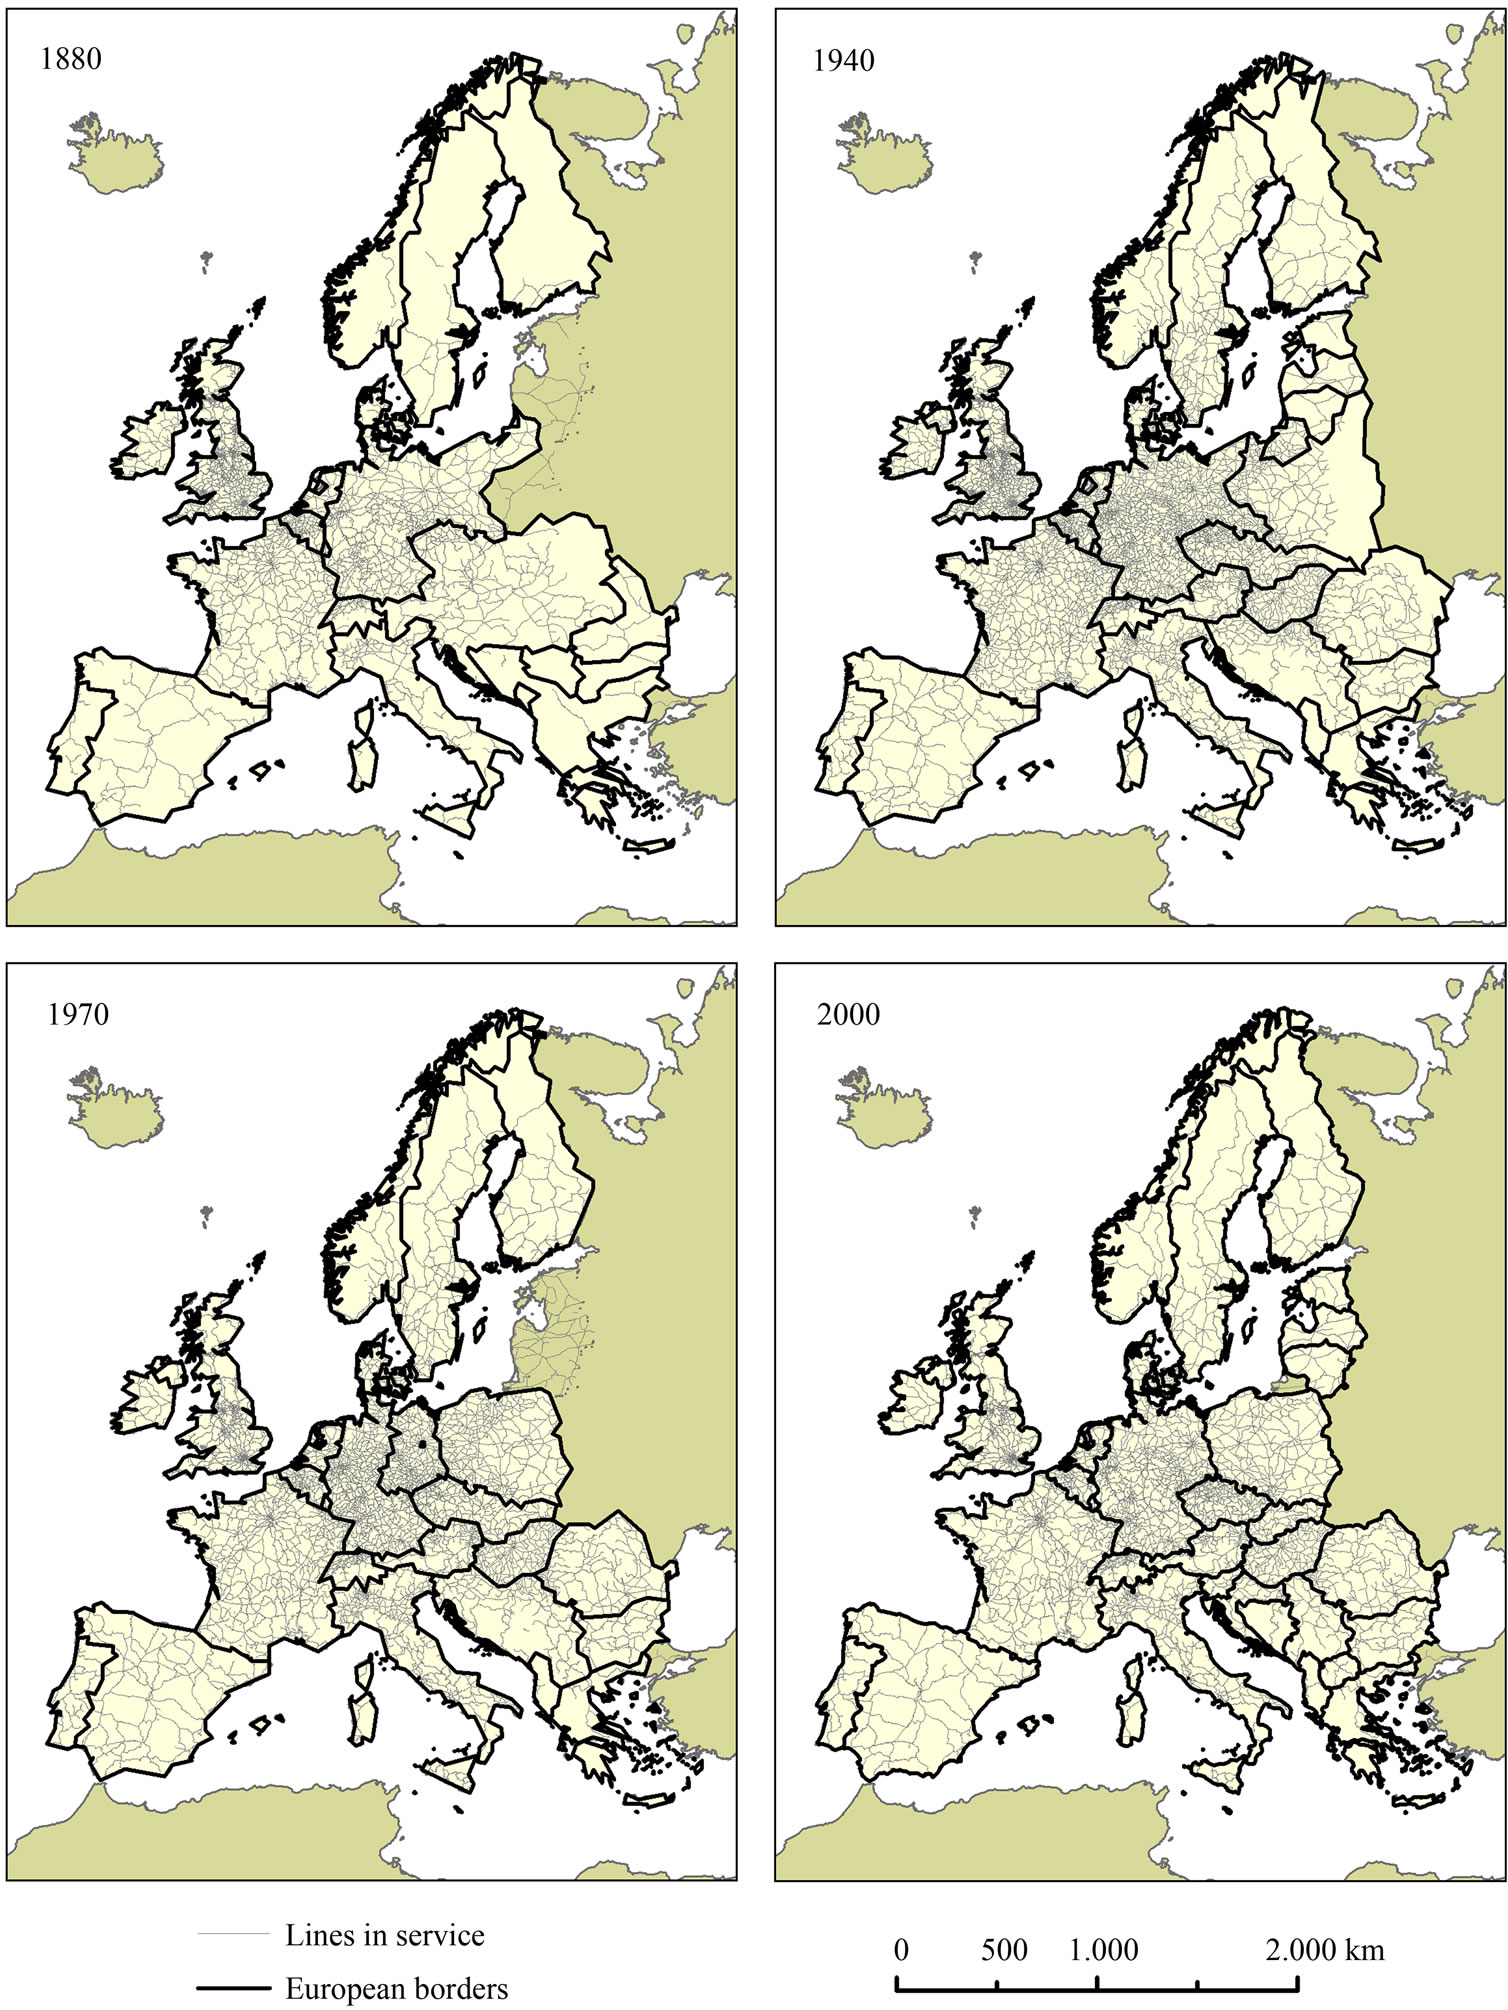
Figure 7. Railways and historical borders in Europe: 1880, 1940, 1970 and 2000.
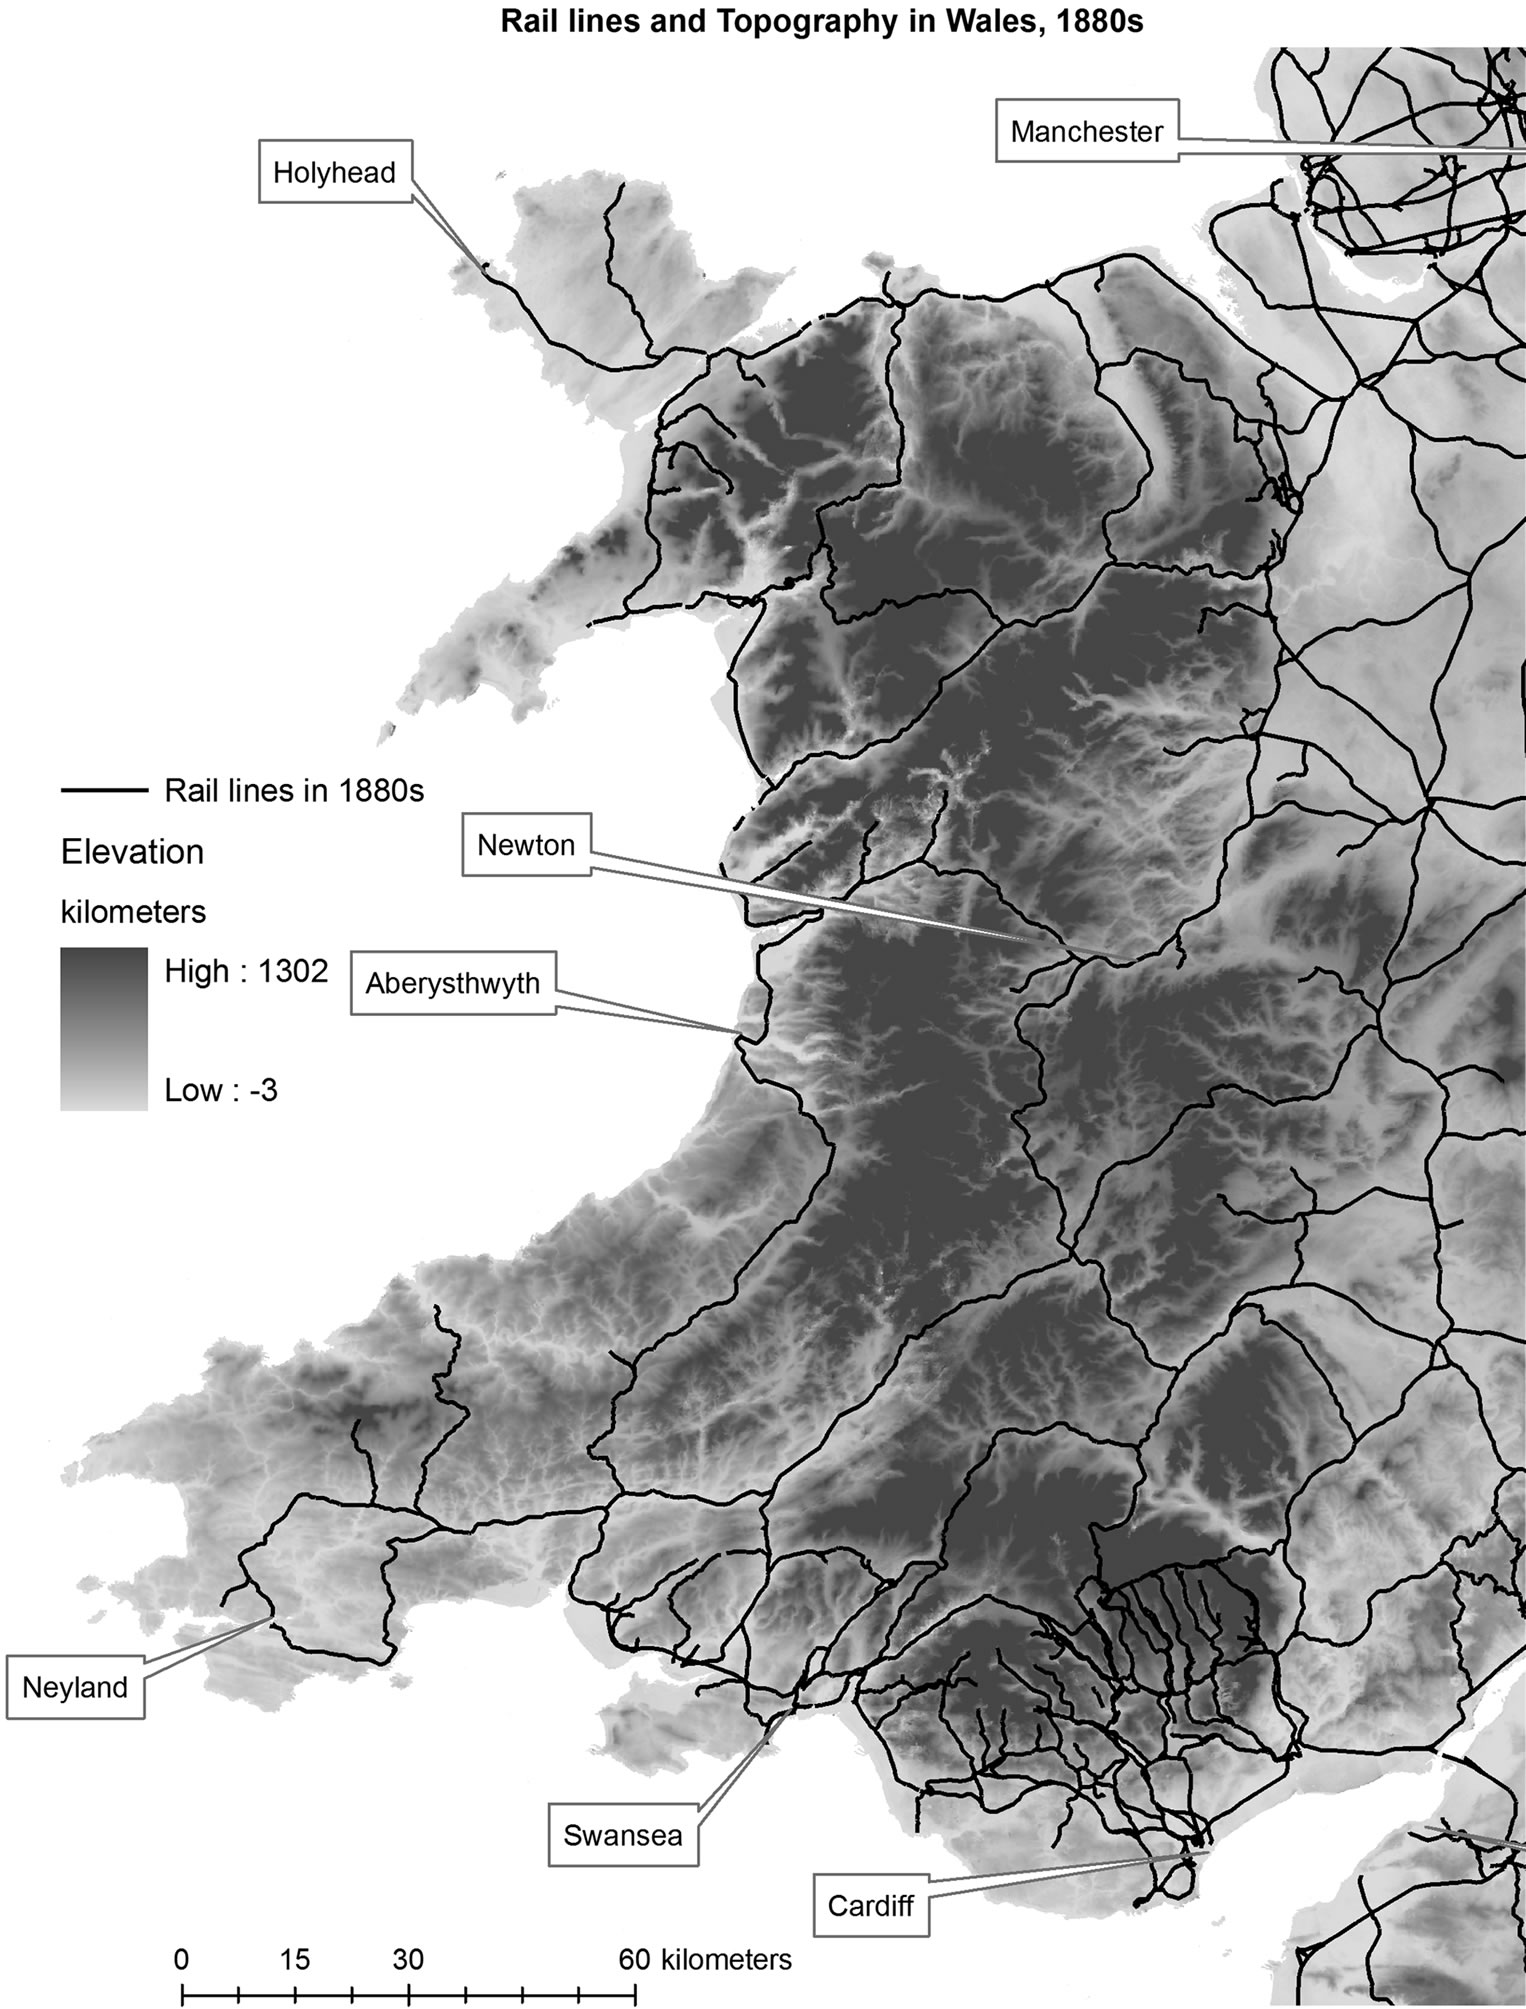
Figure 8. Railway lines and terrain in Wales (R. Schwartz, [21]).
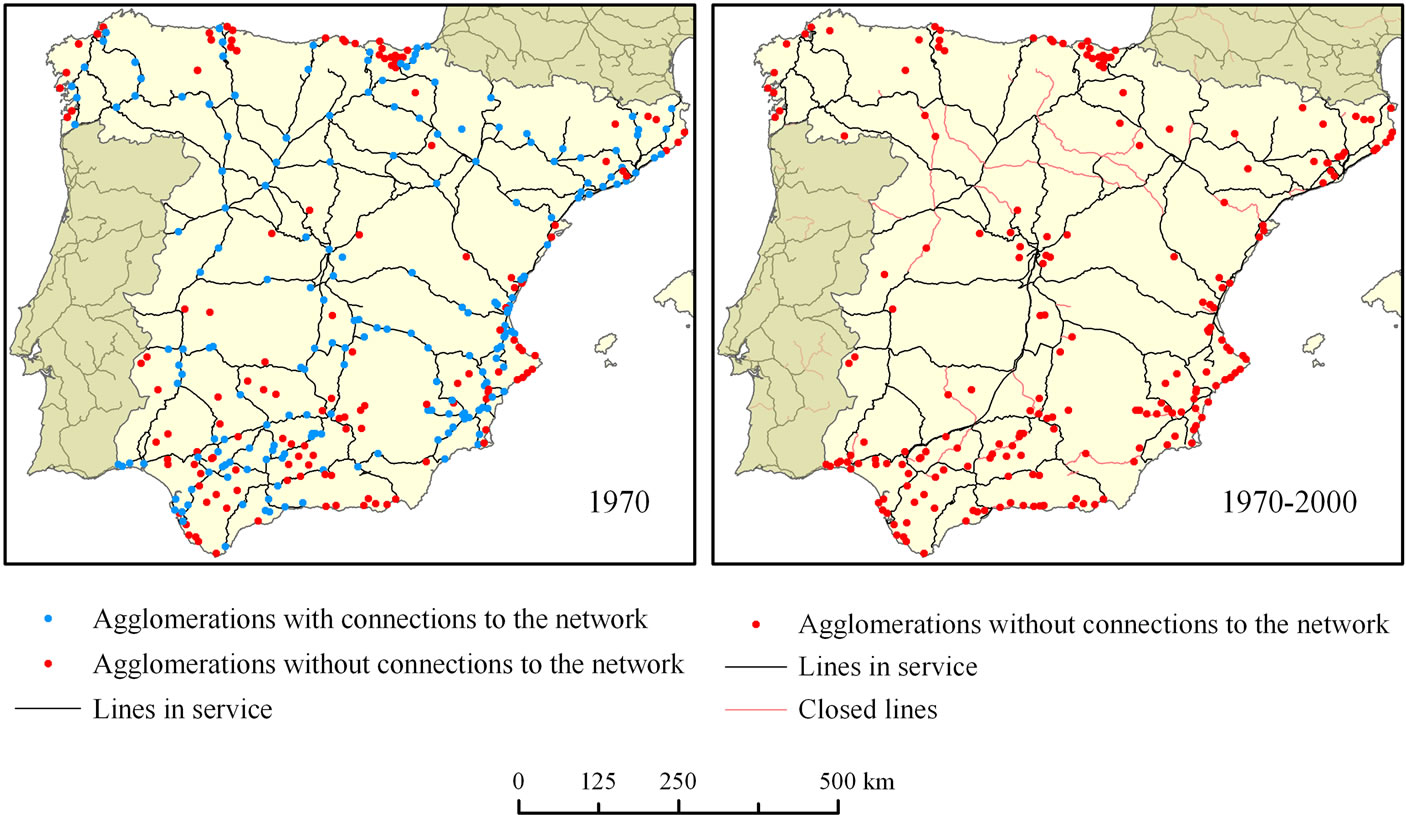
Figure 9. Railways and agglomerations in Spain [23].
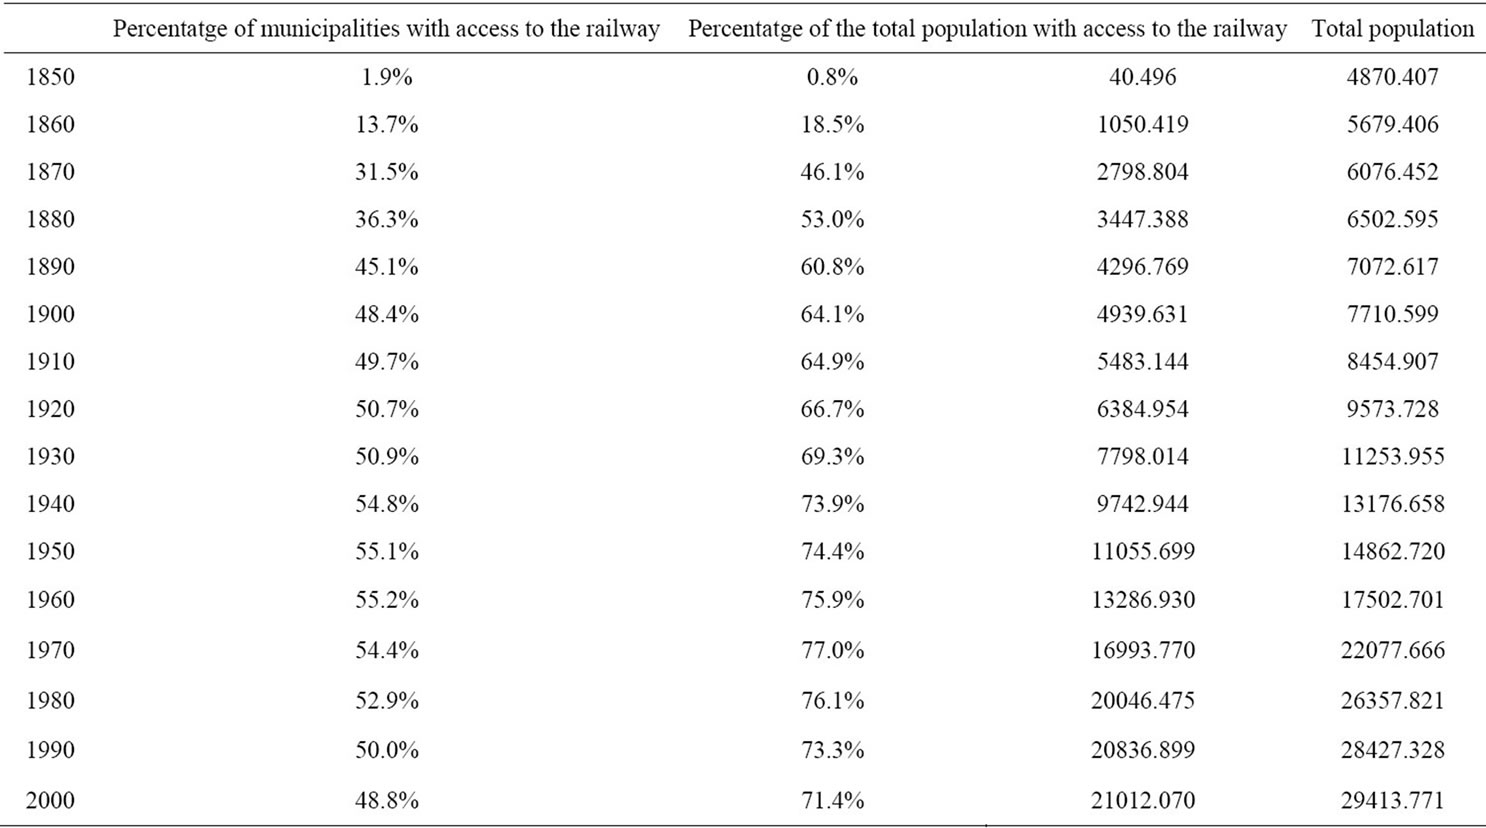
Table 1. Percentage of municipalities and population with access to railways in Spain: 1850-2000 [23].
2000 inhabitants. During the 1960s, however, the lack of a connection to the network tended to have a negative effect on population growth, particularly in the case of municipalities with more than 50,000 inhabitants. In the case of municipalities with populations of between 10,000 and 20,000 inhabitants, the presence of a railway connection tended to favour growth during the first decades of the 20th century, while the lack of such connections tended to have a negative effect on their growth from the middle of the century onwards [23]. In other words, the effect of railway connections on the population growth of agglomerations varied according to their population size and the period in question.
Figure 9 shows a map for 1970 with the railway network that was in service at the time and distinguishes between urban agglomerations according to whether or not they had railway connections. This is accompanied by a second map that shows the railway network in 2000, the lines that had closed since 1970 and the agglomerations that were not connected to the network.
Table 1 shows the percentage of municipalities and of the total population with access to the railway network. It is possible to observe that during the period 1850-2000, the percentage of the population with access to the railway network increased more rapidly than that living in municipalities. By the end of the 20th century, while almost three quarters of the urban population was effectively connected to the railway network, fewer than half of Spain’s agglomerations were connected to it.
Our future lines of work will consist of updating and completing the database with information that is not currently available. For example, we aim to add a layer corresponding to railway stations in Spain which will allow us to calculate the connectivity and accessibility of the urban areas with greater accuracy. This is already possible for Great Britain because of the availability of a vector layer of stations that topologically coincides with that of the railway lines. We also plan to add information relating to the travel speed on each stretch of line (and for each point in history); with this, it will also be possible to calculate accessibility in temporal units (travel time between two stations). With other data relating to such factors as the electrification of lines and the number of tracks, it will also be possible to analyse railways from a qualitative perspective: the modernity of the network.
6. Conclusions
This article presents a methodology for the elaboration of a HGIS for railways. This tool emphasises the historical perspective of geographic information which is used as a research tool to study the long term impact of railways. The spatial perspective, which already forms an intrinsic part of GIS, also facilitates the operation of combining data for other categories, such as population. The objective of the present railway HGIS is therefore to analyse the impact of the network at the global level of Europe from a historical perspective.
The most complex stage of development was that of researching the historical cartography, as the maps consulted show a different state of the railway network, although they are edited at the same year. We therefore decided to give priority to certain sources rather than others, though we still continue to look for new ones. As a result, the development of our railway HGIS has not yet concluded and we shall continue to correct errors in the existing database with the help of new-found sources.
This correction process is intrinsic to any form of historical research, because with time, a wider range of data becomes available which makes it possible to obtain more precise results.
Building this tool has been a long and complex process. This was firstly because it involved integrating data from many different countries and secondly because we had to deal with an extensive period during which there were periods of network destruction and ones for which little information was available, with the Second World War period providing an example of the latter case.
The railway HGIS presented here is novel from the point of view that it has no direct predecessor, either in terms of its geographical extension (the whole of Europe) or its time scale (1830-2010). It also shows the capacity of mapping to transmit geographical information, which allows us to get a rapid idea of the evolution and distribution of phenomena within a territory; in this case, relating to railways.
7. Acknowledgements
Funding for this research was provided by the Spanish Ministry of Education (CS02010-16389), and Ph.D. grant by University of Lleida.
REFERENCES
- P. K. O’Brien, “Railways and the Economic Development of Western Europe, 1830-1914,” Macmillan, London, 1983.
- I. N. Gregory and P. Ell, “Historical GIS: Technologies, Methodologies and Scholarship,” Cambridge University Press, Cambridge, 2007. doi:10.1017/CBO9780511493645
- L. Siebert, “Using GIS to Map Rail Network History,” The Journal of Transport History, Vol. 25, No. 1, 2004, pp. 84-104.
- I. N. Gregory and R. G. Healey, “Historical GIS: Structuring, Mapping and Analysing Geographies of the Past,” Progress in Human Geography, Vol. 31, No. 5, 2007, pp. 638-653. doi:10.1177/0309132507081495
- I. N. Gregory, “Exploiting Time and Space: A Challenge for GIS in the Digital Humanities,” In: D. J. Bodenhamer, J. Corrigan and T. M. Harris, Eds., The Spatial Humanities, Indiana University Press, Bloomington, 2010, pp. 58-75.
- K. Stanev, J. Martí-Henneberg and M. Ivanov, “Regional Transformations of a State under Construction: Bulgaria, 1878-2002,” Journal of Interdisciplinary History, Vol. 42, No. 1, 2011, pp. 111-134. doi:10.1162/JINH_a_00207
- L. E. Silveira, D. Alves, N. M. Lima, A. Alcântara and J. Puig, “Population and Railways in Portugal, 1801-1930,” Journal of Interdisciplinary History, Vol. 42, No. 1, 2011, pp. 29-52. doi:10.1162/JINH_a_00204
- J. Martí-Henneberg and I. N. Gregory, “The Railways, Urbanization and Local Demography in England and Wales, 1825-1911,” Social Science History, Vol. 34, No. 2, 2010, pp. 119-228. doi:10.1215/01455532-2009-025
- R. Schwartz, I. N. Gregory and T. Thévenin, “Spatial History: Railways, Uneven Development, and Population Change in France and Great Britain, 1850-1914,” Journal of Interdisciplinary History, Vol. 42, No. 1, 2011, pp. 53- 88. doi:10.1162/JINH_a_00205
- S. Akgüngör, C. Aldemir, Y. Kustepeli, Y. Gülcan and V. Tecim, “The Effect of Railway Expansion on Population in Turkey, 1856-2000,” Journal of Interdisciplinary History, Vol. 42, No. 1, 2011, pp. 135-157. doi:10.1162/JINH_a_00208
- J. Rusanen, O. Kotavaara and H. Antikainen, “Urbanization and Transportation in Finland, 1880-1970,” Journal of Interdisciplinary History, Vol. 42, No. 1, 2011, pp. 89- 109. doi:10.1162/JINH_a_00206
- J. Atack, F. Bateman, M. Haines and R. A. Margo, “Did Railroads Induce or Follow Economic Growth? Urbanization and Population Growth in the American Midwest, 1850-1860,” Social Science History, Vol. 34, No. 2, 2010, pp. 171-197. doi:10.1215/01455532-2009-024
- I. N. Gregory, J. Martí-Henneberg and F. J. Tapiador, “Modelling Long-Term Pan-European Population Change from 1870 to 2000 by Using Geographical Information Systems,” Journal of the Royal Statistical Society: Series A (Statistics in Society), Vol. 173, No. 1, 2010, pp. 31-50. doi:10.1111/j.1467-985X.2009.00598.x
- T. J. Misa and J. Schot, “Inventing Europe: Technology and the Hidden Integration of Europe,” History and Technology, Vol. 21, No. 1, 2005, pp. 1-19. doi:10.1080/07341510500037487
- I. Masser, “Building European Spatial Data Infrastructures,” ESRI Press, Redlands, 2007.
- D. M. Danko, “The Digital Chart of the World Project,” Photogrammetric Engineering & Remote Sensing, Vol. 58, No. 8, 1992, pp. 1125-1128.
- M. Coob, “Railways of Great Britain: A Historical Atlas,” Ian Allan, Shepperton, 2003.
- K. Baker, “The Bartholomew Archive,” The Geographer, Vol. 4, 2009-2010, pp. 10-11.
- I. N. Gregory, “A Place in History: A Guide Using GIS in Historical Research,” Centre for Data Digitisation and Analysis, Belfast, 2005.
- Z. Altamimi and C. Boucher, “The ITRS and ETRS89 Relationship: New Results from ITRF2000,” Proceedings of the EUREF Symposium, Dubrovnik, 16-18 May 2001, pp. 16-18.
- R. Schwartz, I. N. Gregory and J. Martí-Henneberg, “History and GIS: Railways, Population Change, and Agricultural Development in Late Nineteenth Century Wales,” In: M. Dear, J. Ketchum, S. Luria and D. Richardson, Eds., GeoHumanities: Art, History, Text at the Edge of Place, Routledge, Abingdon, 2011, pp. 251-266.
- L. Mojica and J. Martí-Henneberg, “Railways and Population Distribution: France, Spain and Portugal, 1870- 2000,” Journal of Interdisciplinary History, Vol. 42, No. 1, 2011, pp. 15-28. doi:10.1162/JINH_a_00203
- M. Morillas-Torné, X. Franch, J. Martí-Henneberg and A. García, “Urban Transformation and the Development of Spain’s Railway Network 1850-2000,” Down to Earth, Cologne, Accepted, 2012.
NOTES
1Infrastructure for Spatial Information in Europe (http://inspire-geoportal.ec.europa.eu) [as of 02/11/2011]
2Geographic Information Systems of the Commission (http://epp.eur ostat.ec.europa.eu/portal/page/portal/gisco_Geographical_information_maps/introduction) [as of 02/11/2011]
3For more information about the Digital Chart of the World, see (Danko, 1992) [16].
4http://www.train.eryx.net [as of 23/05/2011].
5Although there are a few exceptions, like the United Kingdom, where the census is conducted in years ending in 1.
6RMS (Root Mean Square) is an estimate of the error based on comparing the co-ordinates of the control points in digitiser or scanner units against their co-ordinates in real world units [2].