Natural Science
Vol.5 No.1(2013), Article ID:27669,7 pages DOI:10.4236/ns.2013.51013
Growth and fatty acid composition of Nile tilapia Oreochromis niloticus L. fed Azolla-diets, in tanks and in earthen ponds: A comparative study
![]()
1Research Unit on Wetlands, Department of Zoology, Faculty of Sciences and Technics, University of Abomey-Calavi, Abomey-Calavi, Benin; *Corresponding Author: y_abou@yahoo.com
2Laboratory of Water Sciences and Technics, Polytechnic School of Abomey-Calavi, University of Abomey-Calavi, Abomey-Calavi, Benin
3Research Unit in Environmental and Evolutionary Biology, FUNDP-University of Namur, Namur, Belgium
Received 16 October 2012; revised 15 November 2012; accepted 30 November 2013
Keywords: Azolla; Oreochromis niloticus; Concrete Tank; Pond; Growth; Fatty Acid; Phytoplankton; Zooplankton
ABSTRACT
Two 90-day experiments were conducted in the same period in tanks and in earthen ponds to study the effects of culture systems on growth and fatty acid (FA) of Nile tilapia (Oreochromis niloticus L.) fingerlings (mean weight: 16.3 g) fed Azolla, as partial replacement for fish meal (FM). Diets were isonitrogenous (29.2% CP) and isoenergetic (16.9 kJ∙g−1) containing 0% (A0), 10% (A10), 20% (A20), 30% (A30), 40% (A40) and 50% (A50) of Azolla meal (AM) respectively. Diet A0, without AM, acted as a control. In both experiments, fish growth decreased as AM level increased in diets (P < 0.05), and values were significantly higher (P < 0.001) in ponds than in tanks (ranges: 88.8 - 135.9 g vs. 51.0 - 88.3 g). Some dissimilarity was noticed in fish FA composition. FA profiles in fish fed in tanks was influenced by diet, except for the high content in arachidonic acid (20:4n-6) in fish fed high AMdiets. On the contrary, FA profile in fish fed in ponds was different from that in fish fed in tanks, and from diets. The lower resemblance of fish composition was more pronounced in fish fed high AM (A30-A50). Interestingly, those fish were rich in eicosapentaenoic acid (EPA, 20:5n-3) and docosahexaenoic acid (DHA, 22:6n-3). Consequently, the n-3/n-6 values decreased in tanks, whereas an increasing trend was found in ponds, and values were significantly higher in ponds than in tanks (0.35 - 0.53 vs. 0.08 - 0.17). The results suggest raising Nile tilapia with Azolladiets in ponds to improve growth and produce fish with a better FA composition, for the wellbeing of consumers.
1. INTRODUCTION
Recent estimates suggest that aquaculture industry uses about 2.5 million metric tones of fish meal (FM), representing 40% of the global production which was stabilized at 6 to 7 million tones since 1987 [1]. As aquaculture production continues to increase, there is a subsequently increasing demand for FM. Consequently, the prices has rising, driving research in the feed industry towards finding substitutes [1]. Then, research on the use of non-conventional sources of protein as ingredients to repldcace FM in fish feeds is receiving increasing attention by fish nutritionists around the world. Several vegetable sources have shown to be valuable to replace FM in fish diets, either partially or in total substitution. The use of Sesbania seeds (Sesbania aculeata L.), Moringa leaf (Moringa oleifera Lamarck), Mucuna seeds (Mucuna pruriens L.), duckweed (Spirodela polyrrhiza L. Schleiden), Azolla Lamarck, etc. in diets for O. niloticus had yielded encouraging results [2-6]. Particularly, the fern Azolla has been successfully used recently as a main component in Nile tilapia-diets to replace FM, thus promoting the aquaculture of this fish for poors [7-9]. However, increasing interests were focused nowadays on the fatty acid composition of fish, especially when evaluating the suitability of vegetal sources to replace FM in fish diets. This importance in fatty acid profile of fish stems from their importance in human health, mainly in reducing the occurrence of heart diseases, strokes and various inflammatory injuries, and improving neurological function in newborn infants [10,11]. In that area, findings have confirmed that body fatty acid profile to a large extent mirrors the dietary fatty acid composition [11,12]. Hence, differences could appear between tank and pond rearing systems, due to the natural food present in the latter, when feeding fish with same artificial diets. Indeed, many phytoplankton families [13,14], copepods and rotifers [15,16], and chironomids and oligochaetes [17] are rich sources of fatty acid, particularly linolenic acid (18:3n-3), eicosapentaneoic acid (EPA) and docosahexaneoic acid (DHA), as well as amino acids and vitamins, which could influence growth and nutrient retention in fish. According to Schroeder [18], natural foods contribute for about 50% - 80% in Nile tilapia growth, both in fertilizer and in semi-intensive system. Although an abundant literature is available on fish production in either pond or tank culture systems, very few authors [19,20] have tried to compare fish growth between both systems. Generally, pond conditions are simulated in controlled systems, and comparisons between tank experiments and those in fields like in stagnant earthen ponds are scarcely available.
In the present study, we attempted to investigate the effects of two rearing systems (tank or pond) on growth and fatty acid composition of Nile tilapia when fed diets containing different levels of Azolla, as substitutes for FM.
2. MATERIAL AND METHODS
2.1. Experimental Design, Diets and Feeding
The experiments were conducted during the same period in 18 square concrete tanks (600 L, each) and 18 stagnant earthen ponds (10 m × 3 m × 1 m, each). Tanks were subjected to a recirculating system with a water flow rate of 2 L∙min−1 whereas experimental ponds were filled continuously from the water table, both culture systems being exposed to natural conditions (32˚C - 35˚C; 12-h:12-h dark diurnal photoperiod). Culture units were stocked with male fingerlings of Nile tilapia (initial mean weight: 16.3 g) from the same cohort. Sixty fish (60) per tank and per pond were stocked. Six isonitrogenous (29.2% CP) and isoenergetic (16.9 kJ∙g−1) diets were formulated containing 0% (A0, control diet), 10% (A10), 20% (A20), 30% (A30), 40% (A40) and 50% (A50) using locally available fish meal (locally made of grounded Sardinella aurita fingerlings), maize bran, cottonseed cake, brewery draff and the aquatic fern Azolla (Table 1). The Azolla strain used is Azolla filiculoides Lam., which is the most suitable strain for fish and the more productive and easiest to grow under local conditions. Proximate composition of ingredients, diets processing and biochemical analysis, and methods for conservation before feeding have been detailed in Abou et al. [7]. They were fed to experimental fish in both culture systems, each administered to randomly-assigned groups of three replicate ponds/tanks (6 × 3 ponds/tanks). The daily ration was calculated according to Melard [21] and was adjusted fortnightly based on the actual fish biomass. Daily rations were divided into two parts, each handdistributed at 8:00 h and 16:00 h, respectively.
2.2. Fatty Acid Analysis
At the beginning of the experiment, thirty fish from the initial batch and six fish per pond and per tank at the end were randomly taken and mashed using a Robot coupe food processor. Subsamples were taken and stored
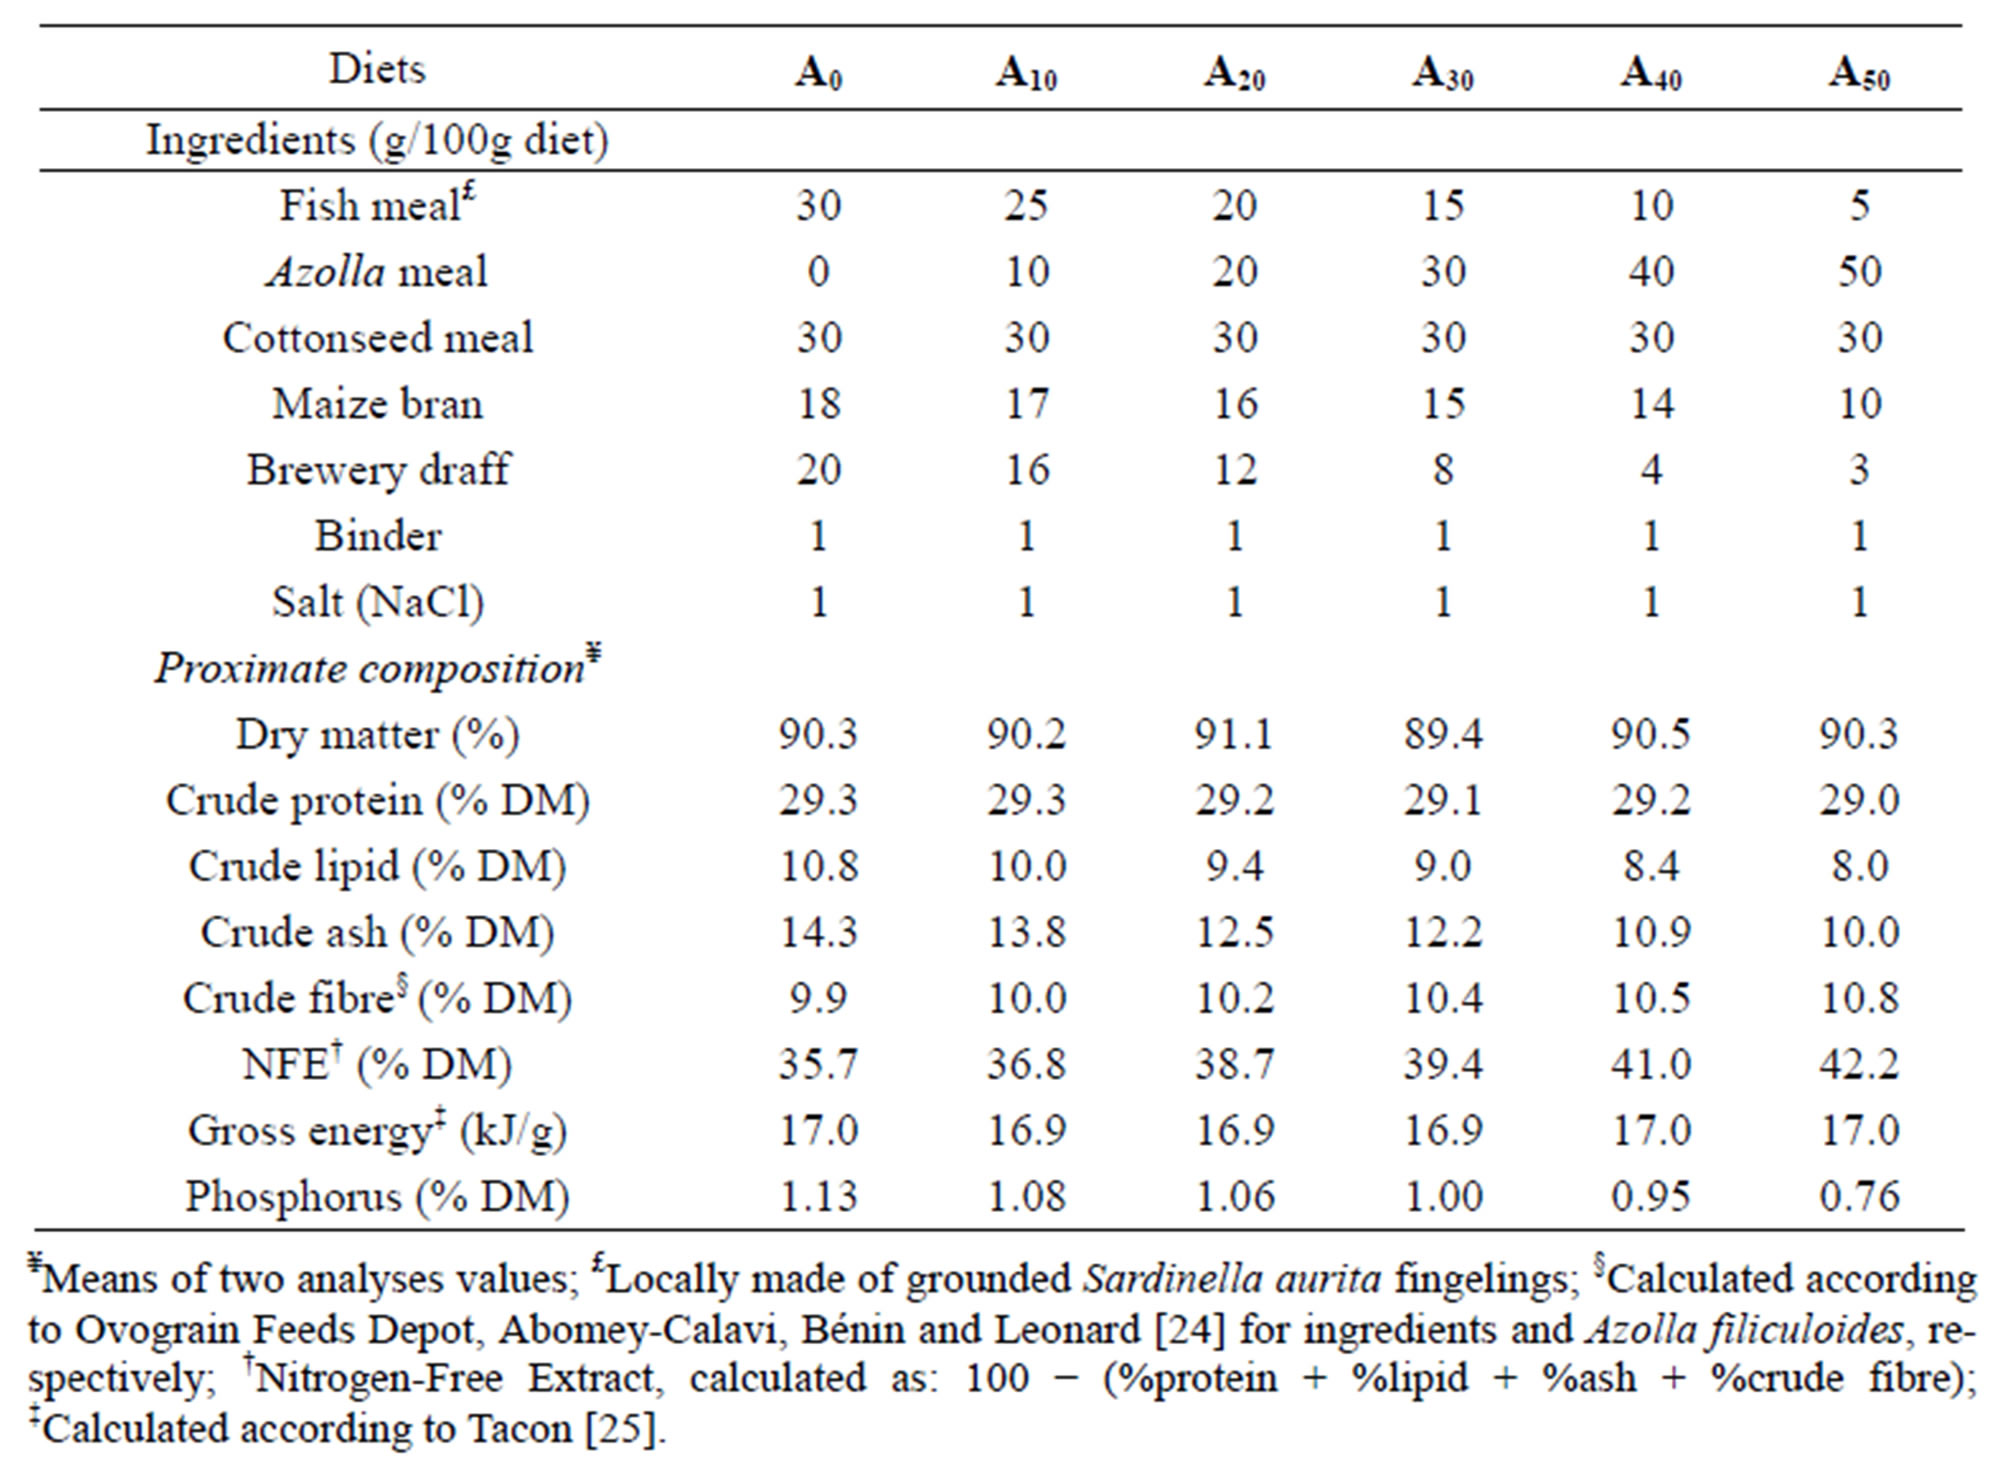
Table 1. Formulation and proximate composition (on dry matter basis) of experimental.
at −20˚C for carcass analysis. Body crude lipid was determined according to Folch et al. [22]. Fatty methyl esters were prepared after transesterification with anhydrous methanol containing 1% sulphuric acid and 0.01% (w/v) butylated hydroxytoluene (BHT) for 16 h at 50˚C [23]. Fatty acids were separated and quantified by gas chromatography (GC Trace, 2000, Thermo Quest, Carlo Erba, Italy), using a 30 m × 0.32 mm capillary column (FAME-WaxTM, USA). Helium was used as carrier gas. The temperature in the oven was programmed to rise from 50˚C to 170˚C at 25˚C∙min−1, then raise the temperature to 190˚C at 2˚C∙min−1 and hold this temperature for 4 min, then increase to 210˚C at 3˚C∙min−1 and to 235˚C at a rate of 5˚C∙min−1 and hold for 5 min. The total running time was 40 min. Fatty acids peaks were integrated and quantified by Chrom-Card for Trace computing integrator. Identification was made by comparison with a well known and characterized standard PUFA-3, from Menhaden oil (Supelco, Bellefonte, PA).
2.3. Water Quality
During both experiments, water quality parameters were monitored fortnightly in the cultured systems. Water temperature, dissolved oxygen (DO) and pH were measured at 10 cm depth at the following times: 08:00, 11:00, 14:00 and 17:00 hours, using an oxythermometer (WTW Oxi 197i, WTW, Weilheim, Germany, precision: ±0.01˚C and ±0.01 mg∙L−1) and a pH meter (WTWpH 330i, precision: ±0.01) respectively. Nitrite levels were measured using spectrophotometric methods according to APHA [26]. Estimation of chlorophyll a concentration was carried out according to standard methods described in APHA [26]. To estimate zooplankton abundance in experimental ponds, 20 L of water were collected in three points of each pond and filtered through a 55 µm plankton net to obtain a concentrated sample. The samples were preserved immediately with 5% formalin. The absolute abundance of zooplankton was estimated by counting samples in a Dolfus cell under a binocular magnifying glass (×40).
2.4. Statistical Analysis
Variations in growth, fatty acid composition of fish, and water quality parameters were analyzed in each culture system using one-way Anova, after verifying the homogeneity of their variances [27]. Two-way Anovas were used to compare performances in both culture systems. Values for percentage data and ratios were logtransformed prior to analyses. When the effect was significant, comparisons between means were run using Duncan’s multiple range test [28] at P = 0.05. A multivariate procedure, principal component analysis (PCA) was used to analyze the extent to which the fatty acid profile in fish differed among culture system and how they are comparable to the fatty acid profile in experimental diets. This analysis was carried out on standardized variables of fatty acid composition as original data. The software Canoco for Windows version 4.5 was used for the analyses and drawing diagrams.
3. RESULTS
3.1. Water Quality
Water quality parameters were statistically similar in each experiment (Table 2). Ranges for temperature, pH, dissolved oxygen and nitrite levels were respectively 30.0˚C - 30.2˚C, 6.33 - 6.62, 4.65 - 5.49 mg∙l−1 and 0.01 - 0.02 mg∙l−1 in ponds and 29.5˚C - 30.3˚C, 6.80 - 7.02, 6.55 - 7.68 mg∙l−1 and 0.0 - 0.02 mg∙l−1 in tanks. Dissolved oxygen and pH were significantly higher in tanks than in ponds (P < 0.05).
Evaluation of natural food in experimental ponds, mainly chlorophyll a biomass and zooplankton abundance, showed similar values between dietary treatments, ranging from
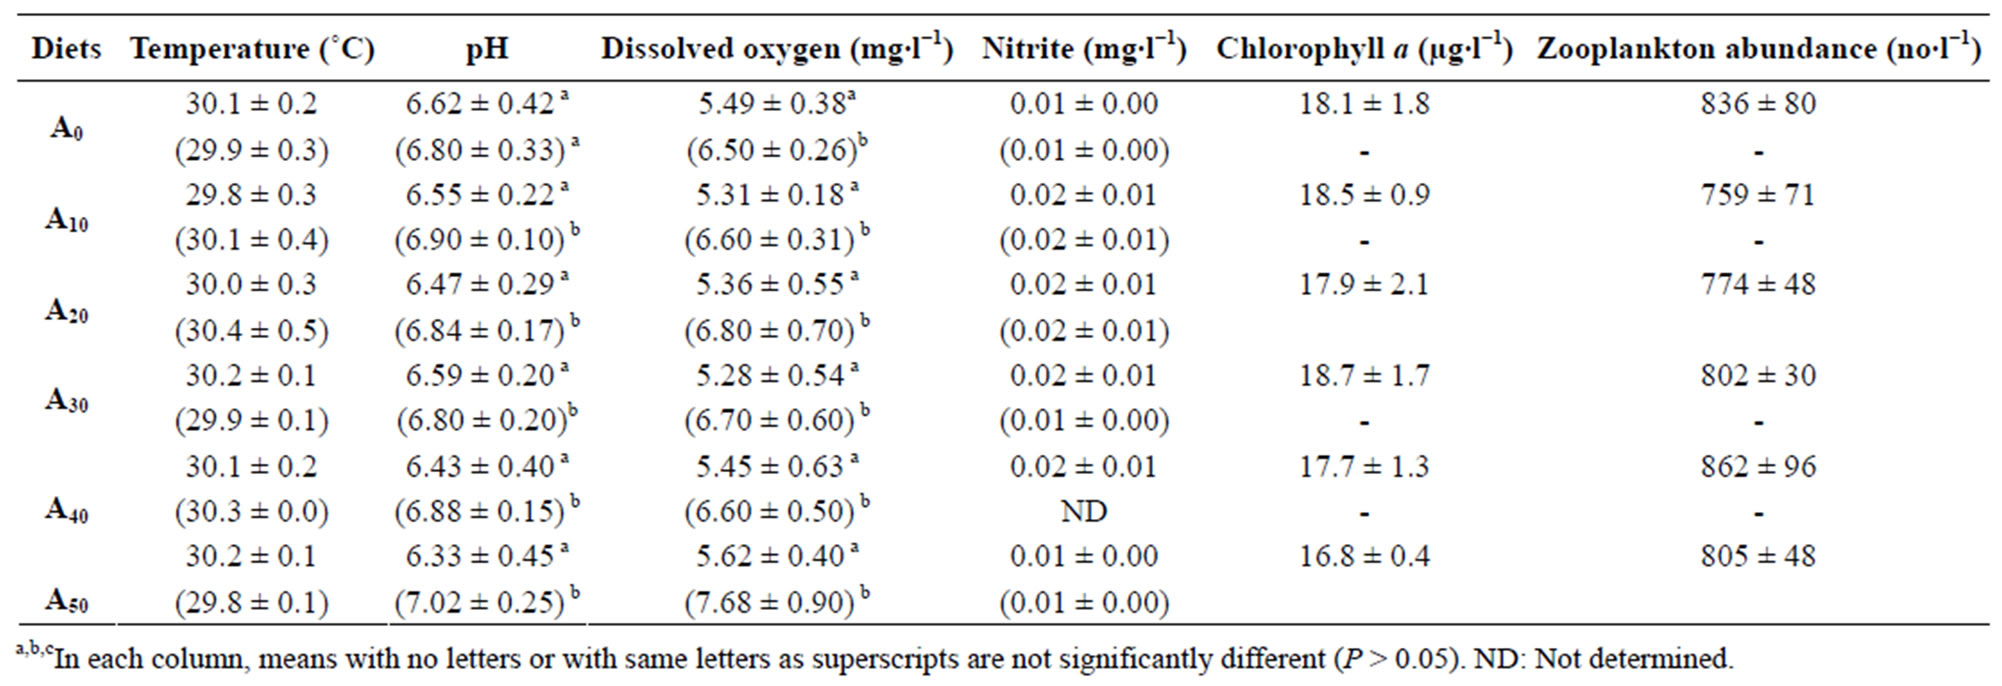
Table 2. Pond and (tank) values of water quality parameters. Data are mean ± S.D. of three replicates from fortnight measures. A0 to A50: diet with 0% to 50% Azolla.
16.8 mg∙l−1 to 18.7 mg∙l−1 and from 759 l−1 to 862 l−1, respectively.
3.2. Fish Growth
In pond and in tank experiments, survival rate did not show any significant differences, and values were higher in both culture systems, ranging from 89.4% to 93.3% in tanks and from 85.0% to 90.0% in ponds. Final mean weight decreased significantly in tanks and in ponds when AM level exceeded 10% and 20% in diets (P < 0.05), ranging from 88.3 g to 51.0 g and from 135.9 g to 88.8 g respectively. Two-way anovas show that for each diet, the values obtained in ponds were higher than those in tanks (Figure 1, P < 0.001). The improvement of fish growth in ponds compared to that in tanks for the same diet is important in fish fed high AM level in diets, representing 54% to 75% from fish fed A0 to those fed A50.
3.3. Variation in Fatty Acid Composition of Fish
Data spread across up in the PCA axes showed that fatty acid composition in fish varied according to culture system (pond or tank) and experimental diets (Figure 2). The first axis, which accounts for 51% of the total variability, separated fatty acid as a function of experimental diets. Diet formulations with a higher contribution of AM contained lower percentages of 14:0, 16:1n-7, 18:1n-9 and 18:3n-3 fatty acids, and higher percentages of 18:0 and 20:4n-6 fatty acids. These differences in dietary fatty acid compositions were well observed in fish fatty acids, especially for fish fed in tanks.
The second axis, which accounts for 19.3% of the total variability, separated the fatty acid composition of fish in function of culture system (pond or tank), especially for
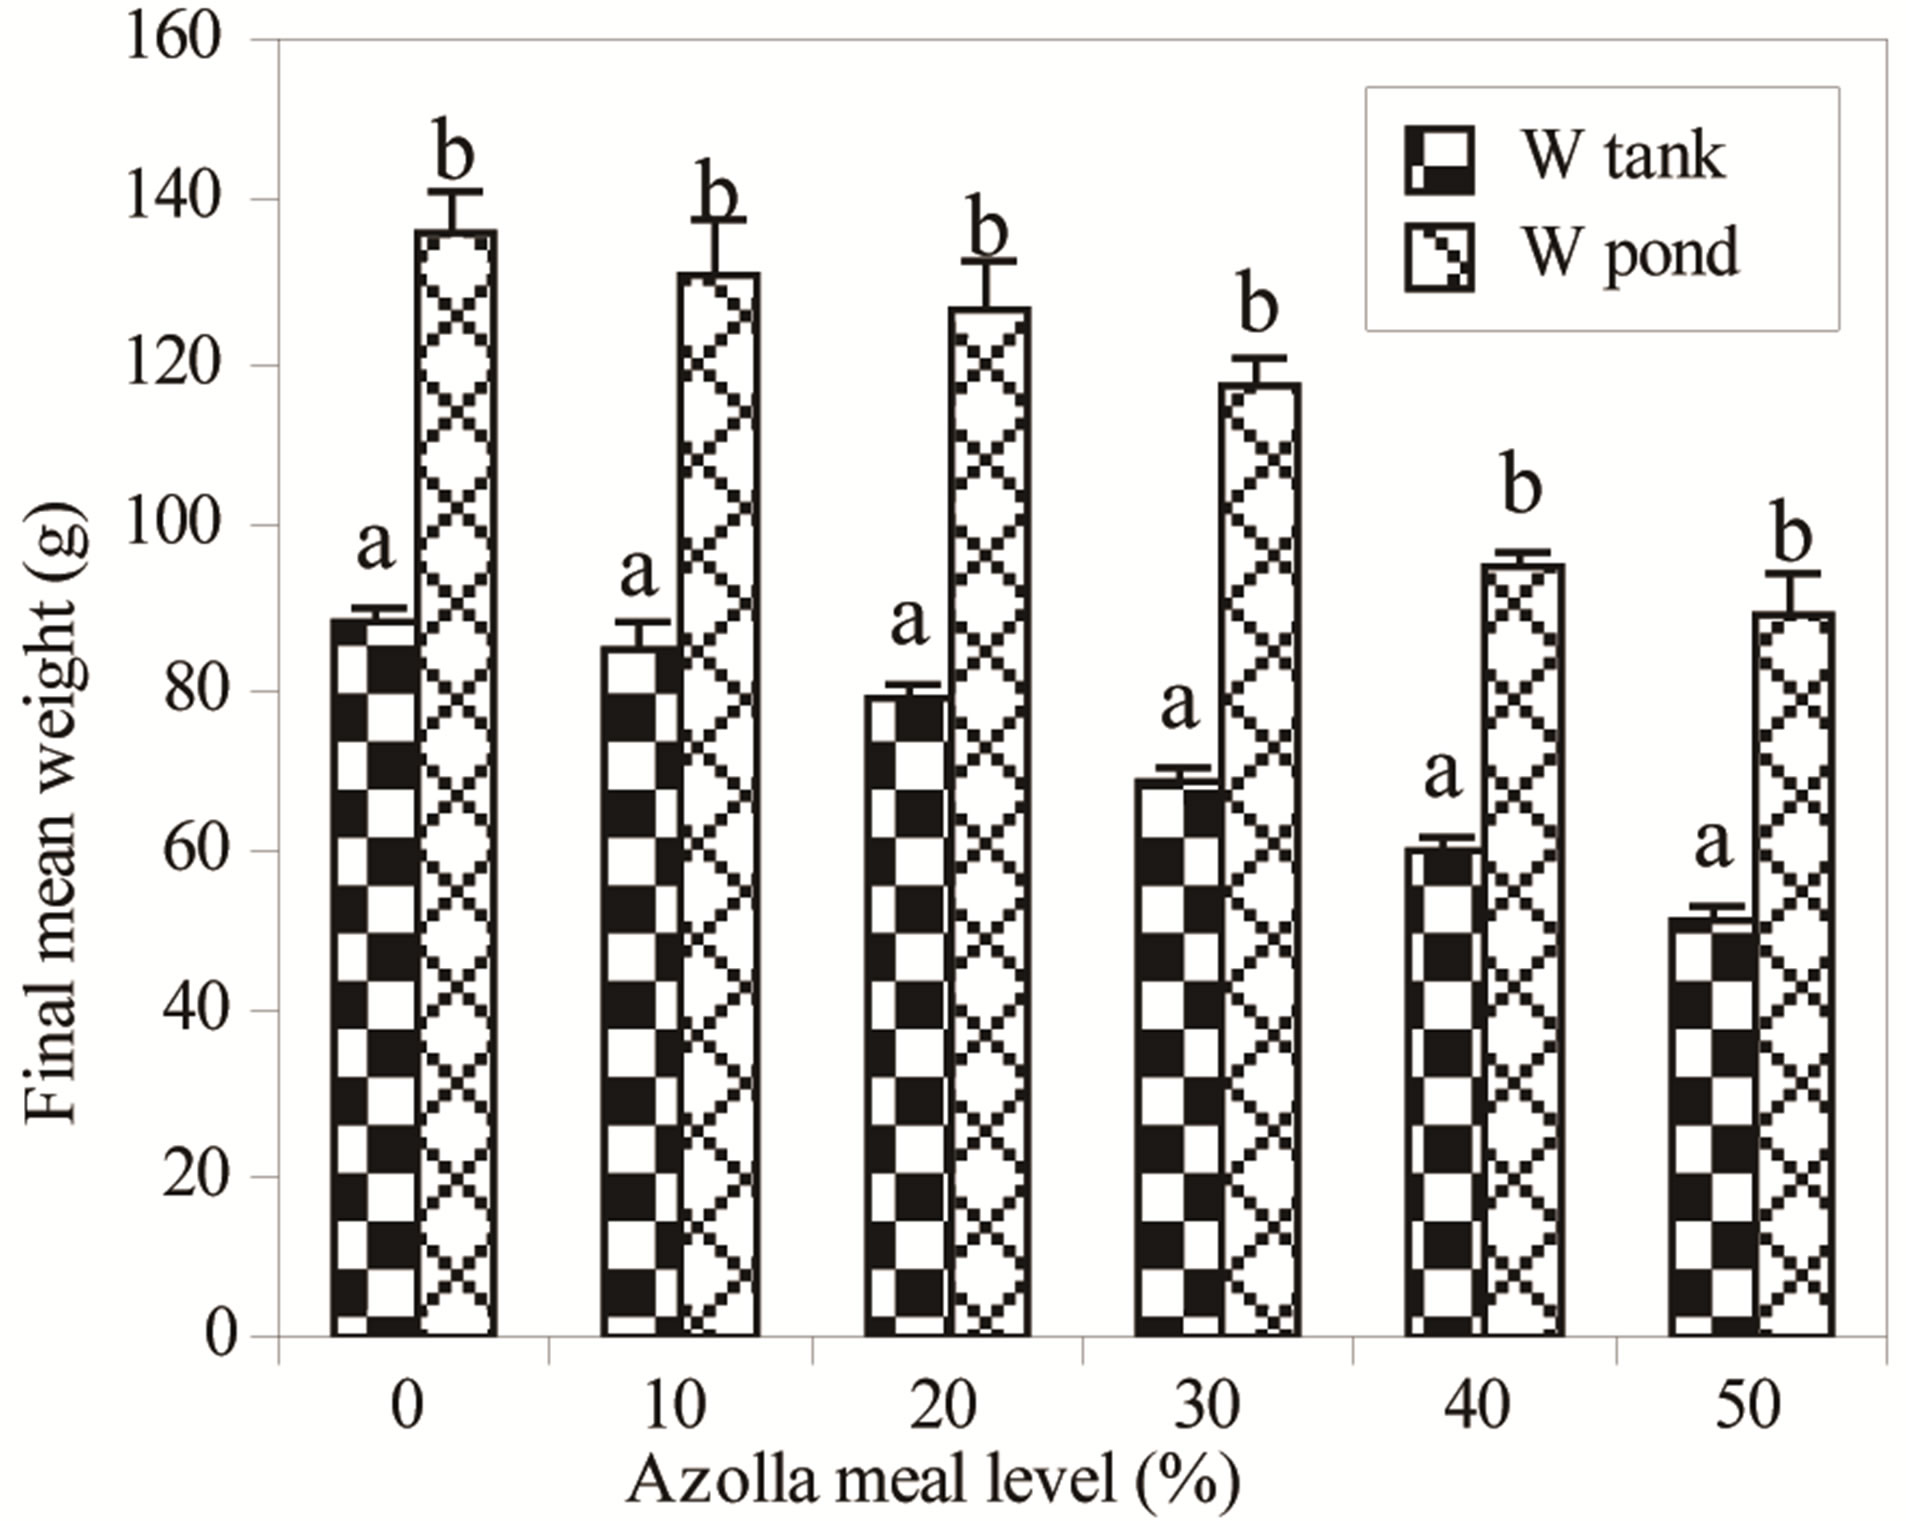
Figure 1. Pond and tank values of final mean weight of Nile tilapia fed gradual Azolla meal. a,bFor each Azolla meal level, bars with different letters are significantly different (P < 0.05).
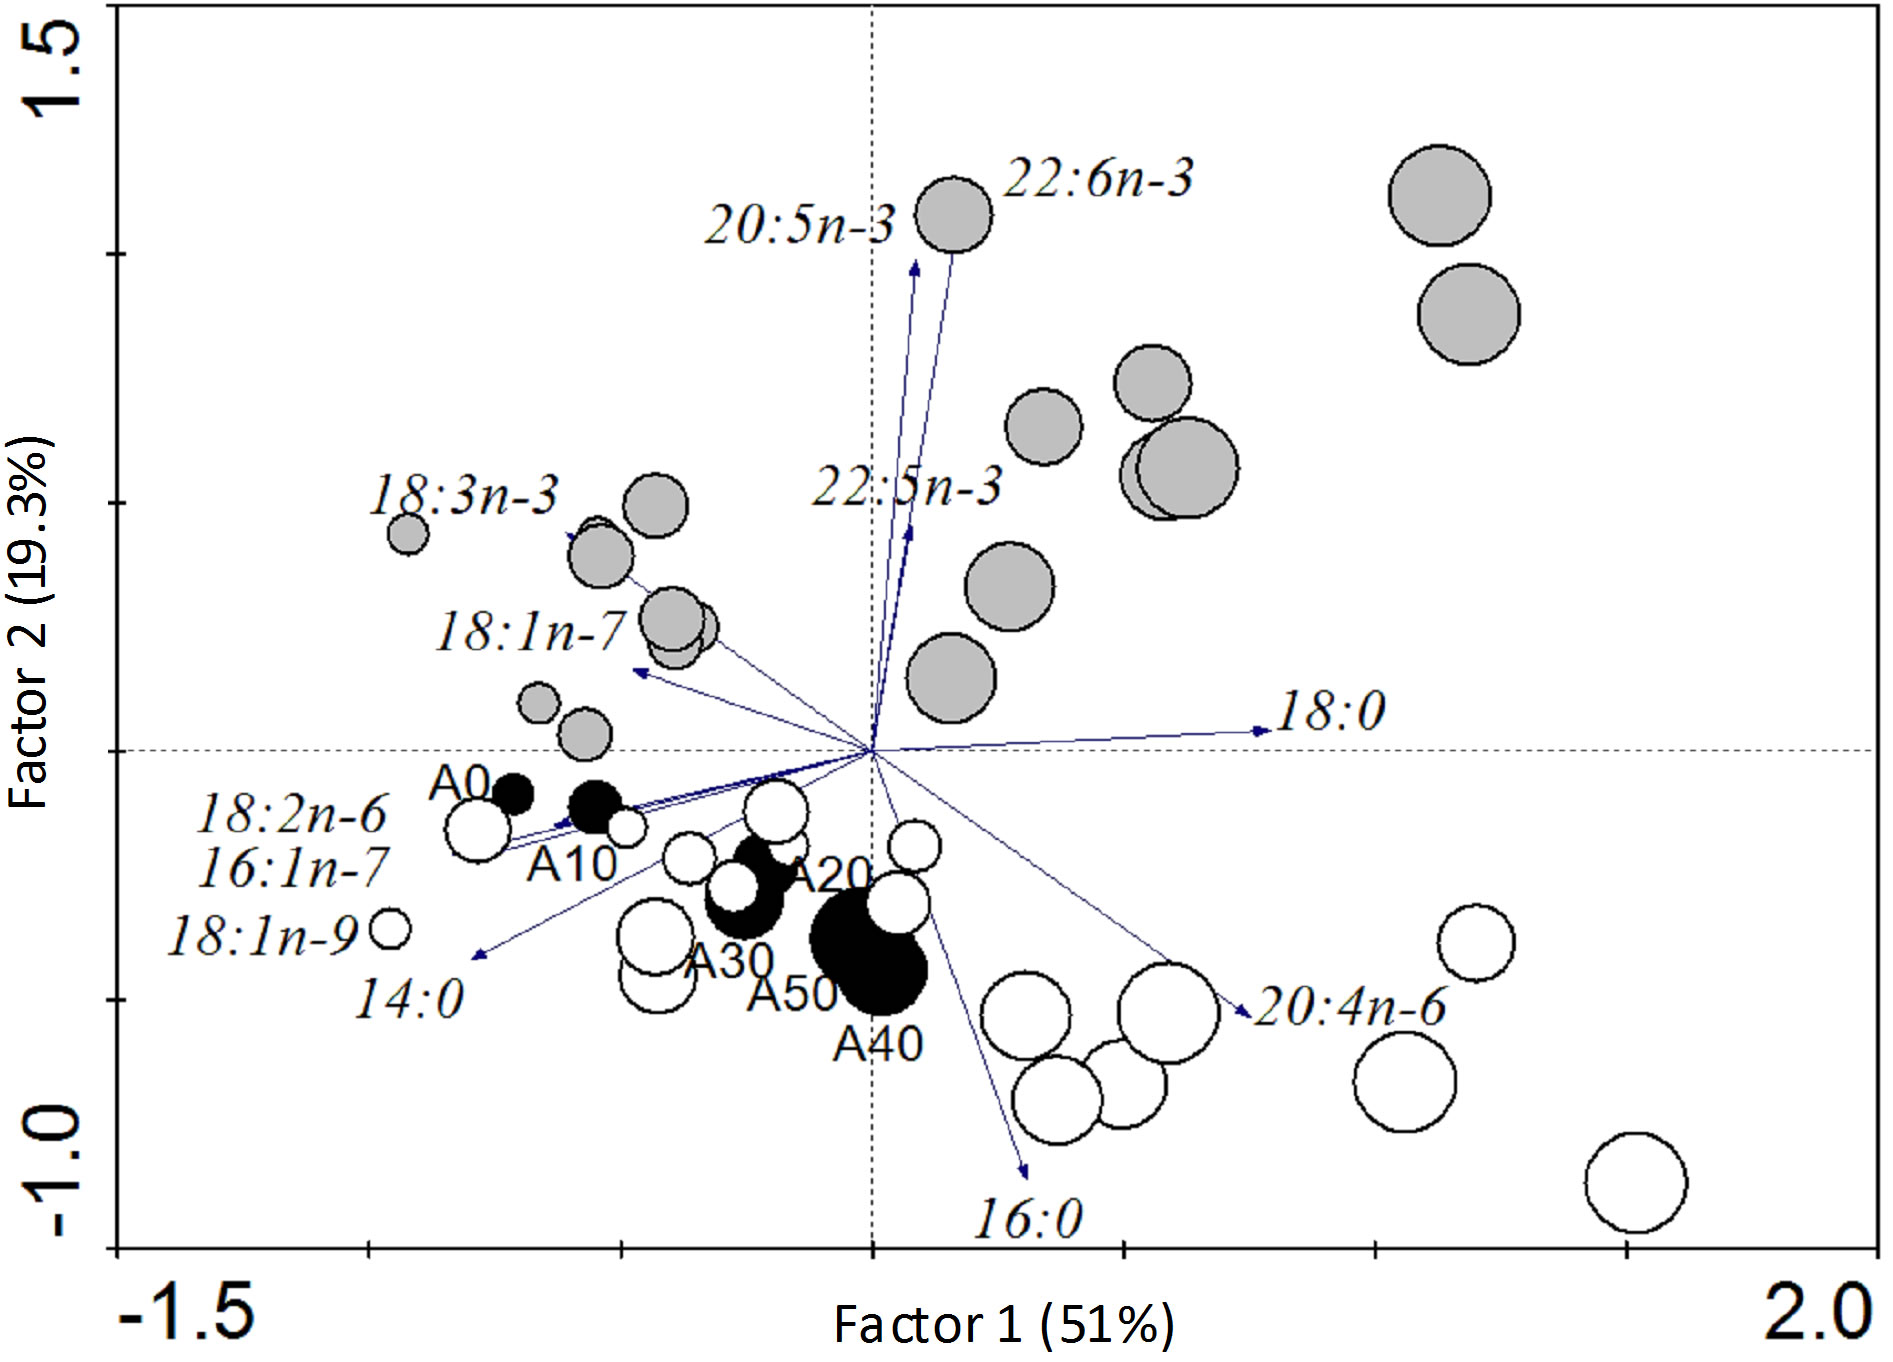
Figure 2. Principal Component Analysis ordination of fatty acid composition of fish fed in ponds (grey circles) or in tanks (white circles). Profiles of experimental diets (black circles) were added as passive variables. Circle size is proportional to the amount of AM in diets. The principales fatty acids are: Myristic acid, 14:0; palmitic acid, 16:0; stearic acid, 18:0; palmitoleic acid, 16:1n-7; vaccenic acid, 18:1n-7; Oleic acid, 18:1n-9; linolenic acid, 18:3n-3; linoleic acid, 18:2n-6; arachidonic acid, 20:4n-6; eicosapentaenoic acid, 20:5n-3; docosahexaenoic acid, 22:6n-3; clupanodonic acid, 22:5n-3.
fish fed on diets A30, A40 and A50. Globally, fish in ponds had higher levels of high unsaturated fatty acid (HUFA) namely clupanodonic acid (22:5n-3), EPA (20:5n-3) and DHA (22:6n-3). The Euclidean distance between each fish fatty acid profile and the one of its diet (Figure 3) showed that the distance between both profiles increased with increasing AM in diets (P < 0.05). Within each AM level, values were statistically different for fish fed in both systems with A20, A30 and A40 (P < 0.05).
Values of (n-3) fatty acid to (n-6) fatty acids ratios (n-3/n-6) in fish were plotted with AM level in diets (Figure 4). Values tend to increase in ponds whereas a decreasing trend is found in tanks (P < 0.05) when AM level increased in diets. Pond values were significantly higher than tank values (P < 0.001).
4. DISCUSSION
In this study, fish from the same cohort were fed the same diets at the same period. The growth of O. niloticus revealed that final mean weight in fish fed in ponds was significantly higher than in fish fed in tanks, using the same diets. These results are in accordance with those reported in the literature. Higher weight gain of koi carp (Cyprinus carpio var. koi) was obtained in earthen ponds compared to that in tanks [20]. Significantly lower growth rates in Catfish, Ictalurus punctatus Rafinesque, had been reported in concrete pools compared to earthen ponds [19]. It is well established that fish size, water temperature and composition of diet are the main factors generally affecting growth rate in fish [29-31]. As ex-
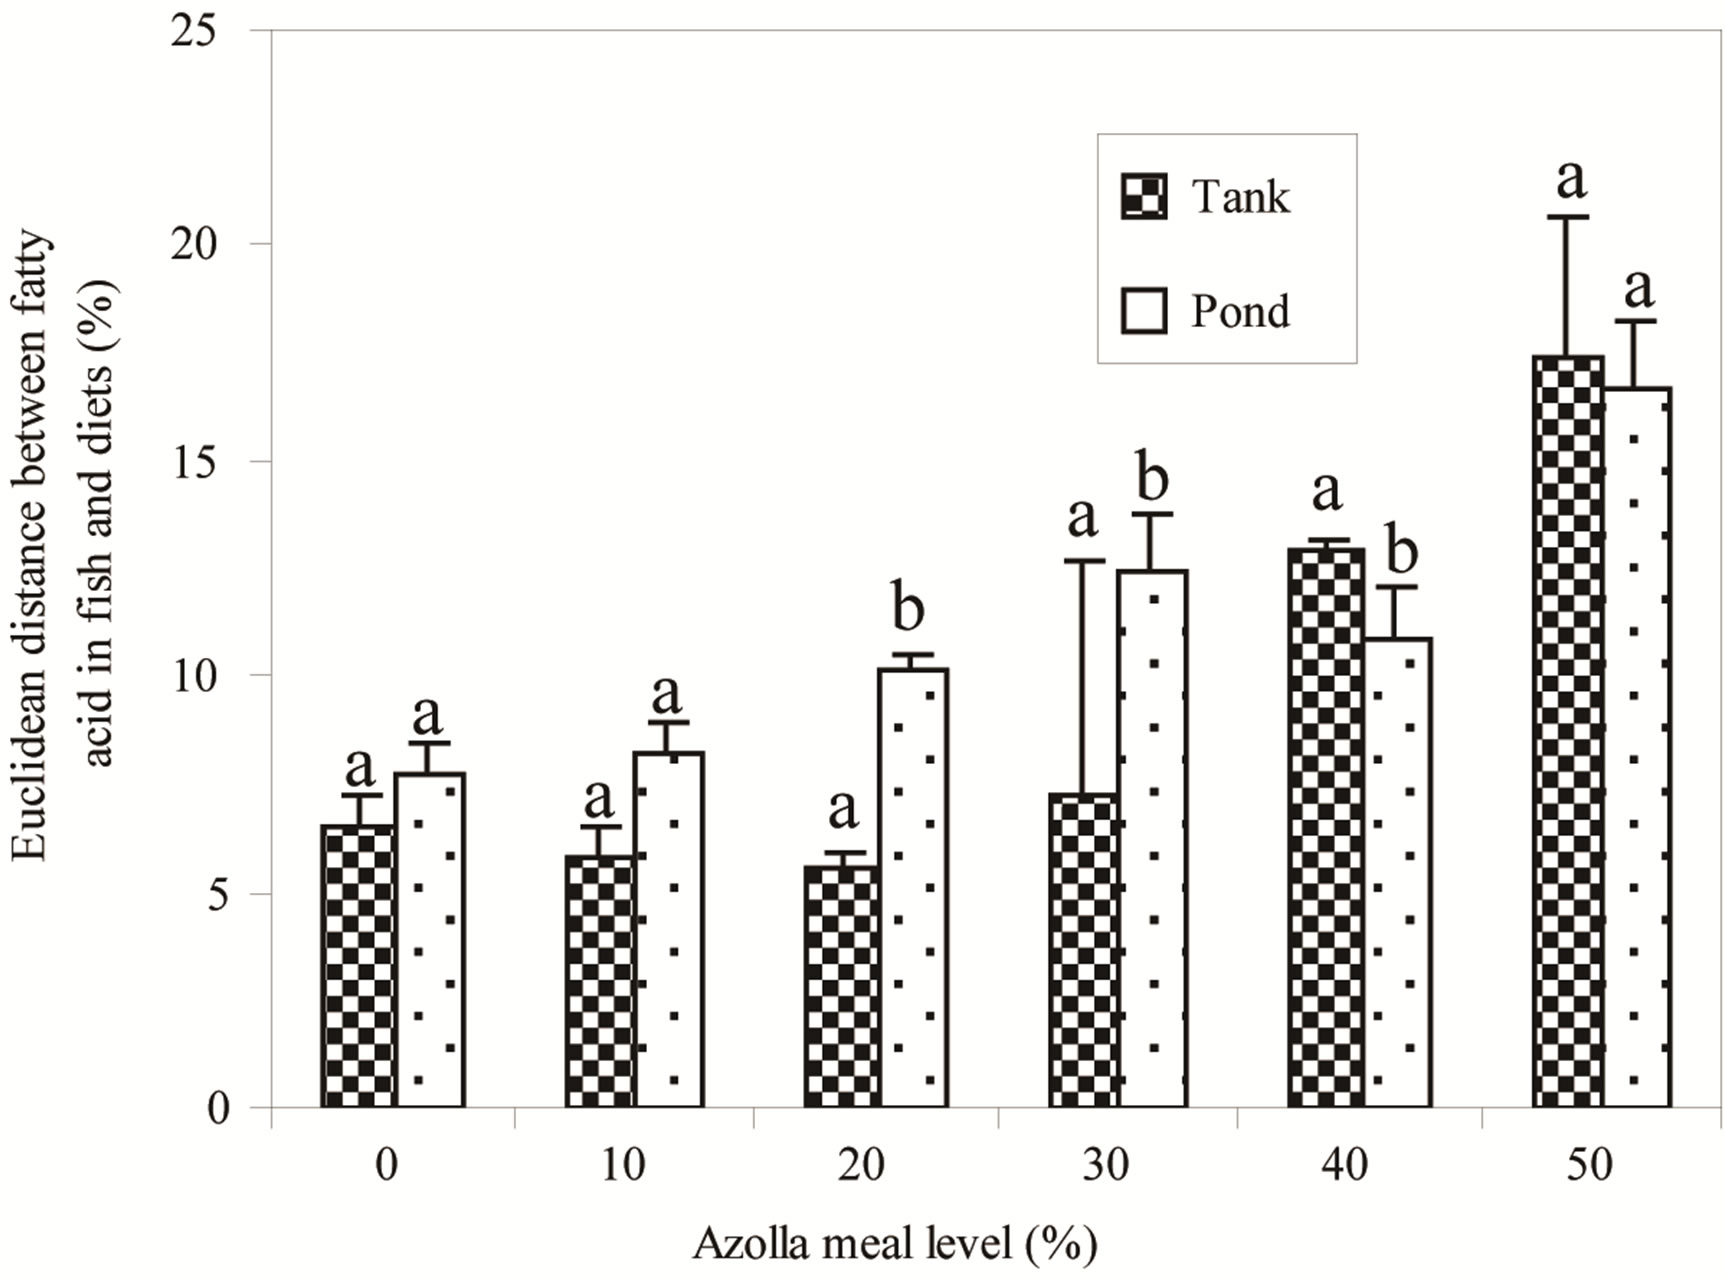
Figure 3. Euclidean distances between fish fatty acid profiles and fatty acid profile of their food. (a) and (b) For each Azolla meal level, bars with different letters are significantly different (P < 0.05).
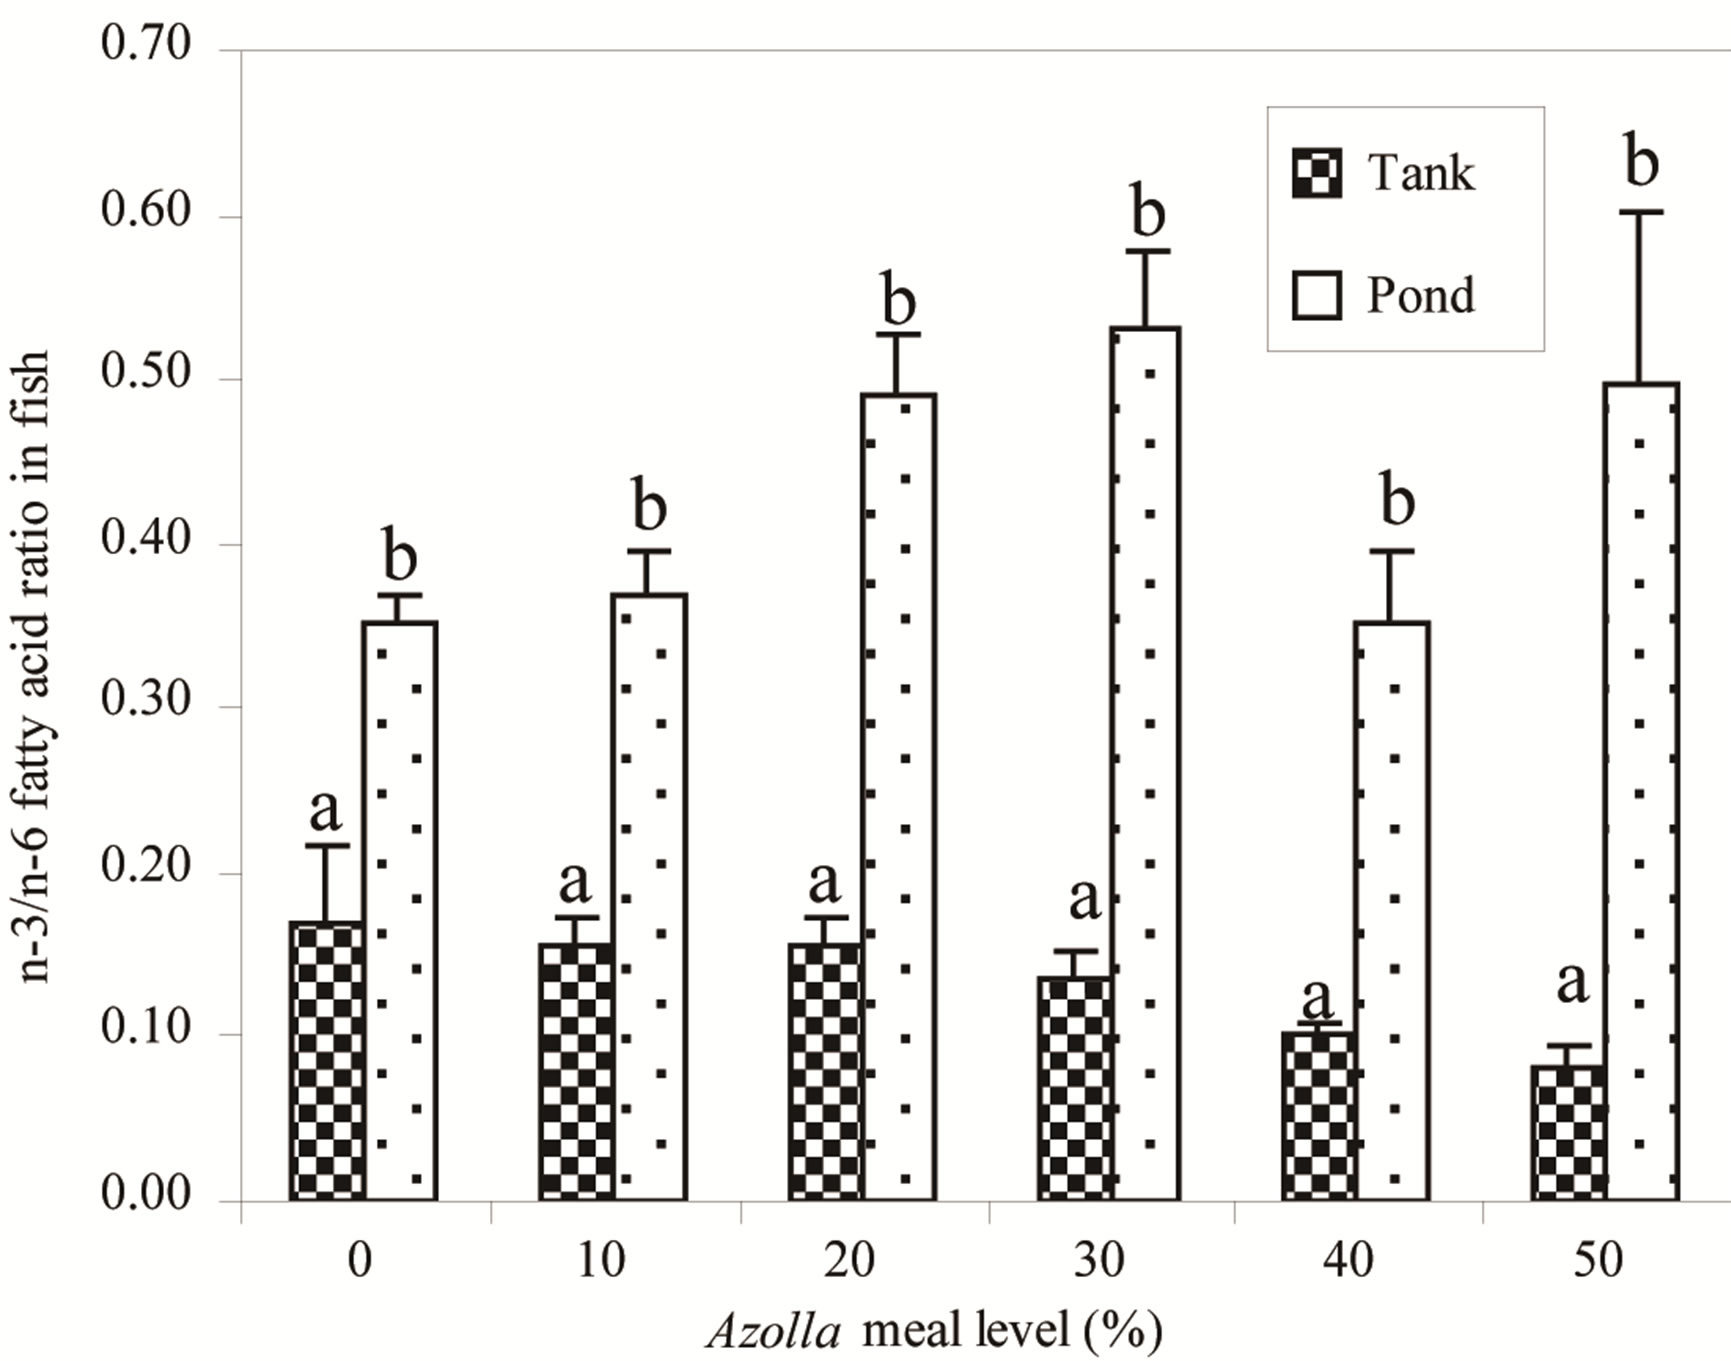
Figure 4. n-3/n-6 ratios in fatty acid of fish fed in tanks and in ponds with gradual Azolla meal level in diets. (a) and (b) For each Azolla meal level, bars with different letters are significantly different (P < 0.001).
plained above, fish size and water temperature were closely similar in both culture systems, and could not influence the variation in growth rates. Identical artificial feed was provided, based on fish biomass after each fortnight. Alternatively, the natural food available in ponds, mainly phytoplankton, zooplankton and other invertebrates, should be considered. Like other tilapias species, the Nile tilapia O. niloticus feeds permanently on plankton and indiscriminately on whatever is available in water bodies [32]. High filtration rate of phytoplankton by Nile tilapia was obtained in laboratory studies [33] while phytoplankton, zooplankton and other insects larvae constitute the main food resources found in the stomach of this fish under natural conditions [34]. Phytoplankton is reported to contain protein levels ranging from 12% to 35%, lipids ranging from 7.2% to 23%, and carbohydrates ranging from 8.2% to 8.7% on a dry matter basis [35]. Moreover, Albrecht & Breitsprecher [36] have reported that the mean protein, carbohydrate and lipid contents of fish food organisms could reach 511, 273 and 77 g∙kg−1 respectively, the energy value ranging from 6.7 to 23.8 kJ∙g−1. Many phytoplankton, zooplankton and invertebrates families are rich sources of amino acids, fatty acids, minerals [13-17] and vitamins. This high nutritional value of natural foods in ponds could partly balance any deficiency observed in artificial diets through additional proteins, amino acids, fatty acids, minerals and vitamins, and therefore improve growth of fish in ponds compared to those receiving only artificial food in tanks. Natural foods generally account for a large share of total fish growth. The growth in ponds was 54% to 75% higher than that in tanks, consistent with values of 50% to 80% reported by Schroeder et al. [18] in tilapia reared in a semi-intensive system, as the contribution of natural food. The contribution of natural foods seems to be higher in fish fed high AM levels in diets. Experimental ponds were newly constructed for the purpose of the study, and any management practices were applied.
Also, no differences were recorded in the quantity of natural foods, mainly chlorophyll a and zooplankton abundances, during the experiment. It had been proved that small tilapia filtered significantly more plankton than larger individuals [37-39]. And according to Schroeder [40], fish feed at lower trophic levels if their usual food becomes limited. Because of the lower growth in fish fed A30 to A50 diets in ponds, due to methionine and (n-3) fatty acids deficiencies, and relative lower digestibility of AM, the consumption of natural foods by fish fed in ponds receiving diets A30-A50 should be higher than those fed in ponds with diets A0-A20. In fact, the contribution of natural foods to growth of fish fed A30-A50 should therefore be higher.
As shown in Figure 2, fish fatty acid composition indicates significant variations. In fish fed in tanks, an influence of dietary fatty acids was shown, in agreement with several studies reporting on fatty acid composition of fish reared in controlled conditions [11,12,41]. Fatty acid profiles of fish reared in ponds were clearly different to those of fish fed in tanks, and seem less influenced by the diets. In tanks as in ponds, Euclidean distances between fish fatty acid profiles and the composition of their diets increased with AM in diets. It means that the more Azolla meal in diets, the less fish fatty acid profiles are similar to the one in the diets. The fatty acid mainly concerned in fish fed in tanks is arachidonic acid (20:4n-6) in fish fed A40 and A50 (Figure 2). This fatty acid is a product of an elongation and desaturation of linoleic acid (18:2n-6). Dietary fatty acid has no influence in fish fed high AM in ponds. Interestingly, high amounts of EPA (20:5n-3), clupanodonic acid (22:5n-3) and DHA (22:6n- 3) were found in fish fed A30, A40 and A50. Such composition of fish mirrors the fatty acid profiles of phytoplankton and zooplankton. Indeed, phytoplankton is known to contain high amount of EPA [14,42] whereas copepods and rotifers are rich sources of EPA and DHA [16,43,44]. It is worth noting that this fatty acid content in fish is consistent with our hypothesis on the reliance of fish fed more AM on natural foods, compared to those fed low AM. Our findings are in agreement with several reports that fish consuming natural foods are generally richer in eicosapentaenoic acid (EPA) and docosahexaenoic acid (DHA), which exert positive health effects for humans [45,46]. The proof was given in this study (Figure 4) by the higher values of the n-3/n-6 ratios in ponds compared to those in tanks for the same diets, showing that quality of fish produced in ponds is better than that produced in tanks.
5. CONCLUSION
From these experimental results, earthen ponds appeared to be better alternative to concrete tanks for production of Nile tilapia with Azolla-diets, through the presence of natural foods. Hence, taking into account the aforementioned aspects of the study, it can be recommended to raise Nile tilapia with Azolla-diets in ponds to improve growth and to enhance fatty acid composition of fish produced, for the well-being of consumers.
REFERENCES
- FAO (2006) The state of the world fisheries and aquaculture. FAO, Rome, 134.
- Fasakin, E.A., Balogun, A.M. and Fagbenro, O.A. (2001) Evaluation of Sun-Dried water fern, Azolla africana, and Duckweed, Spirodela polyrrhiza, in practical diets for Nile tilapia, Oreochromis niloticus, Fingerlings. Journal of Applied Aquaculture, 11, 83-92. doi:10.1300/J028v11n04_09
- Hossain, M.A., Focken, U. and Becker, K. (2002) Nutritional evaluation of dhaincha (Sesbania aculeata) seeds as dietary protein source for tilapia Oreochromis niloticus. Aquaculture Research, 33, 653-662. doi:10.1046/j.1365-2109.2002.00690.x
- Siddhuraju, P. and Becker, K. (2003) Comparative nutriational evaluation of differentially processed mucuna seeds [Mucuna pruriens (L.) DC. Var. utilis (wall exWight) Baker ex Burck)] on growth performance, feed utilization and body composition in Nile tilapia (Oreochromis niloticus L.). Aquaculture Research, 34, 487-500. doi:10.1046/j.1365-2109.2003.00836.x
- Afuang, W., Siddhuraju, P. and Becker, K. (2003) Comparative nutritional evaluation of raw, methanol extracted residues and methanol extracts of moringa (Moringa oleifera Lam.) leaves on growth performance and feed utilization in Nile tilapia (Oreochromis niloticus L.). Aquaculture Research, 34, 1147-1159. doi:10.1046/j.1365-2109.2003.00920.x
- Fiogbé, E.D., Micha, J.-C. and Van Hove, C. (2004) Use of a natural aquatic fern, Azolla microphylla, as a main component in food for Omnivorous phytoplanktonophagous tilapia, Oreochromis niloticus L. Journal of Applied Ichthyology, 20, 517-520. doi:10.1111/j.1439-0426.2004.00562.x
- Abou, Y., Fiogbé E.D. and Micha, J.-C. (2007) A preliminary assessment of growth and production of Nile tilapia, Oreochromis niloticus L., fed Azolla-based-diets in earthen ponds. Journal of Applied Aquaculture, 19, 55-69. doi:10.1300/J028v19n04_03
- Abou, Y., Fiogbé, E.D. and Micha, J.-C. (2007) Effects of stocking density on growth, yield, and profitability of farming Nile tilapia, Oreochromis niloticus L., fed Azolla-diet, in earthen ponds. Aquaculture Research, 38, 595-604. doi:10.1111/j.1365-2109.2007.01700.x
- Abou, Y., Fiogbe, E.D., Aina, M.P., Buldgen, A. and Micha, J.-C. (2010) Evaluation of nitrogen and phosphorrus wastes produced by Nile tilapia (Oreochromis niloticus L.) fed Azolla-diets in concrete tanks. International Journal of Biological and Chemical Sciences, 4, 42-50. doi:10.4314/ijbcs.v4i1.54229
- Kefatos, A., Diacatou, A., Voukiklaris, G., Nikolakakis, N., Vlachonikolis, J., Kounali, D., Mamalakis, G. and Dontas, A.S. (1997) Heart disease risk factor status and dietary changes in the Cretan population over the past 30 years: The Seven country study. American Journal of Clinical Nutrition, 65, 1882-1886.
- Maina, J.G., Beames, R.M., Mbugua, P.N., Iwama, G. and Kisia, S.M. (2003) Partial replacement of fishmeal with sunflower cake and corn oil in diets for tilapia Oreochromis niloticus (Linn): Effect on whole body fatty acids. Aquaculture Research, 34, 595-608.
- Williams, K.C., Paterson, B.D., Barlow, C.G., Ford, A. and Roberts, R. (2003) Potential of meat meal to replace fish meal in extruded dry diets for Barramundi, Lates calcarifer (Bloch). II. Organoleptic characteristics and fatty acid composition. Aquaculture Research, 34, 33-42. doi:10.1046/j.1365-2109.2003.00786.x
- Hallegraeff, G.M., Nichols, P.D., Volkman, J.K., Blackburn, S.I. and Everitt, D.A. (1991) Pigments, fatty acids, and sterols of the toxic dinoflagellate Gymnodinium catenatum. Journal of Phycology, 27, 591-599. doi:10.1111/j.0022-3646.1991.00591.x
- Sargent, J.R., Bell, M.V. and Henderson, R.J. (1995) Protists as sources of (n-3) polyunsaturated fatty acids for vertebrate development. Proceedings of the Second European Congress of Protistology, Clermont-Ferrand, 21-26 July, 54-64.
- Awaïss, A. and Kestemont, P. (1997) Dynamique de production et qualité nutritive du rotifère d’eau douce Brachionus calyciflorus. Aquatic Living Resources, 10, 111- 120. doi:10.1051/alr:1997012
- Drillet, G., Jørgensen, N.O.G., Sørensen, T.F., Ramløv, H. and Hansen, B.W. (2006) Biochemical and technical observations supporting the use of copepods as live feed organisms in marine larviculture. Aquaculture Research, 37, 756-772. doi:10.1111/j.1365-2109.2006.01489.x
- Bell, J.G., Ghioni, C. and Sargent, J.R. (1994) Fatty acid compositions of 10 freshwater invertebrates which are natural foods organisms of Atlantic Salmon parr (Salmo salar): A comparison with commercial diets. Aquaculture, 128, 301-313. doi:10.1016/0044-8486(94)90319-0
- Schroeder, G.L., Wohlfarth, G., Alkon, A., Halevy, A. and Krueger, H. (1990) The dominance of algal based food web in fish ponds receiving chemical fertilizers plus organic manures. Aquaculture, 86, 219-229. doi:10.1016/0044-8486(90)90115-4
- Shell, E.W. (1966) Comparative evaluation of plastic and concrete pools and earthen ponds in fish cultural research. Progressive Fish-Culturist, 28, 201-205. doi:10.1577/1548-8640(1966)28[201:CEOPAC]2.0.CO;2
- Jha, P., Barat, S. and Nayak, C.R. (2006) A comparison of growth, survival rate and number of marketable koi carp produced under different management regimes in earthen ponds and concrete tanks. Aquaculture International, 14, 615-626. doi:10.1007/s10499-006-9059-9
- Mélard, C. (1986) Biological bases for the intensive rearing of Nile Tilapia O. niloticus. Applied Ethology Notebooks, 5, 1-224.
- Folch, J., Lees, M. and Sloane-Stanley, G.H.S. (1957) A simple method for the isolation and purification of total lipids from animal tissues. Journal of Chemistry, 226, 497-509.
- Christie, W.W. (1982) Lipid analysis. Pergamon, Oxford, 207.
- Leonard, V. (1997) Use of an aquatic fern (Azolla filiculoides) in two species of tropical fish (Oreochromis niloticus and Tilapia rendalli). Ph.D. Thesis, Catholic University of Louvain, Louvain-la-Neuve.
- Tacon, A.G.J. (1990) Standard methods for the nutrition and feeding of farmed fish and shrimp. Argent Laboratories Press, Washington DC.
- APHA (1992) Standard methods for the examination of water and wastewater. 18th Edition, American Public Health Association, Washington DC.
- Hartley, H.O. (1959) Smallest composite designs for quadratic response surface. Biometrics, 15, 611-624. doi:10.2307/2527658
- Duncan, D.B. (1955) Multiple range and mulple F-tests. Biometrics, 11, 1-42. doi:10.2307/3001478
- Brett, J.R., Shelbourn, J.F. and Shoop, C.T. (1969) Growth rate and body composition of fingerling sockeye salmon, Onchorynchus nerka, in relation to temperature and ration size. Journal of the Fisheries Research Board of Canada, 26, 363-394. doi:10.1139/f69-230
- Brett, J.R. (1979) Factors affecting fish growth. In: Randall, H.D.J. and Brett, J.R., Eds., Fish Physiology, Academy Press, New York, 599-675.
- Jobling, M. (1983) Influence of body weight and temperature on growth rates of Atlantic charr, Salvelinus fontinalis L. Journal of Fish Biology, 22, 471-475. doi:10.1111/j.1095-8649.1983.tb04767.x
- Tudorancea, C., Fernando, C.H. and Paggi, J.C. (1988) Food and feeding ecology of Oreochromis niloticus (Linnaeus, 1758) juveniles in Lake Awassa (Ethiopia). Archiv für Hydrobiology, 79, 267-289.
- Turker, H., Eversole, A. and Brune, D.E. (2003) Effect of temperature and phytoplankton concentration on Nile tilapia Oreochromis niloticus (L.) filtration rate. Aquaculture Research, 34, 453-459. doi:10.1046/j.1365-2109.2003.00830.x
- Zenebe, T., Ahlgren, G., Gustafsson, I.-B. and Boberg, M. (1998) Fatty acid and lipid content of Oreochromis niloticus L. in Ethiopian lakes-dietary effects of phytoplankton. Ecology of Freshwater Fish, 7, 146-158. doi:10.1111/j.1600-0633.1998.tb00181.x
- Kang’ombe, J., Brown, J.A. and Halfyard, L.C. (2006) Effect of using different types of organic animal manure on plankton abundance, and on growth and survival of Tilapia rendalli (Boulenger) in ponds. Aquaculture Research, 37, 1360-1371. doi:10.1111/j.1365-2109.2006.01569.x
- Albrecht, M.L. and Breitsprecher, B. (1969) Investigations on the chemical composition of fish forage and animal feed. Z-Fish N.F., 17, 143-163.
- Bowen, S.H. (1979) A nutritional constraint in detrivory by fishes: The stunted population of Oreochromis mossambicus in Lake Sibaya, South Africa. Ecological Monographs, 49, 17-31. doi:10.2307/1942570
- Saha, S.N. and Dewan, S. (1979) Food and feeding habits of Oreochromis niloticus. I. Types and amount of food taken by the fish and its size and patterns of feeding. Bangladesh Journal of Zoology, 7, 53-60.
- Brummett, R.E. (1995) Weed control by adult and juvenile Tilapia rendalli in rainfed ponds. NAGA, 18, 25-28.
- Schroeder, G.L. (1980) The breakdown of feeding niches in fish ponds under natural conditions of severe competetion. Bamidgeh, 32, 20-24.
- Bahurmiz, O.M. and Ng, W.-K. (2007) Effects of dietary palm oil source on growth, tissue fatty acid composition and nutrient digestibility of red hybrid tilapia, Oreochromis sp., raised from stocking to marketable size. Aquaculture, 262, 382-392. doi:10.1016/j.aquaculture.2006.11.023
- Dunstan, G.A., Volkman, J.K., Barrett, S.M., Leroi, J.-M. and Jeffrey, S.W. (1994) Essential polyunsaturated fatty acids from 14 species of diatoms (Baccillariophyceae). Phytochemistry, 35, 155-161. doi:10.1016/S0031-9422(00)90525-9
- Kebede, E., Getachew, T., Taylor, W.D. and Gebremariam, Z. (1992) Eutrophication of lake Haiq in the Ethiopian highlands. Journal of Plankton Research, 14, 1473-1482. doi:10.1093/plankt/14.10.1473
- Awaïss, A., Kestemont, P. and Micha J.-C. (1996) Fatty acid profiles of two freshwater fish larvae (gudgeon and perch) reared with Brachionus calyciflorus Pallas (rotifer) and/or dry diet. Aquaculture Research, 27, 651-658.
- Holman, R.T., Johnson, S.B., Bibus, D.M., Okeahialem, T.C. and Hegwim, P.O. (1996) High omega-3 essential fatty acid status in Nigerians and low status in Minnesotans. World Wide Web Journal of Biology, 2.
- Leaf, A. and Kang, J.X. (1998) Omega 3 fatty acids and cardiovascular disease. World Review of Nutrition and Dietetics, 83, 24-37. doi:10.1159/000059667