Health
Vol. 4 No. 12A (2012) , Article ID: 26102 , 14 pages DOI:10.4236/health.2012.412A212
Obesity trends in Russia. The impact on health and healthcare costs
![]()
1Modelling Department, Micro Health Simulations, London, UK; *Corresponding Author: ketevan.rtveladze@heartforum.org.uk
2Department of Social Research, Population Research Unit, University of Helsinki, Helsinki, Finland
3The London School of Hygiene and Tropical Medicine, London, UK
4Department of Primary Prevention in Primary Care, National Research Center for Preventive Medicine, Moscow, Russia
5Department of Internal Disease No. 2, Therapeutic Faculty, Russian State Medical University (RSMU), Moscow, Russia
6New College, University of Oxford, Oxford, UK
Received 22 October 2012; revised 29 November 2012; accepted 5 December 2012
Keywords: Obesity; Trends; Russia; Health; Healthcare; Costs
ABSTRACT
Similar to most developed countries, obesity rates in Russia have been steadily increasing. This has led to a high burden of obesity related diseases and associated healthcare costs. The micro-simulation model has been utilized to project body mass index (BMI) and BMI related disease burden and healthcare costs. Incidence, mortality, survival and healthcare costs were collected for thirteen diseases. The results have been simulated for 3 hypothetical scenarios to project a potential impact of policy interventions: 1) assuming no reduction in BMI; 2) 1% reduction in mean BMI across the population; 3) 5% reduction in mean BMI across the population. Nearly 58% of the female population was obese (BMI ≥ 30 kg/m²) or overweight (BMI 25 - 29.9 kg/m²) in 2010, and the prevalence is projected to decrease to 54% in 2050. The rates are predicted to increase for men from 51% in 2010 to 76% in 2050. The prevalence rates will triple for some obesity-related diseases. A one percent decrease in BMI across the population will save more than two billion US Dollars in 2030 and 2050. Despite female obesity prevalence starting at a higher point than the men, obesity is predicted to increase in males but not females. Disease and economic burden attributed to these obesity rates are still severe and the country should implement strong policies to tackle the obesity epidemic.
1. INTRODUCTION
Since the collapse of the Soviet Union and emergence of the Russian Federation in 1991, the country has faced a significant number of public health challenges both as a consequence of the transition from a state funded health system to a predominantly privately supported system, and through the rise in risk behaviours and conditions such as obesity, smoking and alcohol consumption [1]. Studying the health of the Russian population is compounded by a number of factors. For instance men have very low life expectancy for a country of its wealth [2,3]. Similar to most developed countries the obesity rates in Russia have been on a steady increase. In 2004 overweight persons were more likely to become obese compared with the probability in 1995 [4]. This rise has led to a rise in the prevalence of diseases commonly associated with obesity. In 2000 the World Health Organisation (WHO) has listed Russia among the top 10 countries with the highest numbers of estimated cases of diabetes [5]. Ischemic heart disease is a leading cause of mortality in Russia [1]. Coronary heart disease (CHD) rate is double that found in many European countries [6]. Although these high rates are certainly in part a consequence of high rates of smoking and alcohol [7-11]. Obesity is also certainly implicated in the rise in rates of these diseases [12-15].
Ageing and sedentary lifestyle have certainly contributed to the growth of obesity, but dietary change and an economic transition could be the main causes for obesity growth in the Russian Federation. Russia is one of the most geographically diverse countries in the world (spanning nine time zones [16]) where the food consumption patterns vary much within regions. Severe climate could explain low fruit and vegetable consumption and reliance on meat and high protein and fat [12-14]. However for many, it is argued that, fruit and vegetables are easily accessible for a reasonable price and the main reason is the change in the traditional dietary pattern to a more westernised diet.
The dietary factors are considered to be the one of the main reasons for arterial hypertension [1,17]. In the former Soviet Union, diets were rich in meat, fish and dairy products [1], often higher than the recommended dose [18]. As a consequence of “price shocks” following the dissolution of the soviet Union, couple with enhanced unemployment and poverty, people tended to buy cheaper products and consumption of potatoes increased considerably. As a result, obesity rates have increased since 1994 [13,14] affecting more females than males [13,19]. The average individual BMI in 2004 was 1.2 units higher than in 1994 (27.4 vs 26.2) [13].
Despite the current disadvantageous health profile, an improvement in cardiovascular disease (CVD) mortality was observed in Russia [20]. The CVD rates reduced significantly in 1986 due to a new alcohol policy and more recently, due to economic improvements in 1998 [10,11,19]. Since 2005, a clear decreasing trend in CVD mortality has been observed [21], although CHD mortality rates still remaining high [6] this may be linked to obesity growth. Stroke and myocardial infarction mortality among men is increasingly associated with metabolic syndrome [22]. The role of nutrition was also connected to some cancers [19].
This is the first paper examining the consequences of body weight on Russia and the objective is to examine the impact of BMI change on the health profile of the country; its consequences on multiple diseases as well as potential healthcare costs. The authors also examine the effect of achievable obesity decreases on disease and economic burden which in turn can be used for policy planning and intervention.
2. METHODS
2.1. Disease Data Collection and Calculations
Multiple online resources have been searched both in English and Russian languages. In order to project the obesity trends in Russia, BMI data was taken from the best available, nationally representative data RLMS-HSE. The RLMS-HSE, a household-based survey series is designed to observe the consequences of reforms on the health and economic wellbeing of the Russian population [23]. The data from 1995 to 2009, in total 13 data points has been used for the purposes of this study1. Statistical Package for the Social Sciences (SPSS) was used to unpack the material. The data manipulation method is described in the appendix 1. We categorised BMI data into three categories: not overweight, (≤24.9 kg/m2, also includes underweight population), overweight (25 - 29.9 kg/m2), and obese (≥30 kg/m2). The BMI data is selfreported rather than measured which leads to potential anomalies which will be discussed later.
2.2. Statistical Methods
We undertook a two-part modelling process developed by Micro Health Simulations (MHS) based on the methods initially developed for the UK Foresight Tackling Obesities enquiry [24-26]. The first module implements a regression analysis based on a series of RLMS-HSE data. The second module implements a micro-simulation programme to produce longitudinal projections. In the first module we fit multivariate, categorical regression models to the cross-sectional BMI data series by sex. We included age and calendar year as covariates, and constrained the predicted proportions of population in each BMI category. We simulated five million individuals by sex and scaled up the simulated population to reflect the total population size in the population. The 95% confidence intervals for the projected prevalence were calculated from the Bayesian Posterior distribution of the regression parameters.
2.3. Micro-Simulation of Obesity and Related Disease Consequences
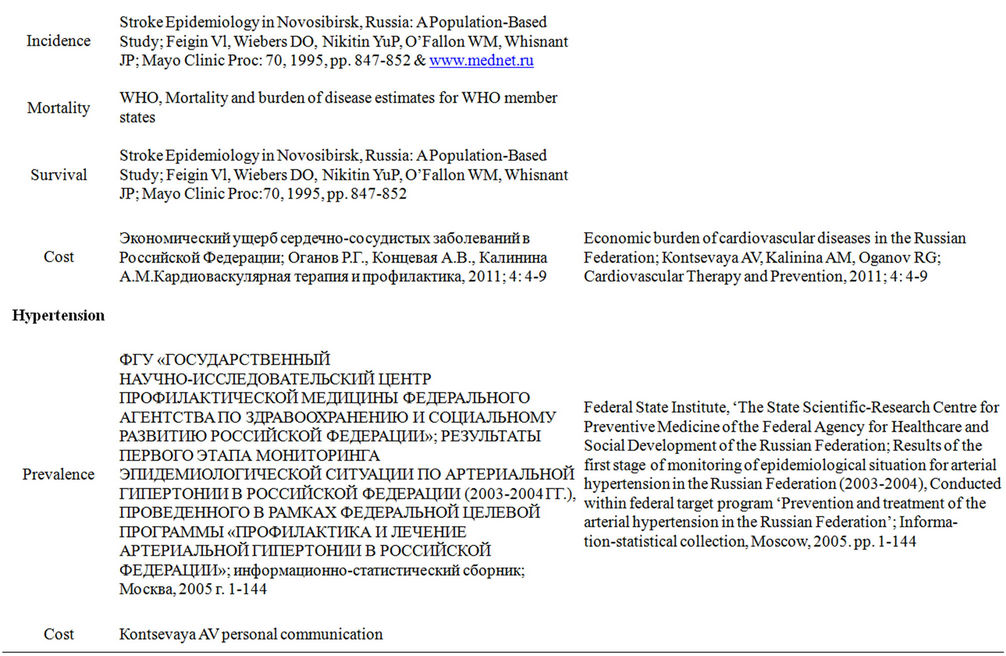
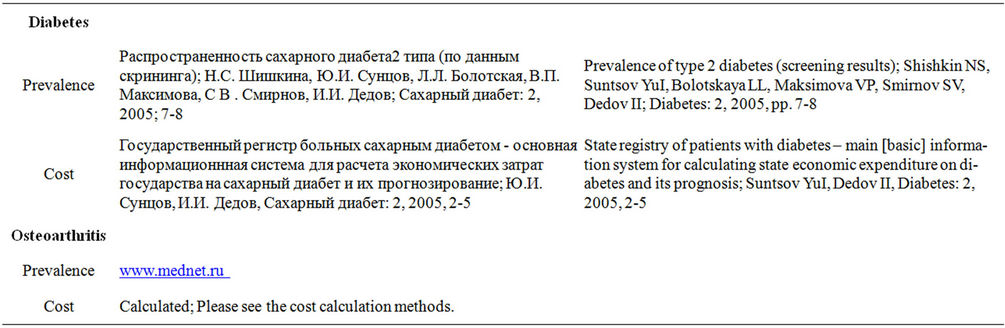
Within the Foresight micro-simulation framework [24- 26], we created a virtual cohort of Russian individuals based on the projected BMI distributions 2010-2050. We probabilistically assigned the BMI values as a function of age, sex, and calendar year. Assuming one’s BMI ranking (i.e. percentile) in the same-age cohort remains constant overtime, we longitudinally simulated the BMI trajectories of a large number of individuals as they age. Size and age distributions are based on published projections from the United Nation Population database [27] and every year, each simulated individual in the model had a probability of getting a specific disease if he or she was free of the disease at the beginning of the year. This risk is predetermined by age, sex, and BMI. For individuals with a disease, possible outcomes are recovery, continuation of the disease, or death from a particular disease or unspecified cause. The progress of any disease was determined by the appropriate survival and casefatality statistics. A review of the epidemiological literature was undertaken to determine the country-specific incidence, case fatality rates, and approximate annual treatment costs for the following obesity-related diseases: type two diabetes, coronary heart disease, stroke, knee osteoarthritis and obesity-related cancers2 by age and sex. Relative risk of disease is taken from a systematic review of the epidemiological literature [28].
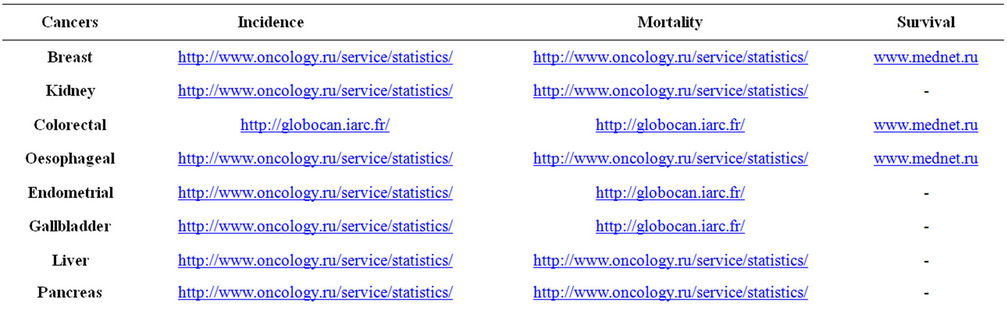
For the micro-simulation, incidence, mortality and disease survival data were collected where appropriate (Appendices 4-5). Obtaining reliable data for cancer survival was a particular challenge. We were able to obtain survival for only three cancers3; for other cancers the UK survival rate has been used assuming that it would be the same in Russia. The rectal cancer figure has been applied to the colorectal cancer. As we do not model colon and rectal cancers separately, and the mortality and incidence of these two conditions have been simply added. Because of the low prevalence of these cancers employment of this method should not unduly bias the results.
In the micro-simulation we usually use the disease incidence rather than prevalence rate to produce the outputs. For some diseases we were only able to obtain prevalence figures. We used prevalence to calculate the incidence for the diabetes and hypertension in this case. For a person aged ak with gender s in year k we identify the following probabilities: p0(k) denotes the probability of being alive without disease d in year k, p1(k) denotes the probability of being alive with disease d in year k and p2(k) denotes the probability of being dead in year k, pWk denotes the probability of dying from disease d in year k (gender s, age ak) and pwk denotes the probability of dying from a cause other than disease d in year k (gender s, age ak).
The probabilities of being alive with or without the disease (states 0 and 1) and being dead (state 2) are given by the recursive matrix equation:
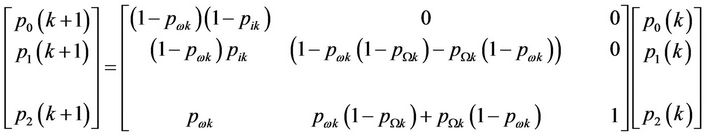
Every column in this equation separately sums to unity. We suppose that we know the death statistics pWk and pwk. If the incidence statistics are known the equation allows the calculation of prevalence p1(k). And, with a little rearrangement, if the prevalence is known the equation allows calculation of the incidence. A slightly more complex version of this equation will allow for the inclusion of remission statistics—when these are known (remission statistics allow for the transition from state 1 to state 0). Like most life table statistical calculations it is assumed that the input statistics valid in some year Y are valid for all years k of the lifespan of the implicit pseudo cohort.
Though CVD is considered as one of the major causes of mortality in Russia, incidence data was difficult to obtain. Our program incorporates only data by sex and age. For many conditions only absolute incidence numbers were available. We believe that our CHD figures are underestimated as the mortality rates we have extrapolated from the charts are twice as low as from the WHO and include only acute ischemic heart disease (IHD). For stroke data we have used the paper with the detailed data from the 1980s [29] and applied the ratios to the absolute figure for 2006 [30]. The WHO figures have been used for the stroke mortality data. Only 30 days of case fatality was available for stroke, therefore, we have used it as one year survival. The knee osteoarthritis (OA) figures were not available by age or sex (data from 2008). In order to calculate the incidence ratios among men and women (by age groups), ratios from the UK have been used4 [31]. As the Russian data was an absolute osteoarthritis incidence rate (not just the knee), the ratio for OA was applied to that number, then men-women ratio was calculated and at last, the incidence rates within the age groups was estimated.
2.4. Disease Costs
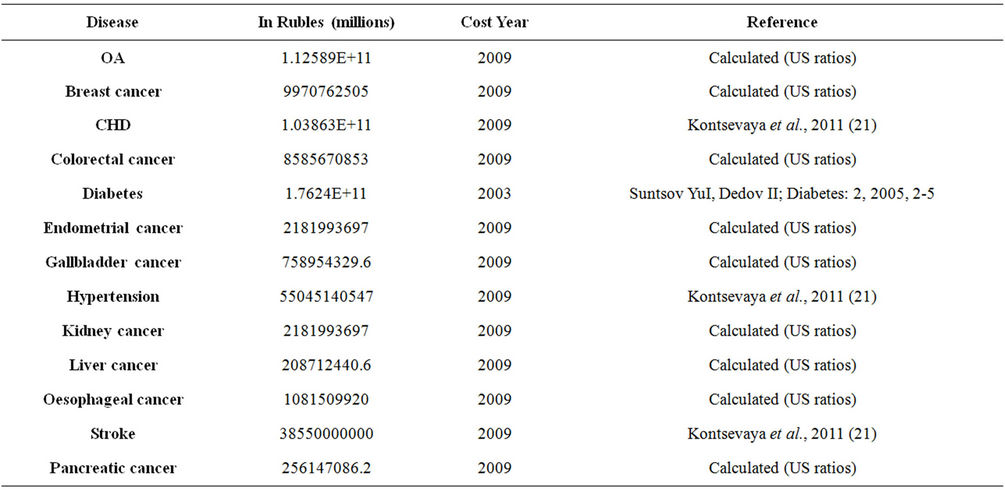
There is scarce literature available for the costs of health care in the Russian Federation. We were able to obtain total health care cost of diabetes and CVD. Despite extensive literature searches no reliable cancer costs could be obtained. For a more precise calculation of cancer and knee osteoarthritis costs the following method was been used: CHD cost was taken as a constant and reliable number. The ratios of the US health care costs [32] were applied to calculate costs for OA, breast cancer, kidney cancer, oesophageal cancer, endometrial cancer, gallbladder cancer, liver cancer and pancreatic cancer. These aggregated values were then divided by the total number of patients at baseline to estimate annual medical cost per case. As the costs were not all the same year, they were brought up to the same year for consistency. That is, diabetes cost was inflated for 20095 and applied to the model. We probabilistically assigned diseases and associated costs in all subsequent years as a function of the individual BMI trajectories using a Monte-Carlo simulation method [33]. Costs are presented in millions of US Dollars. Initially, the costs were projected in Russian Rubles and then converted to US Dollars6. The cost input data is presented in appendix 3.
3. RESULTS
3.1. The BMI Distribution
After creating the population profile for the Russian Federation, the BMI database has been utilized within the program. Tables 1 and 2 represent the BMI distribution among the male and female population of Russia. In Table 2, the age groups were aggregated and as seen, the prevalence of BMI ≥ 25 kg/m2 among females is decreasing steadily. The opposite picture is observed among males. Our calculations show that 75% of men will be obese or overweight by 2050. Whether this really will be the case is difficult to predict as there will be a number of confounding factors, but clearly the trend represents a significant growth. Detailed five year age group projections have shown that obesity among all male adults goes up; the overweight and obesity rates increase within all age groups. Distribution of normal weight among women aged 20 - 49 is increasing, and as a consequence, overweight and obesity percentage goes down. Another exception is the group of women aged 60 - 69, where we see improvement of the BMI distribution. Overweight and obese women aged 50 - 59 and 70 - 79 outnumber the normal weight females (tables 1 and 2).
3.2. The Micro-Simulation
Projecting BMI distribution was the first part of the project. After applying the distribution trend to the population, we have extrapolated 13 BMI related diseases. Prevalence of each disease was projected until 2050 assuming there would be no change in the BMI distribution. In Table 3 eight cancers have been grouped as well as CHD and stroke. The prevalence numbers nearly double for all conditions. For example, hypertension was projected to be 18,833 cases per 100,000 reaching 36,438 only in 2050. The numbers triple for type two diabetes (from 1345 to 3301), knee osteoarthritis as well as for cancers, CHD and stroke. Please note that all the numbers represent untreated cases. See table 3.
A slight change in the BMI distribution could have an effect on disease burden. The BMI distribution reported in this paper was simulated for three scenarios; scenario zero—unrestricted BMI growth as predicted; scenario one: one percent BMI reduction in 2010 relative to scenario zero and scenario 2: 5 percent BMI reduction in 2010 relative to scenario zero. We believe that a one percent decrease is achievable with the correct public health interventions. The modelling process highlights the very large impact that a just a small change in BMI can have upon obesity and disease rates. A five percent decrease is more difficult but certainly achievable provided enough interventions are implemented. Each simulation consisted of five million Monte-Carlo trials. Five million interactions were used to obtain more robust simulations and eliminate uncertainties. See table 4.
The disease healthcare costs were also projected for cancer, CHD and stroke costs along with all 13 diseases for three scenarios (Table 5). Cancer costs will increase from $801 million to $1.3 billion in 2030 and to $2.1 billion in 2050, CHD and stroke costs will increase between $6.5 to $17.4 billion in 2050. For all modelled diseases costs are projected to increase to $48 billion in 2050 from $20 in 2010. Changes in obesity rates could save billions of US Dollars. One percent decrease in BMI will save $2.3 billion in 2050 and a 5 percent reduction in BMI will reduce the health care cost by $5.3 billion. Our modelling method does not consider applying discount rates; therefore, it has not been applied to these figures. For the presentation purposes the cost of the hypertension, knee osteoarthritis and type two diabetes have been aggregated and presented in the table 5.
4. DISCUSSION
The results from this study show that despite female obesity rates starting at a higher point than the rates among men, obesity prevalence is predicted to increase among the male population of Russia, and not among females. It is difficult to explain the BMI distribution differences among various age groups among women. The decreasing patterns of obesity can be explained by possible underreporting from the female population. There is social desirability amongst women to be slimmer than men and overweight and obese women are more likely to underreport their weight than men [34]. Some of the studies found that older women are more likely to underreport body weight than younger females [35,36], but some found no link between age and underreporting [37,38]. Monteiro and colleagues argue that improving living standards in middle income countries have a different effect on BMI of men and women: clearly negative for women, and mixed to positive for men. Projected trends may be explained by this theory since the living standards in Russia have been improving for some time [39].
We have analysed the demographic changes according to United Nations (UN) population data [27]. Since the
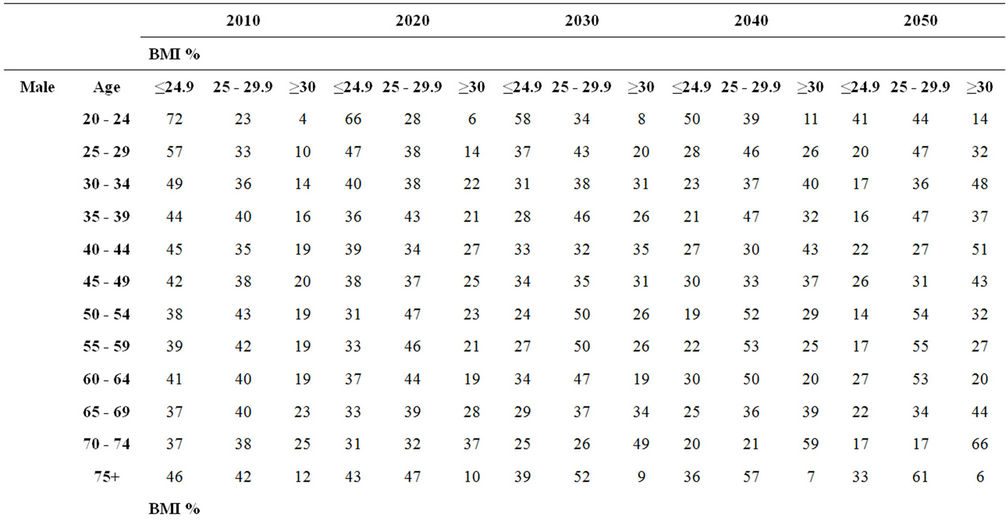
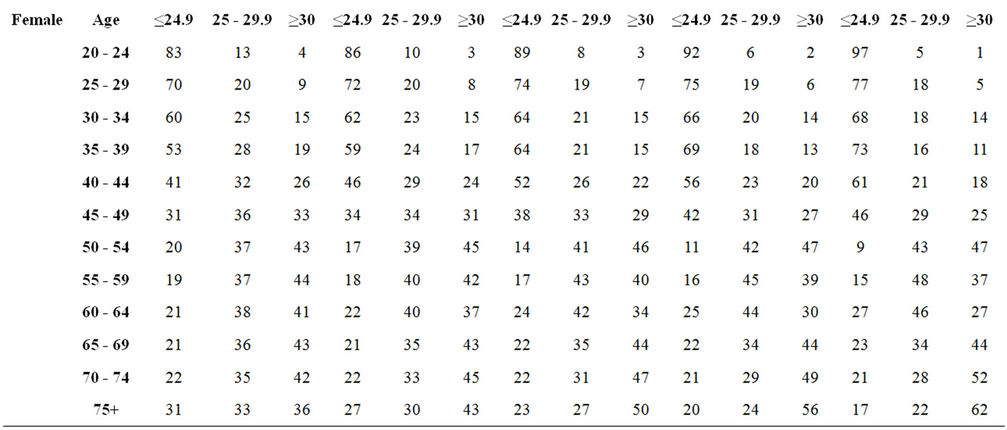
Table 1. Projected distribution of BMI by age group and BMI group.
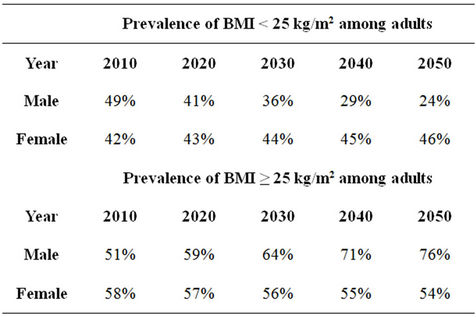
Table 2. Projected prevalence of BMI among adults.
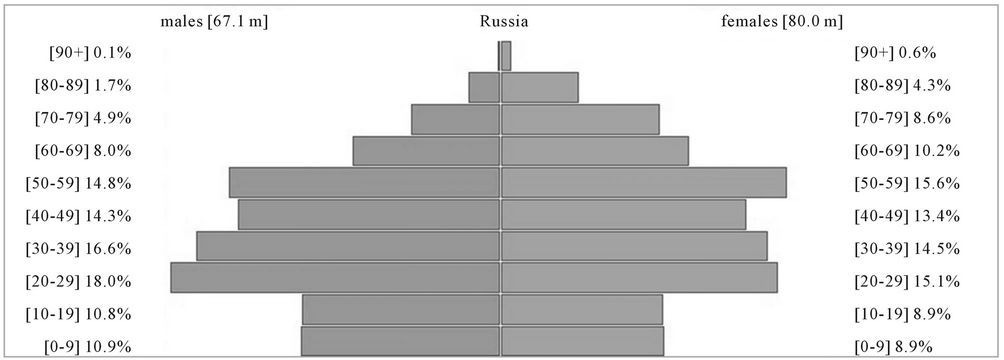
dissolution of the Soviet Union in 1991 low birth rates and abnormally high death rates caused the Russian population to decline [1]. As a consequence there are an unusually small number of young people in Russia which will have a significant impact upon the future burden of diseases and subsequently, the health system as these young people enter middle age. Recent evidence suggests that in 2009 the Russian population began to grow for the first time in fifteen years [40]. The effects of the low life expectancy amongst men are also evident from the pyramid with a sharp decrease between the 50 - 59 and 60 - 69 groups (appendix 2).
During the incidence data collection authors encountered a number of problems with the databases. We
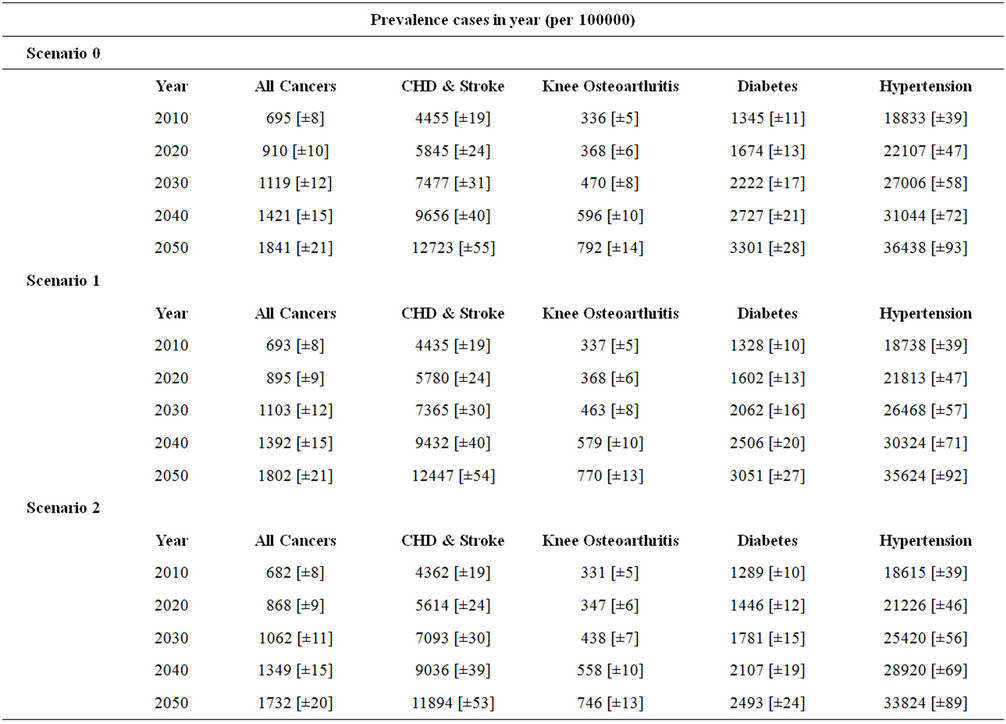
Table 3. Projection of disease prevalence based on current trend. Numbers in square brackets indicate confidence intervals. Eight cancers have been grouped under the title: All Cancers.
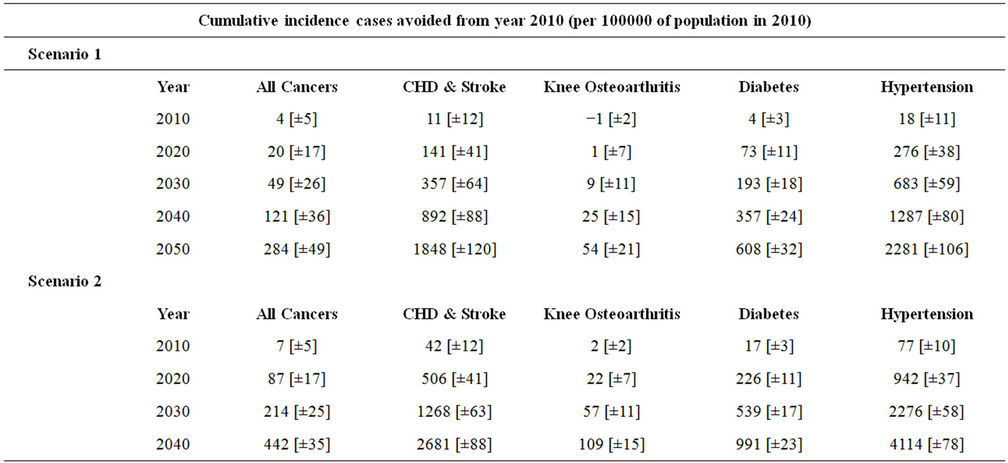
Table 4. Projection of BMI-related cumulative incidence cases avoided among all adults (relative to scenario 0). Numbers in square brackets indicate confidence intervals.
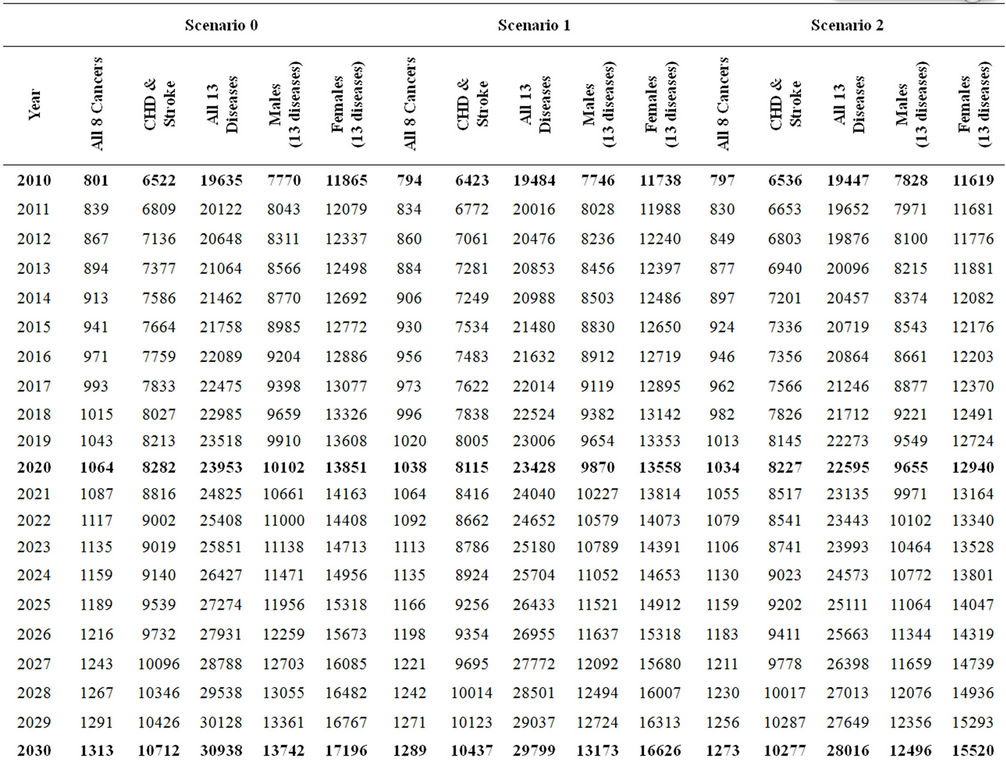
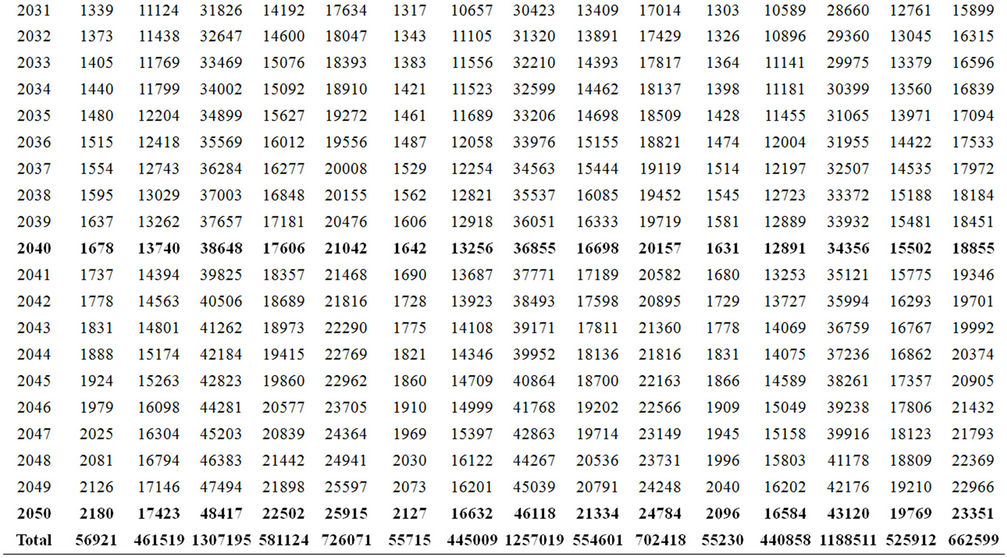
Table 5. Estimated disease healthcare costs under 3 scenarios (USD).
believe that cancer, stoke, hypertension, knee osteoarthritis and type two diabetes incidence/prevalence data is accurate, reliable and represents the real picture despite some calculations carried out during the study. However, CHD incidence rates were not available, and as noted before, the data has been drawn from the acute IHD rates which lead to potential underestimation of the projected rates. The rates are likely to be much higher in Russia, due alcohol consumption rather than obesity.
The micro-simulation approach presents a unique opportunity to look at the BMI trends and BMI attributed disease burden, its costs and the impact of attenuating those trends in whole or segments of the population. However, this method, like all modelling, is dependent on the quality of the data inputs. Whilst there are clearly limitations in the availability of data to us as researchers, we feel that the value of the outputs in quantifying the future impact of obesity to the Russian Federation overcomes these limitations. The analysis carried out in this research clearly demonstrates the considerable benefits of even small changes in BMI at a population level; one point reduction is certainly not over ambitious, however our simulation can be used to show benefits of particular interventions. The Organisation for Economic Co-operation and Development (OECD), however, evaluated the cost-effectiveness of various prevention programmes in Russia and concluded th!at some of them are effective and could save up to 95,000 lives every year. Nevertheless, the most effective interventions are more costly and they are cost-effective in the long run but not in short. In fact, food labelling or fiscal measures will make a return short after the implementation. More lives could be gained by complex prevention programmes which would cost 1.18 USD per head annually [41].
The study has several limitations due to poor quality data and data scarcity. In this study we have had to rely on self-reported BMI data rather than the more objective measured anthropometric data which is more costly to obtain. Self-report may bias the results as height and weight is often misreported (Visschler et al., 2006) and unfortunately it was not possible for us to correct for this [35]. Nevertheless, until more suitable data exist these type of data must be employed for calculating and assessing health care costs by Government agencies. It can help shape the health care system and disaggregate the funds to a more vulnerable sphere. The Russian Federation might have costs for each disease however, they were limited to public access, thus we had to carry multiple calculations to estimate some cancer and knee osteoarthritis costs. Obviously, we cannot require having costs for all the diseases we model, but some cancers carry out a vast burden of health care costs, and they cannot be ignored.
Our work demonstrates the value that the availability of good health and economic data to policy makers could have in determining the future burden and benefit of policies to prevent the future incidence of avoidable chronic diseases. It is of course both possible and plausible that data exist within Governments that are not accessible to researchers. We hope that the value of this work will demonstrate the need to make all data more widely available. A further analysis of the different data sets will be a valuable contribution to the obesity research.
5. ACKNOWLEDGEMENTS
The authors would like to thank GlaxoSmithKline for providing a non-discretionary educational grant to fund this project. Also Higher School of Economics, ZAO “Demoscope”, Carolina Population Center, University of North Carolina and the Institute of Sociology Russian Academy of Sciences for granting permission to use the Russia Longitudinal Monitoring Survey-Higher School of Economics (RLMS-HSE) survey data.
REFERENCES
- The World Bank (2005) Dying too young; addressing premature mortality and ill health due to non-communicable diseases and injuries in the Russian Federation. Europe and Central Asia Human Development Department, 1-31.
- The World Health Orgamization (2010) World Health Statistics, 1-177. http://www.who.int/whosis/whostat/EN_WHS10_Full.pdf
- Shkolnikov, V., Mckee, M. and Leon, D.A. (2001) Changes in life expectancy in Russia in the mid-1990s. The Lancet, 357, 917-921. doi:10.1016/S0140-6736(00)04212-4
- Huffman, S.K. and Rizov, M. (2009) The rise of obesity in transation: Theory and empirical evidence from Russia. International Association of Agricultural Economists Econference, Beijing, China.
- Wild, S., Roglic, G., Green, A., Sicree, R. and King, H. (2004) Global prevalence of diabetes: Estimates for the year 2000 and projections for 2030. Diabetes Care, 27, 1047-1053. doi:10.2337/diacare.27.5.1047
- The World Health Organization (2008) Deaths estimates for 2008 by cause for WHO Member States. http://www.who.int/healthinfo/global_burden_disease/estimates_country/en/index.html
- Leon, D.A., Saburova, L., Tomkins, S., Andreev, E., Kiryanov, N., McKee, M. and Shkolnokov, V. (2007) Hazzardoes alcohol drinking and premature mortality in Russia: A population based case-control study. The Lancet, 369, 2001-2009. doi:10.1016/S0140-6736(07)60941-6
- Leon, D.A., Chenet, L., Shkolnikov, V.M., et al. (1997) Huge variation in Russian mortality rates 1984-94: Artefact, alcohol, or what? The Lancet, 350, 383-388. doi:10.1016/S0140-6736(97)03360-6
- Saburova, L., Keenan, K., Bobrova, N., Leon, D.A. and Elbourne, D. (2011) Alcohol and fatal life trajectories in Russia: Understanding narrative accounts of premature male death in the family. BMC Public Health, 11, 1-10. doi:10.1186/1471-2458-11-481
- Zaridze, D., Brennan, P., Boreham, J., et al. (2009) Alcohol and cause-specific mortality in Russia: A retrospective case-control study of 48,557 adult deaths. The Lancet, 373, 2201-2222. doi:10.1016/S0140-6736(09)61034-5
- Zaridze, D., Maximovitch, D., Lazarev, A., et al. (2009) Alcohol poisoning is a main determinant of recent mortality trends in Russia: Evidence from a detailed anaylysis of mortality statistics and autopsies. International Journal of Epidemiology, 38, 143-153. doi:10.1093/ije/dyn160
- Ginter, E. (1995) Cardiovascular risk factors in the former communist countries. European Journal of Epidemiology, 11, 199-205. doi:10.1007/BF01719488
- Huffman, S.K. and Rizov, M. (2007) Determinants of obesity in transition economies: The case of Russia. Economics and Human Biology, 5, 379-391. doi:10.1016/j.ehb.2007.07.001
- Liefert, W. (2004) Food security in Russia: Economic growth and rising incomes are reducing insecurity. Food security. Assessment, USDA, Washington.
- Jahns, L., Baturin, A. and Popkin, B. (2003) Obesity, diet, and poverty: Trends in the Russian transition to market economy. European Journal of Clinical Nutrition, 57, 1295-1302. doi:10.1038/sj.ejcn.1601691
- The Governmental Order of the Russian Federation (2011) About structure of the territories forming each hour zone, and the order of calculation of time in hour zones. http://www.garant.ru/hotlaw/federal/346568/
- Brainerd, E. and Cutler, D. (2005) Autopsy on an Empire: Understanding Mortality in Russia and the Former Soviet Union. Journal of Economic Perspectives, 19, 107-130. doi:10.1257/0895330053147921
- Kisseleva, N.G. (1998) Inception report: Preventive health care. Nutrition, Annex 7.3/2.
- Shkolnikov, V.M., Andreev, E.M., Leon, D.A., McKee, M., Meslé, F. and Vallin, J. (2004) Mortality reversal in Russia: The story so far. Hygiea Internationalis, 4, 29-80. doi:10.3384/hygiea.1403-8668.044129
- The World Health Organization (2011) European health for all database. http://data.euro.who.int/hfadb/
- Коntsevaya, A.V., Kalinina, A.M. and Oganov, R.G. (2011) Economic burden of cardiovascular diseases in the Russian Federation. Cardiovascular Therapy and Prevention, 4, 4-9.
- Sidorenkov, O., Nilssen, O. and Grjibovski, A.M. (2010) Metabolic syndrome in Russian adults: Associated factors and mortality from cardiovascular diseases and all causes. BMC Public Health, 10, 3-10. doi:10.1186/1471-2458-10-582
- Russia Longitudinal Monitoring Survey, RLMS-HSE (2011) Conducted by HSE and ZAO “Demoscope” together with Carolina Population Center, University of North Carolina and Chapel Hill and the Institute of Sociology RAS. http://www.hse.ru/org/hse/rlms
- Kopelman, P., Jebb, S.A. and Butland, B. (2007) Executive summary: Foresight ‘Tackling Obesities: Future Choices’ project. Obesity Reviews Suppl, 8, 6-9.
- Butland, B., Jebb, S., Kopelman, P., et al. (2007) Foresight. Tackling obesities: Future choices—Project report. Government Office for Science, London, 1-161.
- McPherson, K., Marsh, T. and Brown, M.F. (2007) Tackling obesities: Future choices—Modelling future trends in obesity & their impact on health. Government Office for Science, London, 1-71
- Population Division of the Department of Economic and Social Affairs of the United Nations Secretariat (2011) World Population Prospects: The 2010 Revision. http://esa.un.org/unpd/wpp/index.htm
- Lobstein, T. and Leach, R.J. (2010) Workpackage 7: Report on data collection for Overweigth and Obesity. Data documentation for the Dynamic Modelling for Health Impact Assessment (DYNAMO-HIA) Project. http://www.dynamo-hia.eu/
- Feigin, V.L., Wiebers, D.O., Nikitin, Yu.P., O’Fallon, W.M. and Whisnant, J.P. (1995) Stroke epidemiology in Novosibirsk, Russia: A population-based study. Mayo Clinic Proceedings, 70, 847-852.
- Central Research Institute of Organization and Healthcare Information (2011) www.mednet.ru
- Arthritis Research UK (2010) Arthritis. The Big Picture, 1-22. http://www.ipsos-mori.com/Assets/Docs/Archive/Polls/arthritis.pdf
- Wang, C.Y., McPherson, K., Marsh, T., Gortmaker, S.L. and Brown, M. (2001) Health and economic burden of the projected obesity trends in the US and the UK. The Lancet, 378, 815-824. doi:10.1016/S0140-6736(11)60814-3
- Fishman, G.S. (1996) Monte Carlo: Concepts, algorithms, and applications. Sprinter Series in Operations Research.
- Macdiarmid, J. and Blundell, J. (1998) Assessing dietary intake: Who, what and why of under-reporting. Nutrition Research Reviews, 11, 231-253. doi:10.1079/NRR19980017
- Briefel, R.R., Sempos, C.T., McDowell, M.A., Chien, S. and Alaimo, K. (1997) Dietary methods research in the 3rd National Health and Nutrition Examination Survey: Under-reporting of energy intake. American Journal of Clinical Nutrition, 65, 1203S-1209S.
- Heywood, P., Harvey, P.W.J. and Marks, G.C. (1983) An evaluation of energy intakes in the 1983 Australian National Dietary Survey of Adults. European Journal of Clinical Nutrition, 47, 604-606.
- Ballard-Barbash, R., Graubard, B.I., Krebs-Smith, S.M., Schatzkin, A. and Thompson, F.E. (1996) Contribution of dieting to the inverse association between energy intake and body mass index. European Journal of Clinical Nutrition, 50, 98-106.
- Kleges, R.C., Eck, L.H. and Ray, J.W. (1995) Who underreports dietary intake in a dietary recall? Evidence from the second National Health and Nutrition Survey. Journal of Consulting and Clinical Psychology, 63, 438- 444. doi:10.1037/0022-006X.63.3.438
- Wang, Y., Monteiro, C. and Popkin, B.M. (2002) Trends of obesity and underweight in older children and adolescents in the United States, Brazil, China and Russia. American Journal of Clinical Nutrition, 75, 971-977.
- The BBC News (2010). http://news.bbc.co.uk/2/hi/europe/8468185.stm
- Cecchini, M., Sassi, F., Lauer, J.A., Lee, Y.Y., Guajardo-Barron, V. and Chisholm, D. (2010) Tackling of unhealthy diets, physical activity, and obesity: Health effects and cost-effectiveness. The Lancet, 376, 28-37. doi:10.1016/S0140-6736(10)61514-0
ABBREVIATIONS
RLMS-HSE: Russia Longitudinal Monitoring SurveyHigher School of Economics BMI: Body Mass Index US: United States WHO: World Health Organization CHD: Coronary Heart Disease CVD: Cardiovascular Disease SPSS: Statistical Package for the Social Sciences MHS: Micro Health Simulations UK: United Kingdom IHD: Ischemic Heart Disease UN: United Nations USD: United States Dollar
APPENDICES
Appendix 1. The RLMS-HSE Data Manipulation Method
Rounds 6 to 14 1) Gender variable from file “health” was merged into file “anutri” file which contained BMI data. There was a lot more data in the ‘health’ file than the “anutri” file (~10,000 cases to ~7000) and so we sorted both files by “site”, “census”, “family”, “person”. We then merged the gender variable matching cases based on these four ID variables.
2) This created a lot of missing data - ~3000 cases where BMI was not available but gender was. We filtered out missing data and created a new data file with complete BMI data.
3) We calculated age in years from months.
Rounds 15-18 1) Round 15-18 did not include constructed variables and so we merged height and weight variables, date of interview, date of birth, gender from “inadlt” into a new data file.
2) We computed a new height in metres variable from the “htself” variable in cms.
3) We created date of birth and date of interview variables from their respective separate date, month and year variables. Then calculated age by subtracting date of birth from date of interview using the date/time function in SPSS.
4) We calculated BMI (kg/m2) from height and weight data and then WHO category (1 = uw, 2 = nw, 3 = ow, 4 = ob) from mean BMI data (syntax pasted below).
5) We created a “year” variable. Where years overlap e.g. round 8 (1998-1999) we have used the later year.
Syntax used to compute variables.
*Height in metres variable COMPUTE Height_m = irhtself/100 .
EXECUTE .
COMPUTE Height_m = iqhtself/100 .
EXECUTE .
**BMI COMPUTE BMI = iqwtself/(Height_m**2).
EXECUTE.
*to calc date of interview
* Date and Time Wizard: DateOfInterview.
COMPUTE DateOfInterview = DATE.DMY(iqintday, iqintmon, iqintyer).
VARIABLE LABEL DateOfInterview "Date of interview".
VARIABLE LEVEL DateOfInterview (SCALE).
FORMATS DateOfInterview (EDATE10).
VARIABLE WIDTH DateOfInterview(10).
EXECUTE.
*To calc DOB
* Date and Time Wizard: DOB.
COMPUTE DOB = DATE.DMY(iqbirthd, iqbirthm, iqbirthy).
VARIABLE LABEL DOB.
VARIABLE LEVEL DOB (SCALE).
FORMATS DOB (EDATE10).
VARIABLE WIDTH DOB(10).
EXECUTE.
*To calculate age
* Date and Time Wizard: Age.
COMPUTE Age = DATEDIF(DateOfInterview, DOB, "years").
VARIABLE LABEL Age "Age calculated from DOB and interview date".
VARIABLE LEVEL Age (SCALE).
FORMATS Age (F5.0).
VARIABLE WIDTH Age(5).
EXECUTE.
*Change BMI in WHO BMI categories RECODE
BMI
(SYSMIS=Copy) (Lowest thru 18.49999999999999999 = 1) (18.5 thru 24.999999999999999 = 2) (25 thru 29.9999999999999999 = 3) (30 thru Highest = 4)
INTO WHOcategory .
EXECUTE.
Appendix 2. Male and Female Population by Age in 2011 According to the UN Population Database [27]
Appendix 3. Annual Cost of Diseases Used in the Micro-Simulation
Appendix 4. Cancer Data Sources
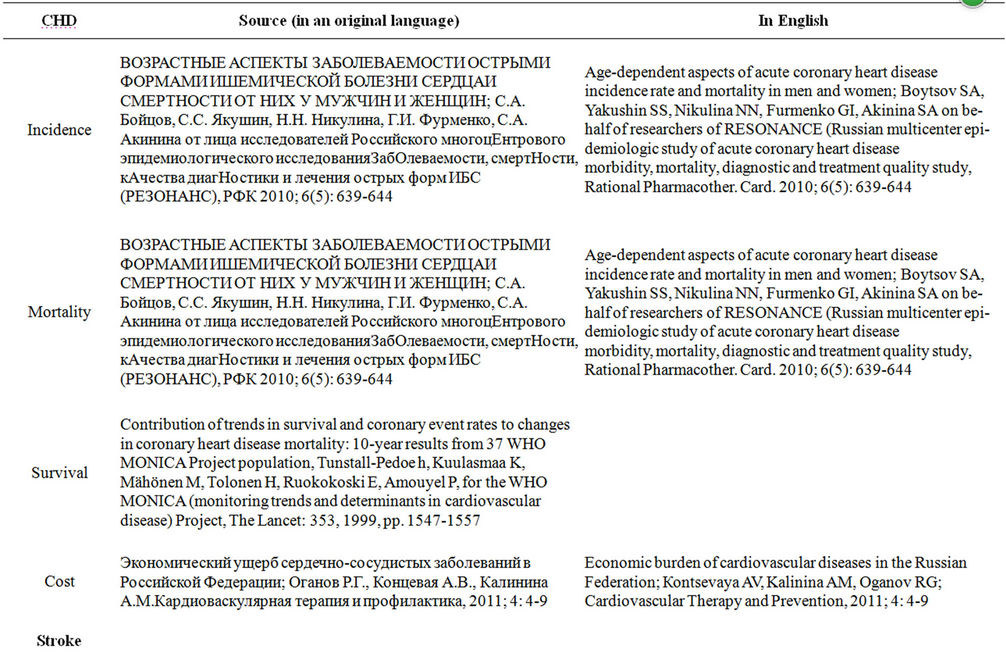
Appendix 5. Disease References
NOTES
1There are two phases of data collection in the RLMS-HSE involving 18 rounds. The phase I and Round V from phase II were not utilized for this project due to sampling differences within phase I and phase II.
2Breast cancer, kidney cancer, colorectal cancer, oesophageal cancer, endometrial cancer, gallbladder cancer, liver cancer and pancreatic cancer.
3Breast cancer, colorectal cancer and oesophageal cancer.
4Similar calculation method was carried out with the cost.
5The figure has been calculated usinghttp://inflationinrussia.com/inflation_calculators.aspx
6One Russian Ruble = 0.0341336 USD; Converted on March 1, 2012. www.xe.com.