Health
Vol. 4 No. 12 (2012) , Article ID: 25319 , 12 pages DOI:10.4236/health.2012.412192
Health expenditures and personal bankruptcies
![]()
American Enterprise Institute, Washington DC, USA; amathur@aei.org
Received 18 September 2012; revised 18 October 2012; accepted 24 October 2012
Keywords: Personal Bankruptcy; Medical Debts; Probit Model
ABSTRACT
Using household-level data from the Panel Study of Income Dynamics, we estimate the extent to which medical expenses are responsible for driving households to bankruptcy. Our results suggest that an increase of 10 percent in medical debts would cause a 27 percent increase in the filing propensity of households with primarily medical debt, and an approximately 36 percent increase in filing propensity of households where medical debts co-exist with primarily credit card debts. Studying the postbankruptcy scenario, we find that filers are 19 percent less likely to own a home even several years after the filing, compared to non-filers. However, the consequences are less adverse for medical filers i.e. those who filed due to high medical bills compared to other filers.
1. INTRODUCTION
Since 1990, consumer bankruptcy filings as a percentage of total filings have been steadily increasing. In 1990, the number of filings was approximately 718,000 (92 percent of all filings), which doubled in 2009 to 1.4 million filings (accounting for 96 percent). Over the same time period, aggregate health care expenditures have risen from around 12 percent of GDP to about 17 percent of GDP1. By 2017, the Center for Medicare and Medicaid Services projects that health care will account for about 20 percent of GDP. This paper questions the extent to which consumer bankruptcy filings and health care expenditures are correlated, and whether there is a causal relationship between the two. In particular, the paper tries to identify the extent to which a household’s medical debts cause a personal bankruptcy filing2.
Our results suggest that in households where medical debts are not the primary form of debt, there is a 36 percent increase in the probability of filing for bankruptcy when the debt level goes up by 10 percent, while in households with primarily medical debts, the probability of filing goes up by 27 percent. Hence medical debts influence bankruptcy filings differently depending upon the total debt composition of the household. We use household level data from the Panel Study of Income Dynamics (PSID) to estimate the impact of illnesses and medical debts on the probability of filing for bankruptcy. This is the first paper to use longitudinal household data to identify the impact of medical bills (and other health related factors) on bankruptcy. We extend our analysis to further study the post-bankruptcy situation for individuals. Using data on home ownership and labor supply in the PSID, we conclude that individuals who have filed for bankruptcy are significantly less likely to own homes, while they are significantly more likely to increase labor supply to accumulate savings.
The empirical literature on this topic is mixed. Studies based on surveys of bankruptcy filers, such as Himmelstein, Warren, Thorne, and Woolhandler [1] using data from the Consumer Bankruptcy Project, claim that families with medical problems and medical debts account for more than half of all bankruptcy filings3. However, their classification of a medical bankruptcy is too broad4. Further, methodologically, a big drawback of the study is that it does not include non-filers in the sample. This leads to a sample selection bias. In effect, by including only people with a bankruptcy filing, the authors are overstating the incidence of medical debts. Our study corrects for this by including both filers and non-filers, and people with and without medical debts. In addition, we include other types of debts as well as other household and economic characteristics that might drive families to file for bankruptcy.
According to another survey, the Health Care Costs Survey [2], close to 23 percent of Americans had problems paying medical bills in the previous year5. Around 19 percent experienced other financial consequences due to medical bills, such as having to borrow money, being contacted by a collection agency, or even having to file for bankruptcy. Another study based on the Commonwealth Fund Biennial Health Insurance Survey reveals that an estimated 77 million (37 percent) Americans aged 19 and older have difficulty paying medical bills, have accrued medical debt or both6. Domowitz and Sartain [3] find that “high” medical debt also contributes positively to bankruptcy, though credit card debt is the single largest contributor to bankruptcy filings at the margin. Medical debt is included in a binary form with a positive value indicating expenses in excess of 2 percent of income. This classification is arbitrary and the authors make no attempt to explain why they used this measure. Further, the study is based on cross-sectional data and does not have demographic information. Thus it is unable to account for dynamic changes in household or state level conditions such as state incomes, unemployment rates etc.
The Office for United States Trustees (in the US Department of Justice), on the other hand, found that medical debt was not a major factor in the majority of bankruptcy cases filed in 20007. More than 50 percent of filers reported no medical debt at all, while only 11 percent had medical debt in excess of $5000. Further, only in 5 percent of the cases was medical debt one-half or more of total unsecured debt. On average, medical debt was only about 6 percent of all unsecured debt. In compareson, credit card debt comprised about 40 percent of all unsecured debt. More than half the cases reported credit card debt in excess of 50 percent of all debt.
We believe that a shortcoming with the earlier studies is that they are unable to isolate the impact of medical bills from other problems that the debtor faces, such as job loss, low earnings, and other credit card debts. This makes it difficult to conclude that high costs of medical care are causing the large number of bankruptcy filings. In this paper, we attempt to study the importance of various distinct factors, in particular other debts, such as credit card charges, that the household has incurred. We incorporate into the model both the traditional factors associated with a bankruptcy and the strategic factors such as the exemption levels across states, which affect the financial incentive to file for bankruptcy. We further attempt to control for health related factors including medical coverage. The panel nature of the data allows us to control for all the factors leading to the bankruptcy, rather than focusing only on the period around the time of the bankruptcy. Further, we include in the sample both filers and non-filers, instead of including only people who have already filed. This enables generalizations of results to the larger population as well.
In the next section, we discuss the data and explanatory variables used in the analysis. Section 3 details the empirical methodology and Section 4 presents the empirical results. Section 5 discusses the possible adverse effects of a bankruptcy filing. Section 6 concludes.
2. DATA SOURCE AND DESCRIPTION
2.1. Data Source and Summary Statistics
The data are available from the Panel Study of Income Dynamics (PSID), which is a longitudinal dataset tracking households since 1968. The PSID survey asks questions relating to demographic conditions as well as income, assets and debts of the household. In 1996, the PSID asked respondents whether they had ever filed for bankruptcy between 1996 and 1984, and if so, in what years and which state they filed. We use data relating to the period 1994-1996. Since the PSID is a longitudinal dataset, we include in the sample all heads of household who were in the sample all three years. Each year there are approximately 6000 household heads who are interviewed, thus the overall sample size is 18,259 household heads8. The bankruptcy filing rate among PSID respondents for the period 1994-1996 is approximately 0.4 percent, which is similar to the average national filing rate for that period for non-business filings of about 0.5 percent. The number of filings in our sample is 74.
The PSID asks a detailed set of questions on bankruptcy. These include questions on the primary, seconddary and tertiary reason for filing, given a list of possible reasons, which include medical bills, job loss, injury or illness etc. The largest contributor to bankruptcy filings was high credit card debt. Nearly 42 percent of respondents reported high credit card bills as the primary reason for filing, while an additional 9 percent claimed it as the secondary reason for filing. Other big reasons were job loss (13 percent) and divorce or separation from spouse (12 percent). Only 9 percent of the sample claimed medical bills as the primary reason for filing, and 7 percent claimed it as a secondary reason. Illness and Injury accounted for only 6 percent of the filings. Unfortunately, we are unable to use responses to reasons for filing in the regression, because it is by definition, asked only of those who had actually filed for bankruptcy.
The PSID also asks questions relating to debt levels. A drawback of the PSID dataset is that while it gives information on the total value of debt, it does not provide information on each kind of debt separately. Thus, the key innovation in the paper is to distinguish medical debtors from other kinds of debtors, in order to study the impact of medical debt on the probability of filing for bankruptcy. To do this we exploit a part of the survey that has questions relating to loans taken by the household for various purposes. The survey asks individuals whether they had ever taken loans to repay their debts, and what was the largest component of the loan i.e. what was the most important reason for taking the loan-possible reasons include repaying credit card debts, medical bills, car debts etc. They can also list other secondary or tertiary reasons for taking the loan. This is the main variable of interest, since it allows us to distinguish medical debtors from credit card debtors, or people who had high car or mortgage debt. Hence we can classify households as medical debtors if they listed medical debts as their primary, secondary or tertiary reason for taking a loan. We can further classify households as primarily medical debtors if they listed medical debts as their primary reason for taking the loan. This should help clarify the issue of whether medical debts are the largest component of debt for households that file, or is it mainly other forms of debt, such as credit card debt, that is primarily responsible for a large number of filings.
Other relevant variables available from the dataset relate to the health status of the individual, whether they missed any weeks of work due to illness, whether they had medical coverage, etc.
Table 1 presents sample summary statistics. In terms of demographics, about 70 percent of the population is male, and around 63 percent white. The average annual family income is $43,000, while average annual debts
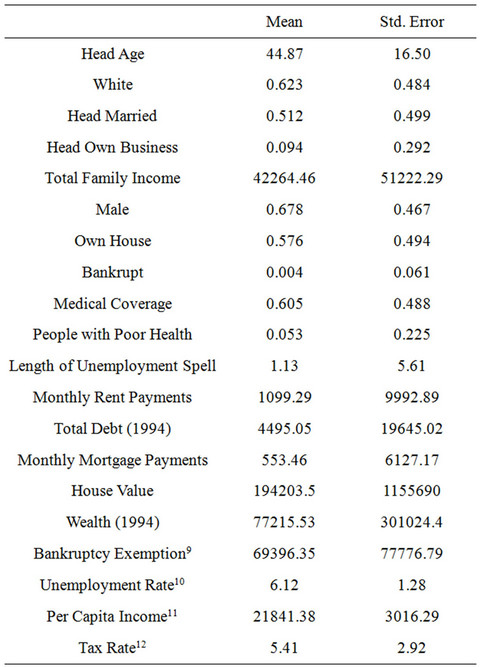
Table 1. Sample summary statistics: 1994-1996 panel.
are $4500. The bankruptcy filing rate is 0.4 percent. To distinguish between filers and non-filers, we present separately the statistics for each group in Table 2. In the sample, around 66 percent of filers are male, and more than 60 percent are white. Close to half are married. About 47 percent had medical coverage and 10 percent had experienced unemployment spells in the previous year13. About 40 percent were homeowners while 15 percent owned businesses. Surprisingly, there do not appear to be systematic differences in these demographics between filers and non-filers, as shown in Column 2 of Table 2.
Studying correlations between bankruptcy and household conditions, we found no significant correlations between bankruptcy filings and individuals with medical coverage (0.013), individuals in poor health (0.003) and individuals who were unemployed (0.007). All kinds of loans taken to repay debts, such as medical debts, credit card debts, mortgage payments or car loans are positively correlated with bankruptcy filings. There is also a positive, though not large correlation of 0.108 between those with credit card loans and those with medical loans. Further, there is a positive correlation between filings and state tax rates, state unemployment rates and state exemptions.
2.2. Explanatory Variables
We explain bankruptcy filings as a function of household debt and income levels, the proportion of debt that is medical, the bankruptcy exemption level in the households’ state of residence, the other expenditures that the household has to meet such as rent or mortgage payments and whether the household faced any health problems. We are also able to control for demographic variables.
DEBT refers to all unsecured debt which includes credit card debt, medical debt, personal loans, etc. Information on this variable is available only once every five years in the PSID. For the 1994-1996 sample, we use the 1994 data on unsecured debt as the total debt. In the regression analysis, we scale this variable by total family income to assess the impact of debt as a fraction of income. FAMILY INCOME refers to all wage and salary income earned by the household during the year. Since family income varies for each year in the sample, dividing DEBT by family income serves the purpose of introducing variation in the DEBT variable over time.
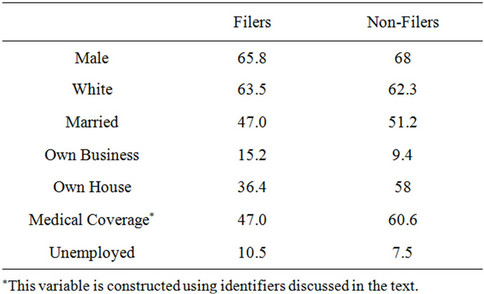
Table 2. Profile of filers and non-filers (percent), 1994-1996 panel. WEALTH or the sum of all assets for the household (excluding home equity) is again available only in the 1984, 1989 and 1994 supplements. To this we add the house value, which varies every year, to construct the variable that is used in the analysis.
MEDICAL refers to all households who reported taking a loan to repay medical debts14. MEDICAL1 refers to those who reported medical debts as the primary reason for taking a loan. This is interacted with DEBT, giving us the variable MEDDEBT, to isolate the effect of medical debt on bankruptcy. MEDDEBT1 is the subset of people within MEDDEBT who reported medical debts as their most important reason for taking a loan. Thus, MEDDEBT1 includes only those who reported medical debts as their primary reason for taking a loan while MEDDEBT includes anybody who reported medical debt as a reason-whether primary, secondary, or tertiary-for taking a loan15. Table 3 tracks changes in the number of medical debtors, and the number of bankruptcies over time. There is co-movement of bankruptcy filings and medical debtors, and also individuals reporting poor health. This is particularly true for the period 1994-1996.
MEDCOVER is a dummy variable equal to 1 if the household had health insurance coverage. The questions on health insurance coverage in the PSID are not comprehensive. The question asks whether the family is covered by Medicare, Medi-Cal, Medical Assistance, etc, but does not clearly ask whether the individual had private insurance either through the employer or self-purchased. Thus the statistics on the number of insured turn up an extremely low number of 10 percent. To supplement this information, we consulted a Consumer.
Population Survey Report on Health Insurance coverage [4] and a report prepared by the American Hospital Association [5] on trends in employer coverage. These suggested that union members, workers in certain Indus-
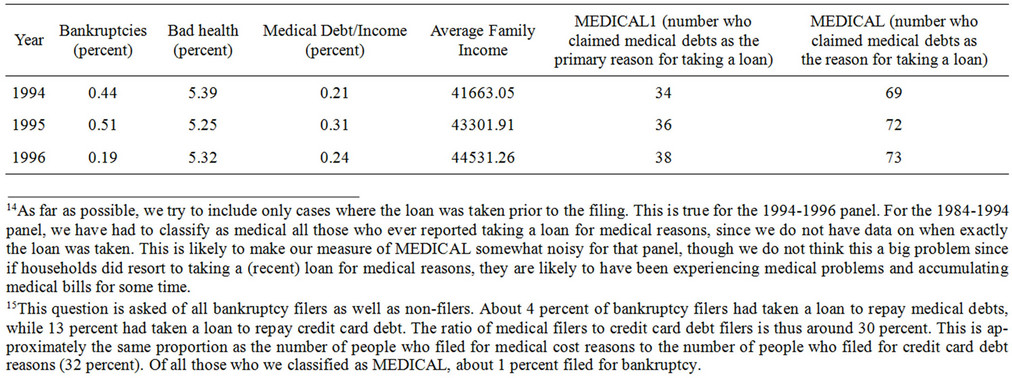
Table 3. Tracking health shocks, 1994-1996 panel.
tries such as mining and manufacturing, and occupations such as professional or technical workers, and full-time workers were more likely to be covered. Hence we assigned the MEDCOVER variable a value of 1 if any of these criteria were satisfied. With this new variable, the coverage number went up to 61 percent. This is the variable we use in Table 416.
The variable MEDICAL*UNEMPLOYED is assigned a value of 1 if the household could be classified as MEDICAL (as defined above), and the household head was also unemployed for a period of time in the previous year.
We control separately for the effect of poor health conditions, by including a variable BADHLTH. The survey asks the household head whether he considers his health to be (1) Excellent (2) Very Good (3) Good (4) Fair (5) Poor. We construct a dummy variable that takes on the value 1 if the survey response is (5). This variable is interacted with DEBT to study if individuals experiencing poor health and indebtedness are more likely to file.
EXEMPTION refers to the dollar amount of bankruptcy exemptions that the household may take in its home state. We use the homestead exemption as well as the personal property exemption. The homestead exemption is an exemption for equity in owner occupied housing. For example, in 1996 the homestead exemption in Alabama was $10,000, while in Arizona was $100,000.
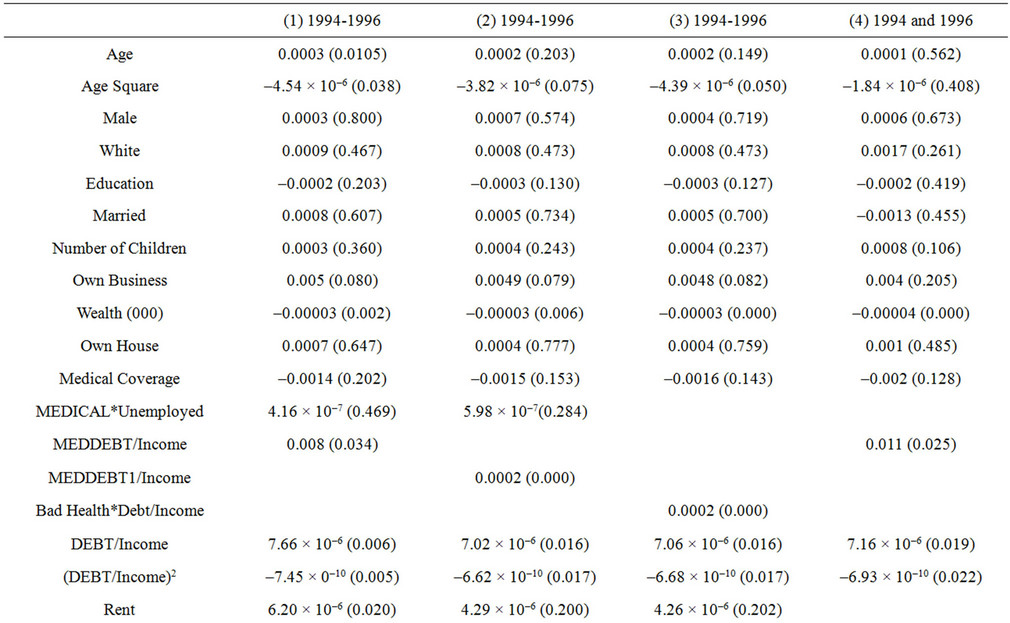
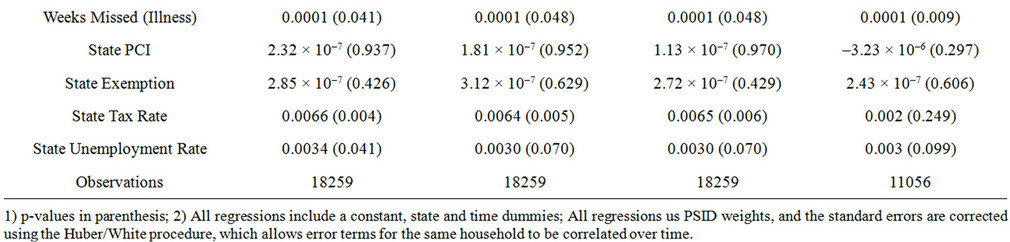
Table 4. Probit results explaining household bankruptcy filings: marginal effects, 1994-1996.
Most states also have exemptions for household belongings, equity in vehicles, retirement accounts, and a wildcard category that can be applied to any type of asset. The exemption levels have changed over time in many states. This data is available from various editions of Elias et al., How to File For Chapter 7 Bankruptcy17.
RENT refers to the annual rent or mortgage payment that the household pays. MISSED WEEKS refers to the number of weeks of work that the household head missed in the previous year due to illness. State (Maximum Marginal) Income Tax Rates (available from National Tax Foundation), Unemployment Rates and Per Capita Incomes (Bureau of Labor Statistics) are put in as additional controls for macroeconomic and business conditions, apart from the demographic variables like age, sex, marital status etc of the household head18.
3. EMPIRICAL METHODOLOGY
We use a probit model to explain the probability of bankruptcy filing by a household at time t. Our model can be specified as:
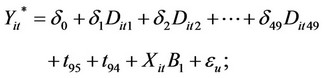
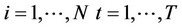
For every household i in year t.
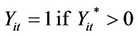
Our latent variable is  and the observed dependent variable is Yit. Yit relates to a household i’s decision (for expositional purposes) to file for bankruptcy in year t. The dataset identifies the state in which the household filed for bankruptcy. Thus we are able to assign every household to a particular state and look at the appropriate state-level variables, such as bankruptcy exemptions, tax rates etc. Dit1···Dit49 are state dummies and t95, t94 are year dummies. B1 refers to the vector of coefficients associated with the explanatory variables included in Xit. εit is a random error term. Standard errors are corrected using the Huber/White procedure, which allows error terms to be correlated over time for the same household.
4. EMPIRICAL RESULTS
4.1. Probit Estimation
Table 4 presents the marginal effects from a probit regression, using cluster analysis which allows for error terms to be correlated for the same household over time. All regressions use PSID weights to make the sample representative of all families in the US. Table 5 uses the marginal effects to illustrate the economic significance of the relevant variables.
Specification 1 (Column (1) of Table 4) shows results for demographic variables, household income, asset and debt values. The effect on bankruptcy filings of being MALE, WHITE or MARRIED for heads of household is positive, but not significant. Individuals are significantly more likely to file at relatively younger ages. More educated people are less likely to file, and this result is similar to Fay, Hurst, and White [6]. The marginal effect of an additional year of education is to lower the probability of a bankruptcy filing by 0.02 percentage points. Dividing this by the average probability of filing in our sample, which is 0.4 percent, Table 6 shows that the number of bankruptcy filings would decrease by 7.5 percent a year19. To draw conclusions from this for the general population based on 1.3 million bankruptcy filings in 1999, this implies that an additional year of education would lead to 97,500 fewer bankruptcy filings in a year.
The likelihood of filing is significantly higher if the head owns a business (p = 0.80), and is increasing in the number of children in the household. As would be expected, high family wealth is significantly negatively associated with the probability of filing. An increase in family wealth by $1000 would cause nearly a 1 percent drop in the bankruptcy filing rate, or approximately 10,000 fewer filings per year (Table 5).
Apart from MEDICAL, to adequately control for the effect of other health related factors on the probability of filing, we include a number of variables. We include a measure of weeks of work missed due to own illness, MISSED WORK20. This coefficient is positive and significant in all specifications, suggesting that losing work days due to illness is associated with lost earnings or job loss, which in turn may cause strain on the household finances leading to bankruptcy. In terms of economic significance (Table 5), an additional week of missed work would cause the predicted probability of filing to increase by 2.5 percent-an additional 32,500 filings per year21. We also control for the fact that the household may have medical insurance, MEDCOVER. As may be expected, households with medical insurance are less likely to file for bankruptcy, though the effect is not statistically significant. None of the other papers use this variable as a control. Finally, we test to see if having medical problems and being unemployed is a significant
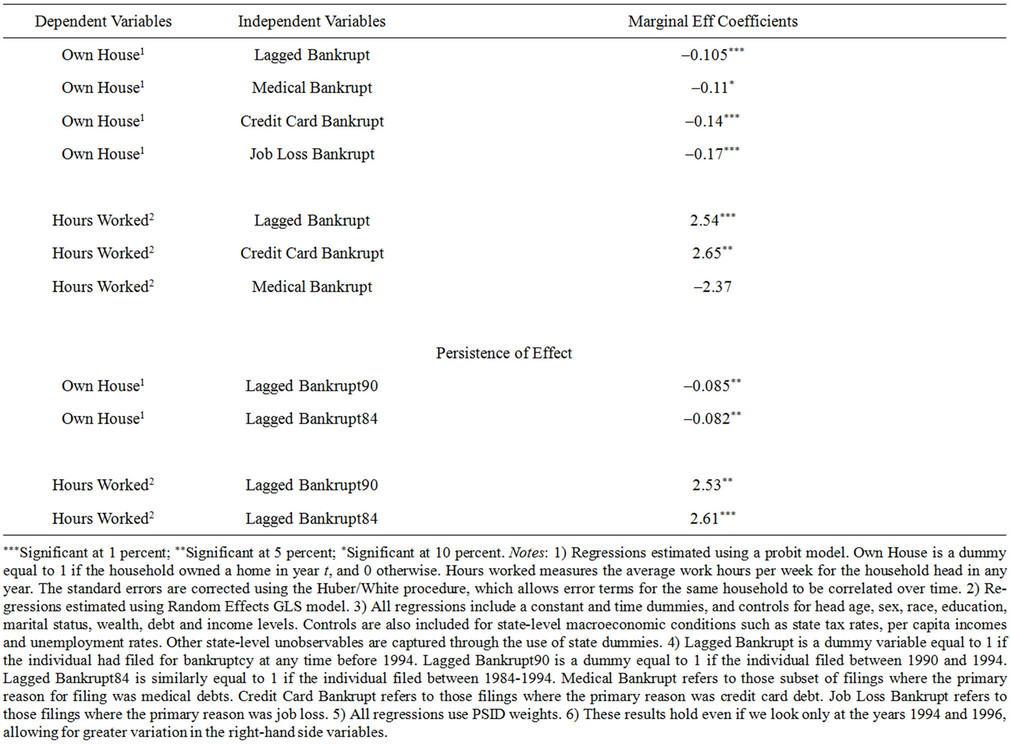
Table 5. Results explaining consequences of household bankruptcy filings, 1994-1996.
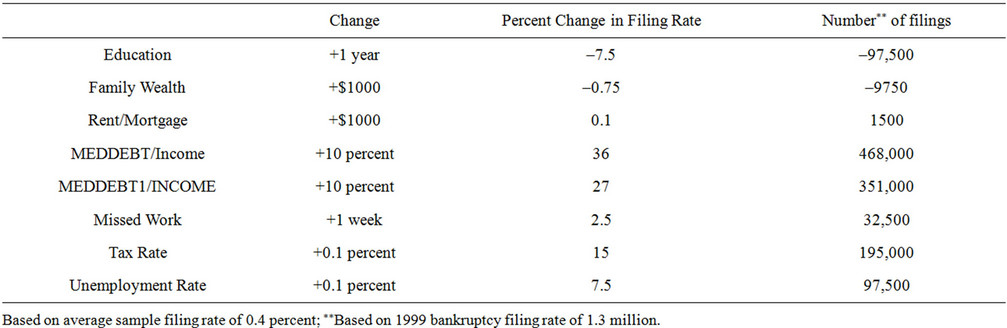
Table 6. Economic impact.
predictor of bankruptcy filings. However, while the sign on the coefficient is positive, it’s not statistically significant.
The main question that this paper seeks to answer is to what extent do medical bills contribute to bankruptcy filings. Thus in Specification 1, we include MEDDEBT along with DEBT and DEBTSQ (debt squared). We scale each of these variables by Family Income. The marginal effect associated with MEDDEBT is positive and significant22. We find that a 10 percent increase in medical debt (as a fraction of income), would lead to a 20 percent increase in the probability of filing for bankruptcy23. In terms of the 1999 bankruptcy filing rate, this would imply an additional 260,000 filings per year. It is worth pointing out here that MEDDEBT includes people who took loans primarily to pay off credit card debts, car debts or mortgages, but who also listed medical debts as a reason for the loan. Between 1994-1996, the number of people who took loans primarily to repay credit card debt went up from 406 in 1994 to 439 in 1996. Out of these only 28 in 1994 and 31 in 1996 claimed medical debts as well. The number who reported any medical debt went up from 91 in 1994 to 98 in 1996.
The level of medical debt as a fraction of income varied a lot across households with positive levels of debt. The values ranged from 0.7 percent of income to 375 percent of income. In the sample of more than 20,000 observations, there were about 8 for which the level of medical debt was larger than family income i.e. their ratio of medical debt to income was greater than 1. Our results hold even if we exclude these outliers from the sample. There were about 23 households with levels of debt greater than 50 percent of income, but less than 100 percent of income.
The coefficient on DEBT (as a fraction of income) is positive as may be expected, while the coefficient on DEBTSQ is negative and significant, suggesting that at certain very high values of DEBT, the probability of filing may go down24.
Including other macroeconomic state-level variables also yielded significant results. The coefficient on state bankruptcy exemptions is positive, but not significant25. This tends to erode support for the strategic view of bankruptcy, since if individuals were filing simply to take advantage of the higher exemptions, we would expect this coefficient to be significant.
In terms of current expenditures, taxes and rent form a large fraction of all monthly payments. Therefore it’s important to control for them in the regression analysis. The coefficient on both of these variables is positive and highly significant. A 0.1 percent increase in state tax rates would cause filings to rise by 16 percent, while a $1000 increase in annual rent or mortgage payments would cause filings to rise marginally by 0.1 percent.
Finally, we also include State Unemployment Rates. The larger the unemployment rate in the state, the larger the number of filings. A 0.1 percent increase in unemployment rates would cause filings to rise by 97,500 per year. State per capita income, PCI, is positive but insignificant.
The coefficients on these state-level macroeconomic variables and the above mentioned demographic variables are similar across different specifications. Therefore we do not refer to them again when we discuss dif ferent specifications. Instead we will focus only on the relevant variables of interest.In Specification 2, we include (instead of MEDDEBT) as the explanatory variable, MEDDEBT1. Recall that MEDDEBT1 is DEBT interacted with MEDICAL1 i.e. it is the debt level for those individuals who claimed medical debts as their primaryreason for taking a loan. The marginal effect for this variable is positive and significant. A 10 percent increase in medical debts for these households would cause only a 0.5 percent increase in the bankruptcy filing probability, or an additional 6500 filings. Comparing the results on MEDDEBT and MEDDEBT1, the picture that emerges is not one of medical bills driving individuals to bankruptcy, but medical bills in addition to other debt problems that the household is already facing.
In Column (3), we interact BADHLTH with DEBT (scaled by Family Income), and use that instead to capture the effect of debt on households with medical problems. The estimated marginal effect is the same as the one associated with MEDDEBT1 in Column (2). This suggests that our measure of medical debtors comes close to what we’re trying to capture. Surprisingly including BADHLTH as an additional explanatory variable in Columns (1) and (2) does not yield a significant coefficient. Thus already indebted households with health problems are more likely to file than households with health problems and no major debts.
A concern with specifications (1)-(3) in Table 4 is that we may be biasing downwards the impact of medical debts on bankruptcy. This arises for two reasons. First, our DEBT variable does not change across the three years, so effectively MEDDEBT is capturing the effect of changes in income (the scaling variable), rather than debt, on bankruptcy probabilities. Secondly, as mentioned earlier, there is not much change in the number of people taking loans for medical reasons between any two years. Hence as a check on our results, we re-estimated the regression model using only the years 1994 and 1996 (Column (4)). While this does not get around the first problem, it does lead to greater variation in MEDICAL, allowing for better estimation. As we suspected, there was a significant increase in the estimated coefficient on MEDDEBT-the marginal effect rose to 0.011 (p-value = 0.022) (from 0.009) i.e. a 10 percent increase in medical debts would cause a 27.5 percent increase in the probability of filing. A similar re-estimation of MEDDEBT1 did not yield a significant coefficient, possibly due to the limited observations in MEDICAL1.
How do these percentages translate to actual increases in bankruptcy filings? For the same increase in medical debts, households with mainly medical debts will see a 27 percent increase in filing propensity, while households with both medical and other debts will face a 36 percent increase in filing propensity. At the aggregate level, these changes translate to respectively 351,000 and 468,000 additional filings, compared to 1999 (Table 5). This would account for respectively, 27 and 36 percent of all filings in 2000, since the aggregate filing rate did not change a lot between 1999 and 2000.
4.2. Alternative Specifications and Checks
These results also carry forward to the case when we estimate the probability of filing for bankruptcy using Cox’s Proportional Hazard Model (Table 7). The Cox model estimates the determinants of the probability of bankruptcy. The model relates the hazard rate h(t) (the probability of filing bankruptcy at time t, conditional on not having filed bankruptcy uptil time t) to a set of observables X:
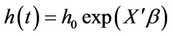
where h0(t) is the baseline hazard rate at time t for the covariate vector set at 0 and β is a coefficient vector. This semi-parametric estimator assumes that the hazard ratio  is constant over time and requires no assumptions about the baseline hazard.
The results confirm the results of the probit regressions. The coefficients on MEDDEBT (hazard ratio = 2.34) and MEDDEBT1 (hazard ratio = 1.024) are positive and significant. The coefficients indicate that the estimated hazard or risk of filing for bankruptcy increases by 1 - 2.5 times if an individual has medical debts, after adjusting for the effect of other variables in the model.
Since the PSID data has several limitations in terms of uniformity of questions across years, to assure ourselves of the robustness of results, we did cross-section regressions as well. These are not shown here but are available upon request. In any particular year, there is adequate cross-sectional variation in debt levels and total family incomes, to allow identification of coefficients on medical debts. We classify medical debtors in the usual way. The number of observations drops to about 6500, but even with this limited sample size, the estimated marginal effect on MEDDEBT is 0.017 (p-value = 0.051), which is similar to what we had before26.
To summarize, our results indicate that the effect of a 10 percent increase in MEDDEBT would be to increase total filings by about 36 percent. However, if we include only those individuals who claimed medical debt as their
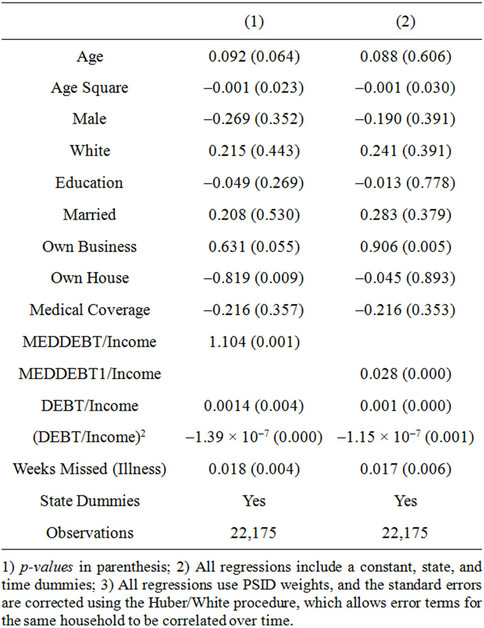
Table 7. Cox proportional hazard model results explaining household bankruptcy filings: coefficients, 1994-1996.
primary reason for taking a loan, for this group the probability goes up by about 27 percent. Note that MEDDEBT includes people who may have other forms of primary debt, such as credit card, car or mortgages, but who also have some medical debt. Hence if we look at this variable alone, we are overstating the impact of medical debts on bankruptcy filings. This captures individuals with primarily medical debt. Thus we can conclude that medical debts are primarily responsible for 27 percent of all new bankruptcy filings.
One criticism of our study could be that the data are old, and that the relationship between medical debts and bankruptcies may be stronger or weaker than in the period we describe. To see if there has been a significant change in medical debts for households, we considered other sources of data. Household level data on medical debts is available from the Survey of Consumer Finances (SCF) 27. The SCF survey samples approximately 4500 households every three years to assess families’ financial situations and provides a picture of their debt and asset levels. The households are randomly selected to avoid biased results. A look at the latest SCF data (2007) shows that medical indebtedness has not changed significantly over the past decade or so. The SCF includes medical debts with other debts incurred for “goods and services”, including credit card debt. These debts have declined marginally from 6.3 percent of all debt in 1998 to 6.2 percent in 200728. A paper by Bucks analyzing the SCF data for 1989-2004 shows, in fact, that the number of families reporting any medical debt has declined from 3.1 percent in 1998 to 2.8 percent in 200429. My own analysis of the 2007 data shows that only 2.4 percent of families reported any medical debt, and only 2.8 percent of families reported that they would save for future medical expenses.
At an aggregate level, national health expenditures data show that out-of-pocket medical payments as a fraction of total health expenditures have, in fact, been declining since 2000 from 14.4 percent of all expenditures to 11.8 percent in 200830.
To summarize, while bankruptcy filings have increased by 25 percent since the start of this decade, medical debts (or even credit card debts in total) have not changed significantly as a share of total debt over this period. Therefore, it is unlikely that there has been a significant change in the relationship of medical debts to bankruptcies in recent periods. If anything, the relationship may be weaker now than in the period we study.
4.3. Instrumental Variables Estimation
The results in the previous sections could be driven by a spurious correlation between medical debts and some unobserved individual attributes captured in the error term. For instance, if certain individuals have inherently poor savings habits, they are more likely to accumulate debt and therefore more likely to enter bankruptcy. To control for this, we re-estimated the model using aggregate personal health care expenditures (as a fraction of state gross domestic product) as instruments for individual medical debts (as a fraction of income). Aggregate health care expenditures are unlikely to be correlated with individual attributes of spending or saving behaveiour, but are likely to be positively correlated with individual levels of medical debt.
Data on aggregate state personal health care expenditures were obtained from the Centers for Medicaid and Medicare Services (CMS) 31. The aggregate data include expenditures on hospital care, physician services, other professional services, dental services, Home health care, prescription drugs, nursing home care etc. The data are collected at the establishment level. For instance, expenditures on hospital care reflect spending by the hospital on providing services that are billed to the patient, such as providing room and board, inpatient pharmacy, operating room fees etc. These data are then scaled by the state gross domestic product.
Unfortunately, this variable does not turn out to be an ideal instrument. The first stage regressions do not show a statistically significant effect of aggregate health care expenditures on an individuals’ level of medical debt. Therefore we have to look for alternative instruments.
As an alternative instrument for medical debt, we tried the occupation of the wife. Our first stage regression results suggest that if wives are employed as professionals, managers or administrators, this significantly reduces the level of medical debt (as a fraction of income). A possible reason for this is that these occupations are ones which are most likely to have employer provided health insurance coverage [5]. This should be a good instrument since the wife’s occupation is likely to be exogenous to the probability of a bankruptcy filing. However, it’s not a very powerful instrument since the first-stage coefficient is significant only at 10 percent. In the second-stage too, the instrumented level of medical debt is significant at 10 percent, but it is positive as in the original specification. This leads us to conclude with some confidence that what we are observing is not simply a correlation, but a causation running from medical debts to bankruptcy filings32.
5. ECONOMIC CONSEQUENCES OF BANKRUPTCY FILINGS
The key feature of the modern US personal bankruptcy law is to provide debtors a financial fresh start through debt discharge. However, surveys of bankruptcy filers reveal that filers experience financial hardships, such as reduced access to credit, as a result of a bankruptcy record. Empirical evidence in this regard is scant. Musto [7] demonstrates that the removal of a Chapter 7 bankruptcy record from an individual’s credit report leads to a substantial increase in the number and aggregate limit on cards offered to the individual. Long [8] presents evidence to suggest that a household with a bankruptcy record is about 30 percent more likely to lose home ownership. Han and Li [9] estimate the effect of personal bankruptcy filings on labor supply using data from the PSID. They find that filing for bankruptcy does not have a positive impact on annual hours worked by bankrupt households.
In this paper, we assess the impact of bankruptcy filings on homeownership, average hours worked by the household head, and access to health insurance coverage. We further study whether these effects are persistent or tend to die down after a period of time, and whether there are differential effects of medical bankruptcy filings as opposed to other reasons for filing. Our results indicate that there are significant negative effects of having a bankruptcy record and these effects tend to per sist, even over a ten year period.
Results presented in Table 5 indicate that a previous bankruptcy filing has a significant negative impact on home ownership. The variable LAGGED BANKRUPT is a dummy variable equal to 1 which indicates that the individual had filed for bankruptcy at some point prior to the period under study i.e. 1994-1996. Unlike Long [8], our sample does not only include home owners, but all household heads whether or not they owned a home. Including all of the controls used in previous regressions, and allowing for state and time dummies, our results indicate that having a bankruptcy record lowers the probability of home ownership by about 10.5 percentage points. Given the average home ownership rate of 55 percent, this translates approximately to a nearly 19 percent drop in the probability of home ownership. This drop in home ownership could be attributed to reduced access to credit as a result of having mortgage applications turned down. As Long [8] points out, households interviewed in the 2001 Survey of Consumer Finances listed bad credit history as the main reason for why their credit applications had been rejected. From the PSID, it is possible to get information on why individual’s had their mortgage applications rejected. However, this information is only available for some years. Nonetheless, we regressed the probability of a mortgage application being turned down if one had filed for bankruptcy before. The probability of being turned down (due to credit history problems, or low, unstable income) if one has filed for bankruptcy before is positive, though significant at about 15 percent.
We were interested in studying if the negative conesquences of bankruptcy filings were somehow different for medical filers versus other filers. The PSID asks bankruptcy filers to provide a reason for the filing. A list of possible reasons could include medical debts, credit card debts, job loss etc. By medical filers, we mean those individuals who gave their primary reason for filing as medical bills. Our hypothesis is that if bankruptcy filings are induced by a sudden short-term increase in debts as a result of an illness, in the long run (the period after the filing), the income-debt levels would stabilize faster than for other filers. This would mitigate the negative effect of the filing for this group of debtors. Therefore, in Table 5, we study the effect on home ownership of medical filers, credit card filers and filers who had experienced job losses. The estimated marginal effect is barely significant at 10 percent for medical filers, while it is highly significant at 1 percent for credit card filers and job-loss filers. Hence our results suggest that the probability of owning a home after bankruptcy is significantly lower for certain kinds of filers, as opposed to others.
Following Han and Li [9], next we model the effect of bankruptcy filings on labor supply. The underlying assumption behind the notion of debt discharge incorporated in U.S. personal bankruptcy law is that discharge of debt will give the individual a fresh start after bankruptcy. It will preserve the incentive to work and therefore encourage human capital formation. We test for this by regressing average hours worked per week by the household head on whether the individual had filed for bankruptcy previously, using a Random Effects GLS model. Unlike Han and Li [9], we find that the lagged bankruptcy filing dummy enters positively and signifycantly in the regression, with p-value equal to 0.001. Contrary to their theoretical predictions, we find that individuals respond to a filing by increasing their supply of labor and working longer hours. Intuitively, this can be explained by the fact that their access to credit is lowered after the filing, hence there is an incentive to work and save more, to insure against other eventualities. These results hold if we consider credit card filers (coefficient = 2.65, p-value = 0.049), but there is no signifycant increase in the case of medical filers. Hence, once again, our results suggest that there are less significant impacts of bankruptcy filings for medical debtors33.
Finally, we wanted to study whether the impact of a filing is most severe in the immediate aftermath of the filing, or does it persist over time. Our results indicate that there is persistence over time. We defined a dummy LAGGED BANKRUPT90 which includes only those filings that occurred between 1990-1994, not including 1994. Similarly, LAGGED BANKRUPT84 includes all those cases where filings occurred between 1984-1994. The former captures the short-term impact of the filing on home ownership and labor supply, while the latter captures the long-term impact. As the table shows, the coefficient on home ownership is not significantly different for the two cases. This is also true for average hours worked. Thus the negative consequences of bankruptcy filings appear to last for long periods of time34.
Summarizing the results in this section, we find that having a bankruptcy record significantly lowers individual’s ability to own homes. This effect is most significant for individuals who filed due to high credit card debt or because they experienced job losses. The results are less significant for medical filers. We justify this finding on the assumption that medical filers are more likely to be those who experienced a one-time adverse event, but have steady income-debt levels otherwise. This may reduce problems of credit access for them. Hence they are able to recover faster from a bankruptcy filing, as opposed to credit card debtors with more persistent debt and income problems. This could also explain our findings on hours worked by individuals. In general, a bankruptcy filing induces longer work hours per week compared to non-filers. This result holds most strongly for credit card filers. Finally, we find that the effects of a bankruptcy filing persist over time.
6. CONCLUSIONS
In this paper, we estimate a model of the household bankruptcy filing decision, using PSID data for the period 1994-1996. The main aim in the paper is to assess the extent to which medical debts lead to household bankruptcy filings. This is a particularly relevant issue since health care expenditures today account for approximately 17 percent of the gross domestic product in the United States. These rising health care costs are likely to translate into higher medical expenses for American households, and our aim is to see the extent to which these medical expenses are driving families to bankruptcy.
To this end, we first developed a classification of households into medical and other debtors. Then we regressed the probability of bankruptcy on medical (and other) debts using a probit model and a hazard model. The study finds that medical debts are significantly related to bankruptcy filings. A 10 percent increase in debts of households with credit card debt as the primary form of debt, along with some level of medical debt, would cause bankruptcy filings to go up by 36 percent on average. A 10 percent increase in debts of households with primarily medical debts would cause filings to go up by 27 percent on average.
We find support for the non-strategic adverse events view of bankruptcy. In support of the latter, we find that an adverse event such as losing work days due to illness significantly increases the likelihood of filing. The paper also draws attention to other expenditures incurred by the household that are important in the filing decision, such as rents (or mortgages payments) paid per year or the amount of taxes paid (proxied by state tax rates). Macroeconomic conditions like state unemployment rates etc. are also highly significant and are positively linked to bankruptcy filings.
Our study also documents post-bankruptcy impacts on filers. We find that filers are significantly less likely to own homes. They are more likely to work longer hours to make up for the reduced credit access after bankruptcy. These effects persist for long periods of time, and are less significant for medical filers.
REFERENCES
- Himmelstein, D.U., Warren, E., Thorne, D. and Woolhandler, S. (2005) Illness and injury as contributors to bankruptcy. Health Affairs, 2 February 2005, in press.
- Health Care Costs Survey (2005) Kaiser family foundation (KFF). Harvard School of Public Health. http://www.kff.org/newsmedia/upload/7371.pdf
- Domowitz, I. and Sartain, R. (1999) Determinants of the consumer bankruptcy decision. Journal of Finance, 54, 403-420. doi:10.1111/0022-1082.00110
- (1995) Current population reports, health insurance coverage, 60-195. http://www.census.gov/prod/2/pop/p60/p60-195.pdf
- American Hospital Association (1996) Recent trends in employer health insurance coverage and benefits. American Hospital Association. http://www.lewin.com/NR/rdonlyres/egugxizk7qh4dvcnszrg2rtx5atxny3okbw3oem33etampl3hcjciyaluowmvqn3s6e6x7botmryfrio6kyg5qarexb/AHA_Insurance_Report.pdf
- Fay, S., Hurst, E. and White, M. (2002) The household bankruptcy decision. American Economic Review, 92, 706-718. doi:10.1257/00028280260136327
- Musto, D.K. (2002) What happens when information leaves the market? Evidence from post-bankruptcy consumers. Journal of Business, unpublished paper.
- Long, C. (2005) Negative effects of personal bankruptcy filings for home owners: Reduced credit access and lost option value. Proceedings, Federal Reserve Bank of Chicago, Chicago.
- Han, S. and Li, W.L. (2004) Fresh start or head start? The effect of filing for personal bankruptcy on the labor supply. Working Paper 04-5, Federal Reserve Bank of Philadelphia, Philadelphia.
NOTES
1http://covertheuninsured.org/factsheets/display.php?FactSheetID=120
2In the literature, there are two views about consumer bankruptcy filings. The non-strategic view states that households experiencing adverse economic shocks are forced to file for bankruptcy-in other words, bankruptcy is involuntary and driven by circumstances beyond the control of the household. Sullivan, Warren, and Westbrook conclude that the primary cause of bankruptcy filings in their sample was unemployment or employment interruptions. (See Sullivan, Teresa, Warren, Elizabeth, and Westbrook, Jay Lawrence (1989), “As we forgive our debtors: Bankruptcy and consumer credit in America”, New York: Oxford University Press, 1989). A divorce, also, may create an unexpected shock to household income or reduce the economies of scale from living in a single household. The strategic view of bankruptcy is that households file for bankruptcy because the financial benefit from filing has gone up.
3A re-examination of their data by Dranove and Millenson (Health Affairs, 25, no. 2, 2006), suggests that medical bills are a contributing factor in personal bankruptcies in only 17 percent of cases. This is again based on just the survey of filers.
4They include as medical debtors people who cited any form of addiction or uncontrolled gambling, or had experienced the birth or death of a family member. The respondents included low-income people who had no jobs (not necessarily due to illness), had low earnings in the past, and other unpaid debts. The 2009 study excluded people with an addiction or gambling problem.
5http://www.kff.org/newsmedia/upload/7371.pdf
6http://www.cmwf.org/usr_doc/837_Doty_seeing_red_medical_debt.pdf
7“The Class of 2000: Bankruptcy by the Numbers”.
http://www.usdoj.gov/ust/press/articles/abi01octnumbers.html
8Specifically, households are tracked longitudinally and there is some sample attrition.
In 1994, there are 6984 observations, in 1995, 6941 and in 1996, 6814.
9Data available from Elias et al., How to File for Chapter 7 Bankruptcy, various editions.
10Data available from Bureau of Labor Statistics.
11Data available from Census.
12Data available from National Tax Foundation.
13A possible reason for the low percentage of insured individuals could be that the survey question on medical insurance asks respondents if they were covered by Medicare, Welfare, Medical Services etc., but it may not include private insurance or employer provided insurance, and it does not include Medicaid. More detailed questions on health insurance were asked in the surveys after 1999.
14As far as possible, we try to include only cases where the loan was taken prior to the filing. This is true for the 1994-1996 panel. For the 1984-1994 panel, we have had to classify as medical all those who ever reported taking a loan for medical reasons, since we do not have data on when exactly the loan was taken. This is likely to make our measure of MEDICAL somewhat noisy for that panel, though we do not think this a big problem since if households did resort to taking a (recent) loan for medical reasons, they are likely to have been experiencing medical problems and accumulating medical bills for some time.
15This question is asked of all bankruptcy filers as well as non-filers. About 4 percent of bankruptcy filers had taken a loan to repay medical debts, while 13 percent had taken a loan to repay credit card debt. The ratio of medical filers to credit card debt filers is thus around 30 percent. This is approximately the same proportion as the number of people who filed for medical cost reasons to the number of people who filed for credit card debt reasons (32 percent). Of all those who we classified as MEDICAL, about 1 percent filed for bankruptcy.
16We could also create a weighted average of all these characteristics for each individual, and assign MEDCOVER a value of 1 only when more than 50 percent of the criteria are met.
17How to File for Chapter 7 Bankruptcy, Elias, Stephen, Renauer, Albin and Leonard, Robin (Publisher: Nolo).
18State Maximum Marginal Tax Rates change for a few states for every year in the sample.
19Interestingly, this is close to the number derived by Fay, Hurst, and White [6] of 8 percent.
20The average number of weeks missed was 1.
21Surprisingly, Fay, Hurst, and White [6] do not find a significant impact of adverse events such as unemployment spells experienced by the household head in the previous year or health problems.
22As a robustness check, we tried dropping a few variables, like MEDCOVER, MEDICAL*UNEMPLOYED from the model, but the results did not change.
23This is obtained by dividing the percentage point marginal effect by 0.4, the average filing probability.
24This is similar to results reported by Fay, Hurst, and White [6].
25The p-value associated with the coefficient estimate is 0.80, but is much higher for the marginal effect.
26Again, in this case, no significant coefficients could be estimated for MEDDEBT1.
27http://www.federalreserve.gov/pubs/oss/oss2/scfindex.html 28The largest categories of debt are mortgages and vehicle loans.
28The largest categories of debt are mortgages and vehicle loans.
29http://www.iariw.org/papers/2008/bucks.pdf
30https://www.cms.gov/NationalHealthExpendData/01_Overview.asp
31http://www.cms.hhs.gov/NationalHealthExpendData/05_NationalHealthAccountsStateHealthAccounts.asp
32The IV estimation was done using Jonah Gelbach’s program available from his webpage. (http://www.glue.umd.edu/~gelbach/ado/) Unfortunately, this does not allow clustering or the use of random effects. Hence the coefficients are not comparable to the estimated coefficients from a probit estimation.
33These results hold when we use instruments for the bankruptcy variable, such as the state bankruptcy exemption. This variable is positively correlated with bankruptcy filings, but is not likely to be correlated with home ownership. (For our sample the correlation is close to 0).
34If we take business ownership as the dependent variable, the coefficient on lagged bankruptcy is positive and significant (at 10 percent) only if we include all cases between 1980 and 1994. There is no short-term impact of a filing on business ownership. Another variable that we tried is insurance coverage. In this case, there is a negative and significant effect of previous bankruptcy filings (LAGGED BANKRUPT) on health insurance coverage.