Journal of Modern Physics
Vol.4 No.12(2013), Article ID:41267,6 pages DOI:10.4236/jmp.2013.412203
Wastewater Decontamination from Microorganisms by Electrospraying Corona Discharge
1Center of Plasma Technology, Al Azhar University, Cairo, Egypt
2Botany and Microbiology Department, Faculty of Science, Al-Azhar University, Cairo, Egypt
3Physics Department, Faculty of Science, Al-Azhar University, Cairo, Egypt
Email: *abdougaramoon@hotmail.com
Copyright © 2013 Mohamed Elsawah et al. This is an open access article distributed under the Creative Commons Attribution License, which permits unrestricted use, distribution, and reproduction in any medium, provided the original work is properly cited.
Received November 1, 2013; revised November 28, 2013; accepted December 15, 2013
Keywords: Wastewater Decontamination; Electrospraying; Pulsed Corona Discharge; Low Temperature Plasma for Biodecontaination; Environmental Applications of Plasmas; Wastewater Treatment
ABSTRACT
A novel water treatment technique, based on a combination of electrospraying and pulsed corona discharge, has been used for bio-decontamination of wastewater. The electrospraying process has been found to increase the surface area of the treated wastewater, and hence increases the efficiency of the corona treatment process. The phase diagram of the discharge, which characterizes the discharge regimes, has been identified experimentally. The survival ratio of the microorganisms has been investigated experimentally as a function of the applied voltage and the numbers of treatment runs using air and oxygen as working gases. Microorganism surface has been examined using scanning electron microscope (SEM), which enabled in understanding the decontamination mechanisms of the treated microorganism. A complete decontamination has been achieved after only one run for an applied voltage higher than 16 kV when the discharge system was operated in oxygen gas. Optical emission spectrum of the electrosprayed water confirmed the existence of OH-radicals responsible for decontamination process.
1. Introduction
Wastewater contains countless numbers of biological contaminants, living micro-organisms, bacteria, protozoa, fungi and so on. Traditional decontamination methods of wastewater include decontamination agents like chlorine or its compounds such as chloramine or chlorine dioxide, or by using ozone, ultraviolet or hydrogen peroxide [1]. On the other hand, modern treatment methods of wastewater are based on the advanced oxidation processes (AOPs), which involve an input of energy (either chemical, electrical or radiative) into the water matrix to produce highly reactive radical intermediates, which then attack and destroy the target compounds [2].
Electrosprayed pulsed corona discharge has been introduced recently in wastewater treatment [3]. The process is based on a combination of corona discharge with electro-spraying. Electro-spraying is a method of generating a very fine liquid aerosol through the electrostatic charging [4-8]. The incorporation of electro-spraying with corona discharge leads to an increase in the surface area of the water to be treated by corona discharge and hence results in increasing the efficiency of the system compared to other systems utilizing corona discharge only. In general, the pulsed high-voltage corona discharges generate plasma that initiate a variety of physical and chemical effects at high electric field, intense ultraviolet radiation, and lead to the formation of various reactive chemical species (such as OH, O3, O and H2O2), which react with microorganisms and chemical compounds dissolved in water [9].
The abovementioned electrosprayed pulsed corona discharge treatment technique has been used for phenol removal from water [3]. In the present paper, the potential of this new treatment method for decontamination of microorganisms in wastewater has been investigated.
2. Materials and Methods
Schematic diagram of the electrospraying pulsed corona discharge system, used for wastewater decontamination process, is shown in Figure 1. Pulsed high voltage power supply (0 - 22 kV, 15 kHz) has been used to initiate the electrospraying pulsed corona discharge (Elsawah et al. 2012).
The discharge cell consists of two electrodes which comprises a medical syringe needle connected to the high voltage power supply, and the passive electrode that is a flat stainless steel plate, connected to the ground. The two electrodes have been fixed in a tight closed Pyrex container which has two slits for gas inlet and gas outlet. Electrical characterization of the discharge cell (currentvoltage waveforms) has been studied elsewhere using double channel 150 MHz digital oscilloscope (type HM1508), where one channel was connected to a voltage attenuator (1000:1) and the other channel was connected to 100 ohm resistor.
The wastewater samples were collected, after the mechanical filtrations and before any chemical or biological treatment, from a local wastewater plant in Egypt (Mustorod water treatment plant). The untreated samples have been injected through the medical syringe-needle whereas drops of the water fall down in the discharge space through the pin to plate system. When the applied voltage reaches a certain value, water drops are sprayed as a result of the effect of the applied electric field and therefore corona streamers are formed simultaneously as shown in Figure 2.
The function of electro-spraying process is to increase the treated surface area and the rate of evaporation of water. Since the micro-droplets of the sprayed water pass through the different regions of the discharge streamer they will be subjected to the different plasma species, and hence enhances the treatment process.
The advantage of this new electrospraying technique is that it does not consume remarkable power. To enhance the removal ratio of the microorganisms, the treatment process has been repeated many times of runs (up to five times) for the same sample.
The distance between the powered electrode (syringe-needle) and the ground electrode was fixed at 4 cm.
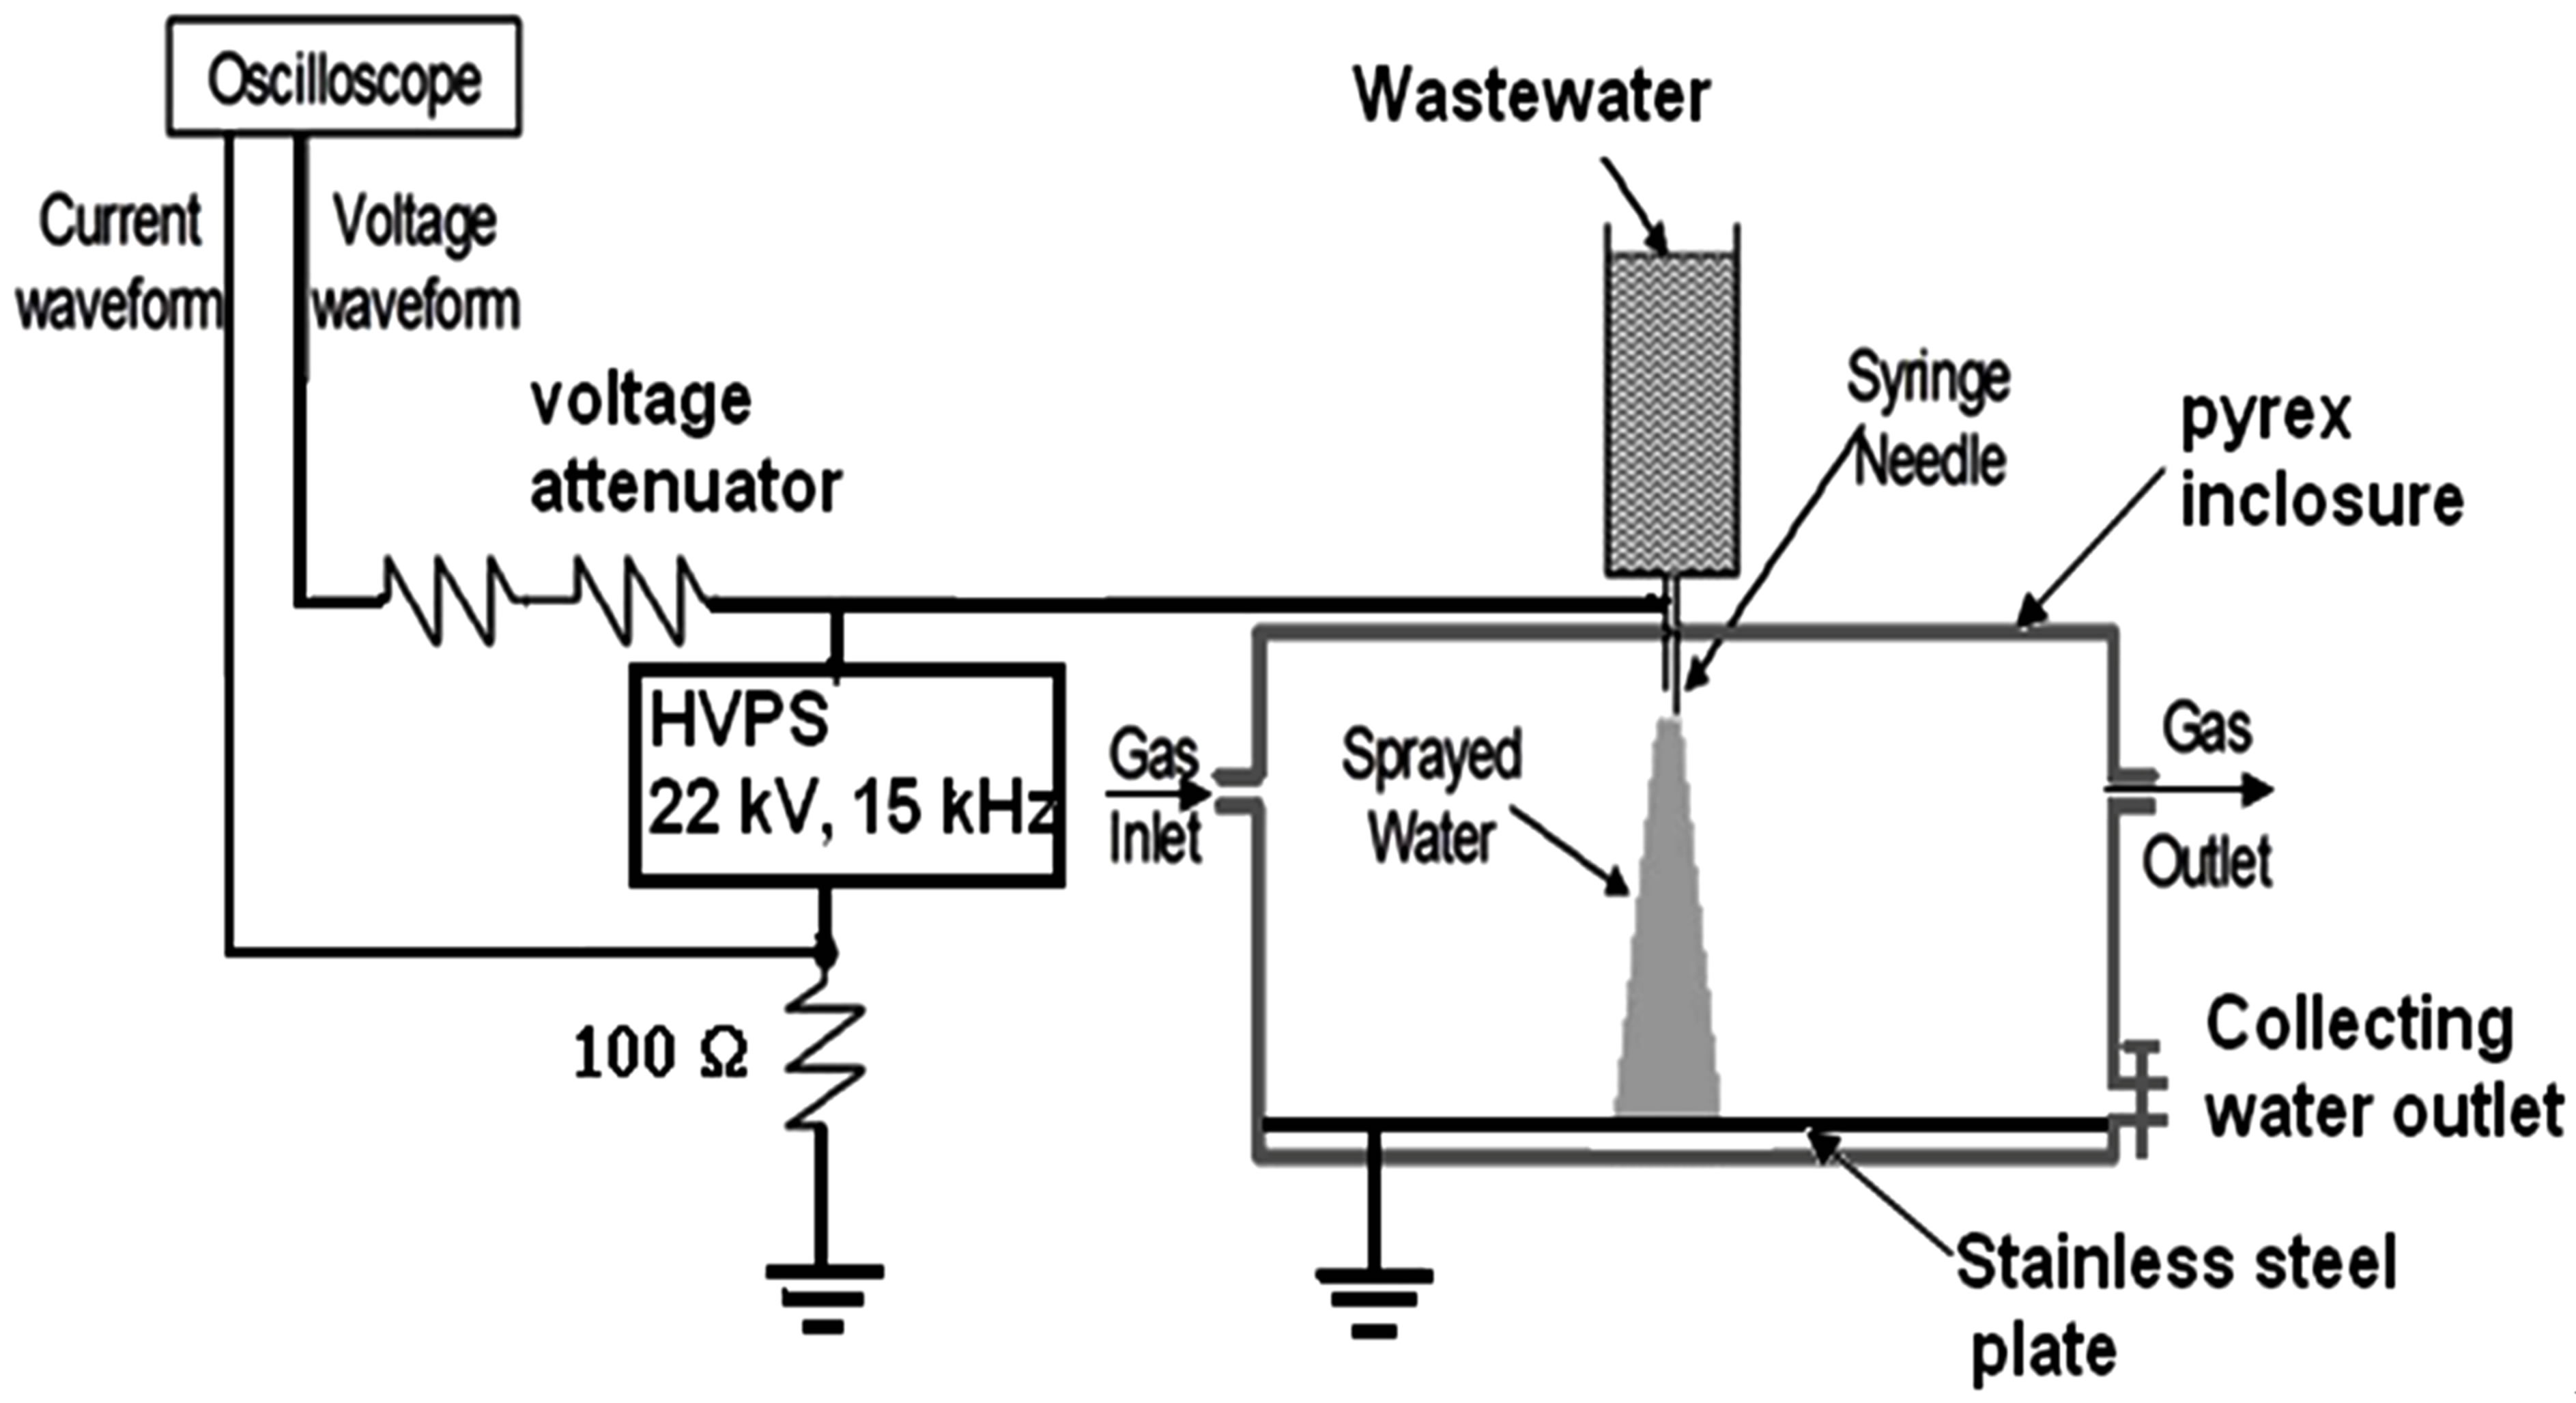
Figure 1. Electrospraying corona discharge system.
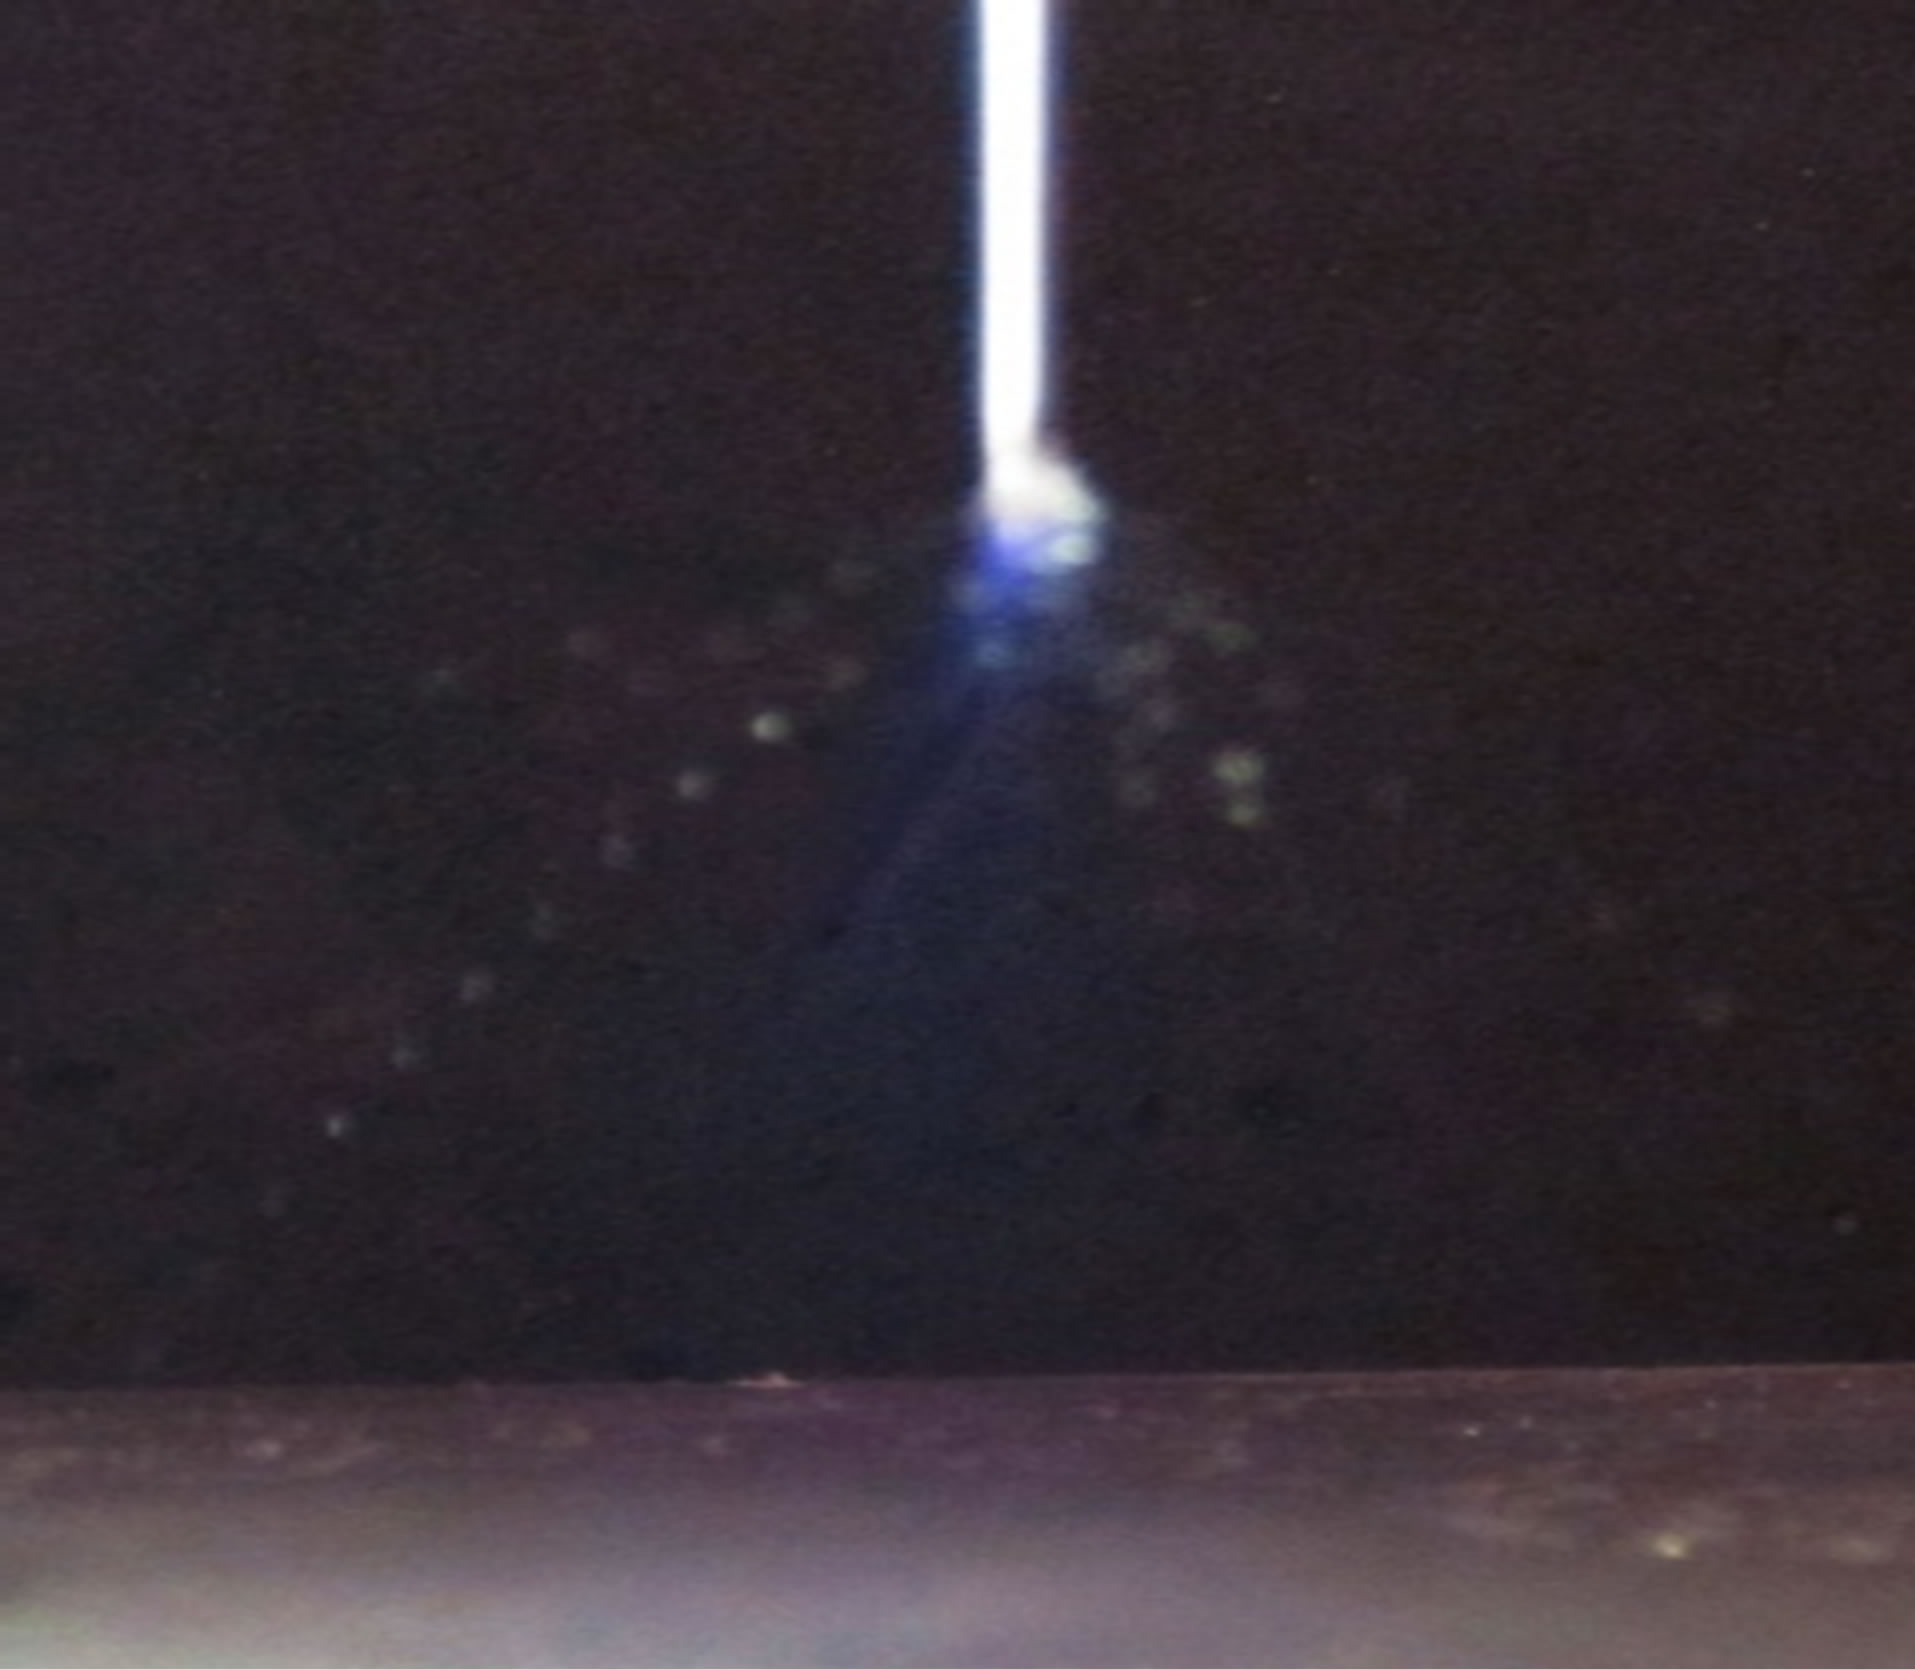
Figure 2. Photographic plate of the sprayed water due to electrospraying.
Air or oxygen gases at atmospheric pressure have been used as working gases. The water samples (either control or treated) were diluted 10 folds serial dilutions in saline solution (0.85% NaCl sterile solution).The diluted samples were inoculated onto the surface of nutrient agar plates and incubated at 37˚C for 24 hours. At the end of incubation period, the number of colonies in the plates was counted (the number of colonies to be counted was between 30 and 300 colony/plate). The viable bacterial cell concentration was computed and expressed as colony forming units (CFUs)/ml. The bacterial survival ratio has been calculated by dividing the number of colonies counted in the treated sample by that in the untreated one multiplied by 100. Bacterial surface was examined using a JEOL-JSM 5500 LV scanning electron microscope (SEM) by using high vacuum mode at magnifications ranging from 2500 to 15,000.
To identify the various reactive species generated during the electrospraying corona discharge process, the emission spectra, in the wavelength range of 270 to 430 nm, have been recorded. The spectra were then compared with a similar spectrum in the same wavelength range collected from corona discharge in the absence of eletrospraying, in the case when air is used as a working gas. It is worth mentioning that, for both spectra, the operational parameters of the spectrometer (Type: Solar laser systems M266), grating: 1200 g/mm and slit width: 100 mm, were unchanged.
3. Results and Discussion
3.1. Electrical Characteristics of Corona Discharge
It is well known that the corona discharge is formed in a limited range of the applied voltage where below this range the applied voltage is not enough to initiate the discharge while at higher voltage the corona discharge is transformed to spark discharge. The range of the corona voltage depends on different parameters such as electrode type and shape, the working gas and the gap distance between the two electrodes.
In the present discharge system, three phases of discharge are formed depending on the discharge current, as shown in Figure 3. At low applied voltage the current is almost few tenths or hundreds of nano-Ampers (nA), which is related to the collection of the free electrons generated by UV and cosmic rays [10]. In this range of current, no discharge occurs since the electric field, between the two electrodes, is not high enough to support the avalanche ionization process. As the applied voltage increases up to a certain value the electric field at the tip of the discharge electrode becomes intense enough to make the gas breaks down in a localized space around the discharge tip. Consequently the current jumps to values up to a few mA, which characterize the corona discharge phase [11]. In corona discharge phase, as the applied voltage increases the discharge current increases and the discharge covers more space.
At further higher applied voltages the discharge current becomes high enough to heat the gas in the discharge region. Therefore, the gas density decreases and hence the electric field increases [12]. Consequently the discharge current jumps to values of the order of few amps and i.e., the discharge is shifted to the spark discharge phase.
The present system has been designed to operate in the corona discharge phase. Spark discharge phase is not recommended for the purpose of the present work. The accompanied heating effect with the spark discharge causes inefficient treatment of wastewater, not only because of the power dissipation, but also because this supports the multiplication of microorganisms. The effect of the different discharge parameters on the phase transitions has been identified to avoid the spark region. The steep increase in the discharge current has been observed very carefully, and has been used as an indicator of the
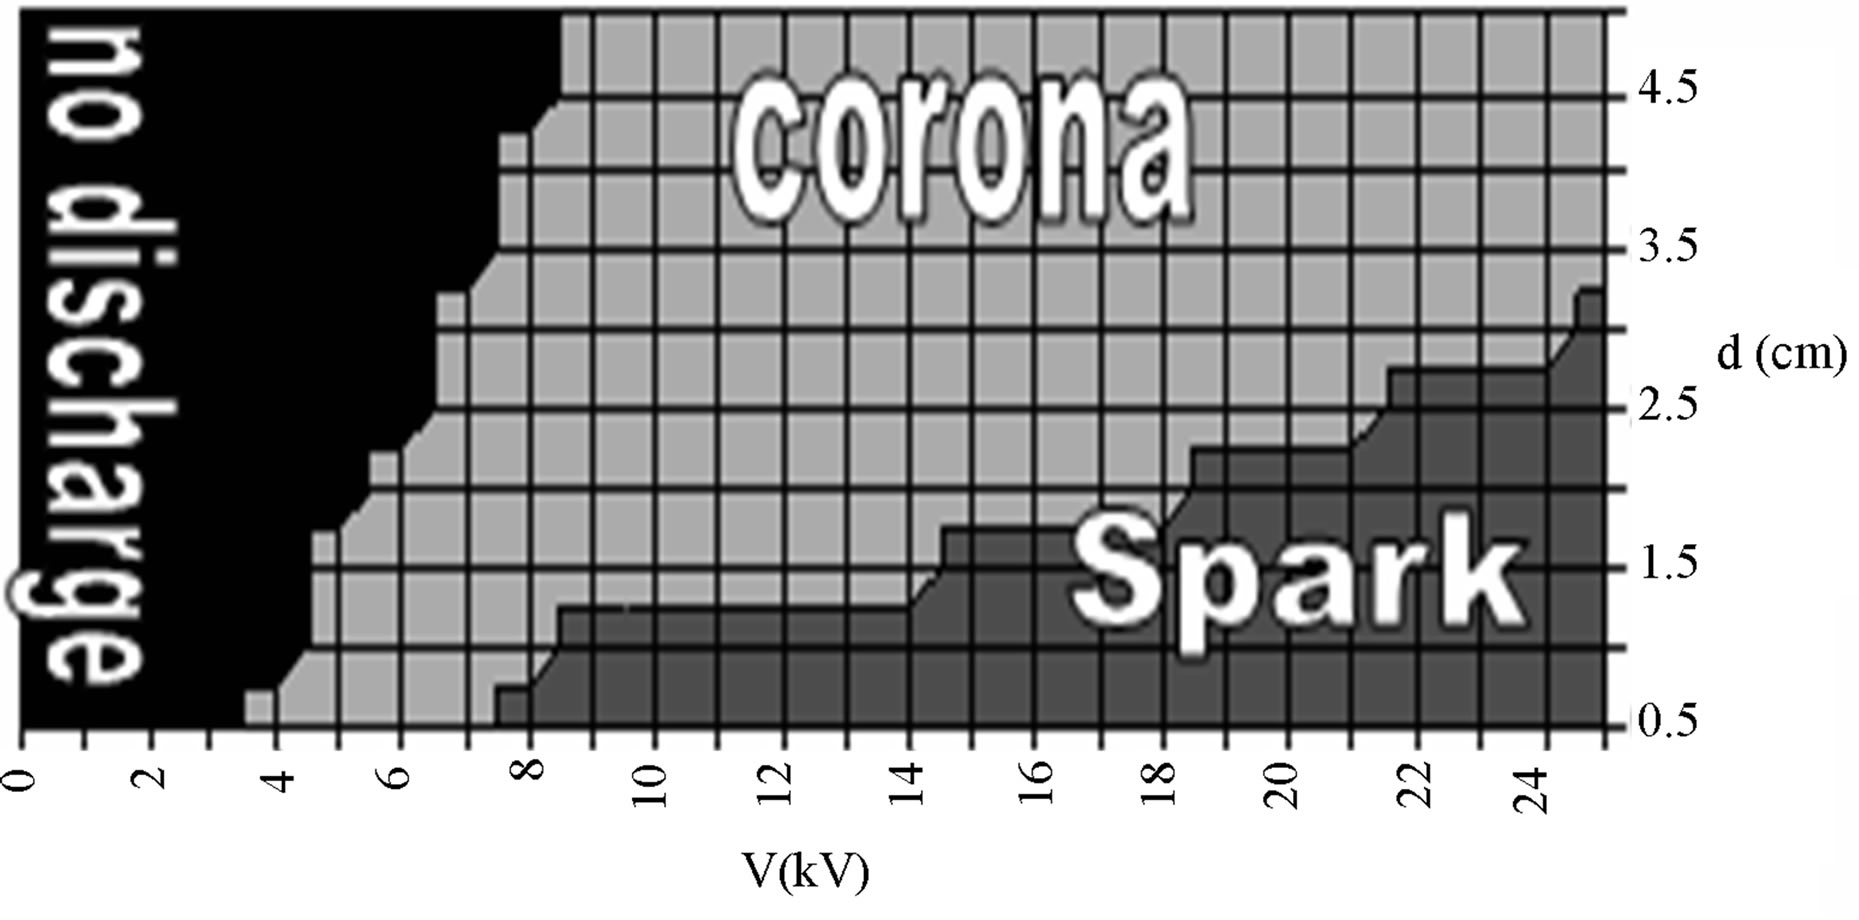
Figure 3. Phase diagram (voltage and gap distance) of the pulsed corona system.
discharge phase. The discharge phase transitions depend on the electric field distribution and in turn on the three parameters namely the applied voltage (V), the distance between the two electrodes (d) and the discharge electrode diameter [12].
In the present measurements the applied voltage has been increased slowly and the transition points (jumps of the current) has been measured at different conditions. Figure 3 shows the discharge phase diagram [discharge phases as a function of the applied voltage (V) and the distance between the two electrodes (d)] at different values of the discharge electrode diameter. At longer distance between the two electrodes, the range of the corona discharge phase increases. In addition, as the diameter of the discharge electrode increases the corona discharge phase has been observed to be contracting. This may be attributed to the fact that, the intensive electric field produced at thinner discharge electrode supports the transition to corona phase at lower applied voltage.
On the other hand the thicker electrode decreases the electric field intensity in the gap between the two electrodes and hence prevents the transition from corona phase to spark phase. Therefore the thicker electrode leads to wider range of corona phase. In the present work, the diameter of the discharge electrode of 0.1 mm and the distance between the two electrodes of 4 cm have been chosen as an ideal parameters for the operation of the system in the corona phase.
Figure 4 shows the power-voltage characteristic curves of the corona discharge and the electro-spraying corona discharge, where the peak values of the waveforms have been used. Two different slopes of the two curves are shown in Figure 4. At voltage lower than 14 kV, the discharge power increases slowly by increasing the discharge voltage while at voltages higher than 14 kV, the discharge power increases rapidly by increasing the
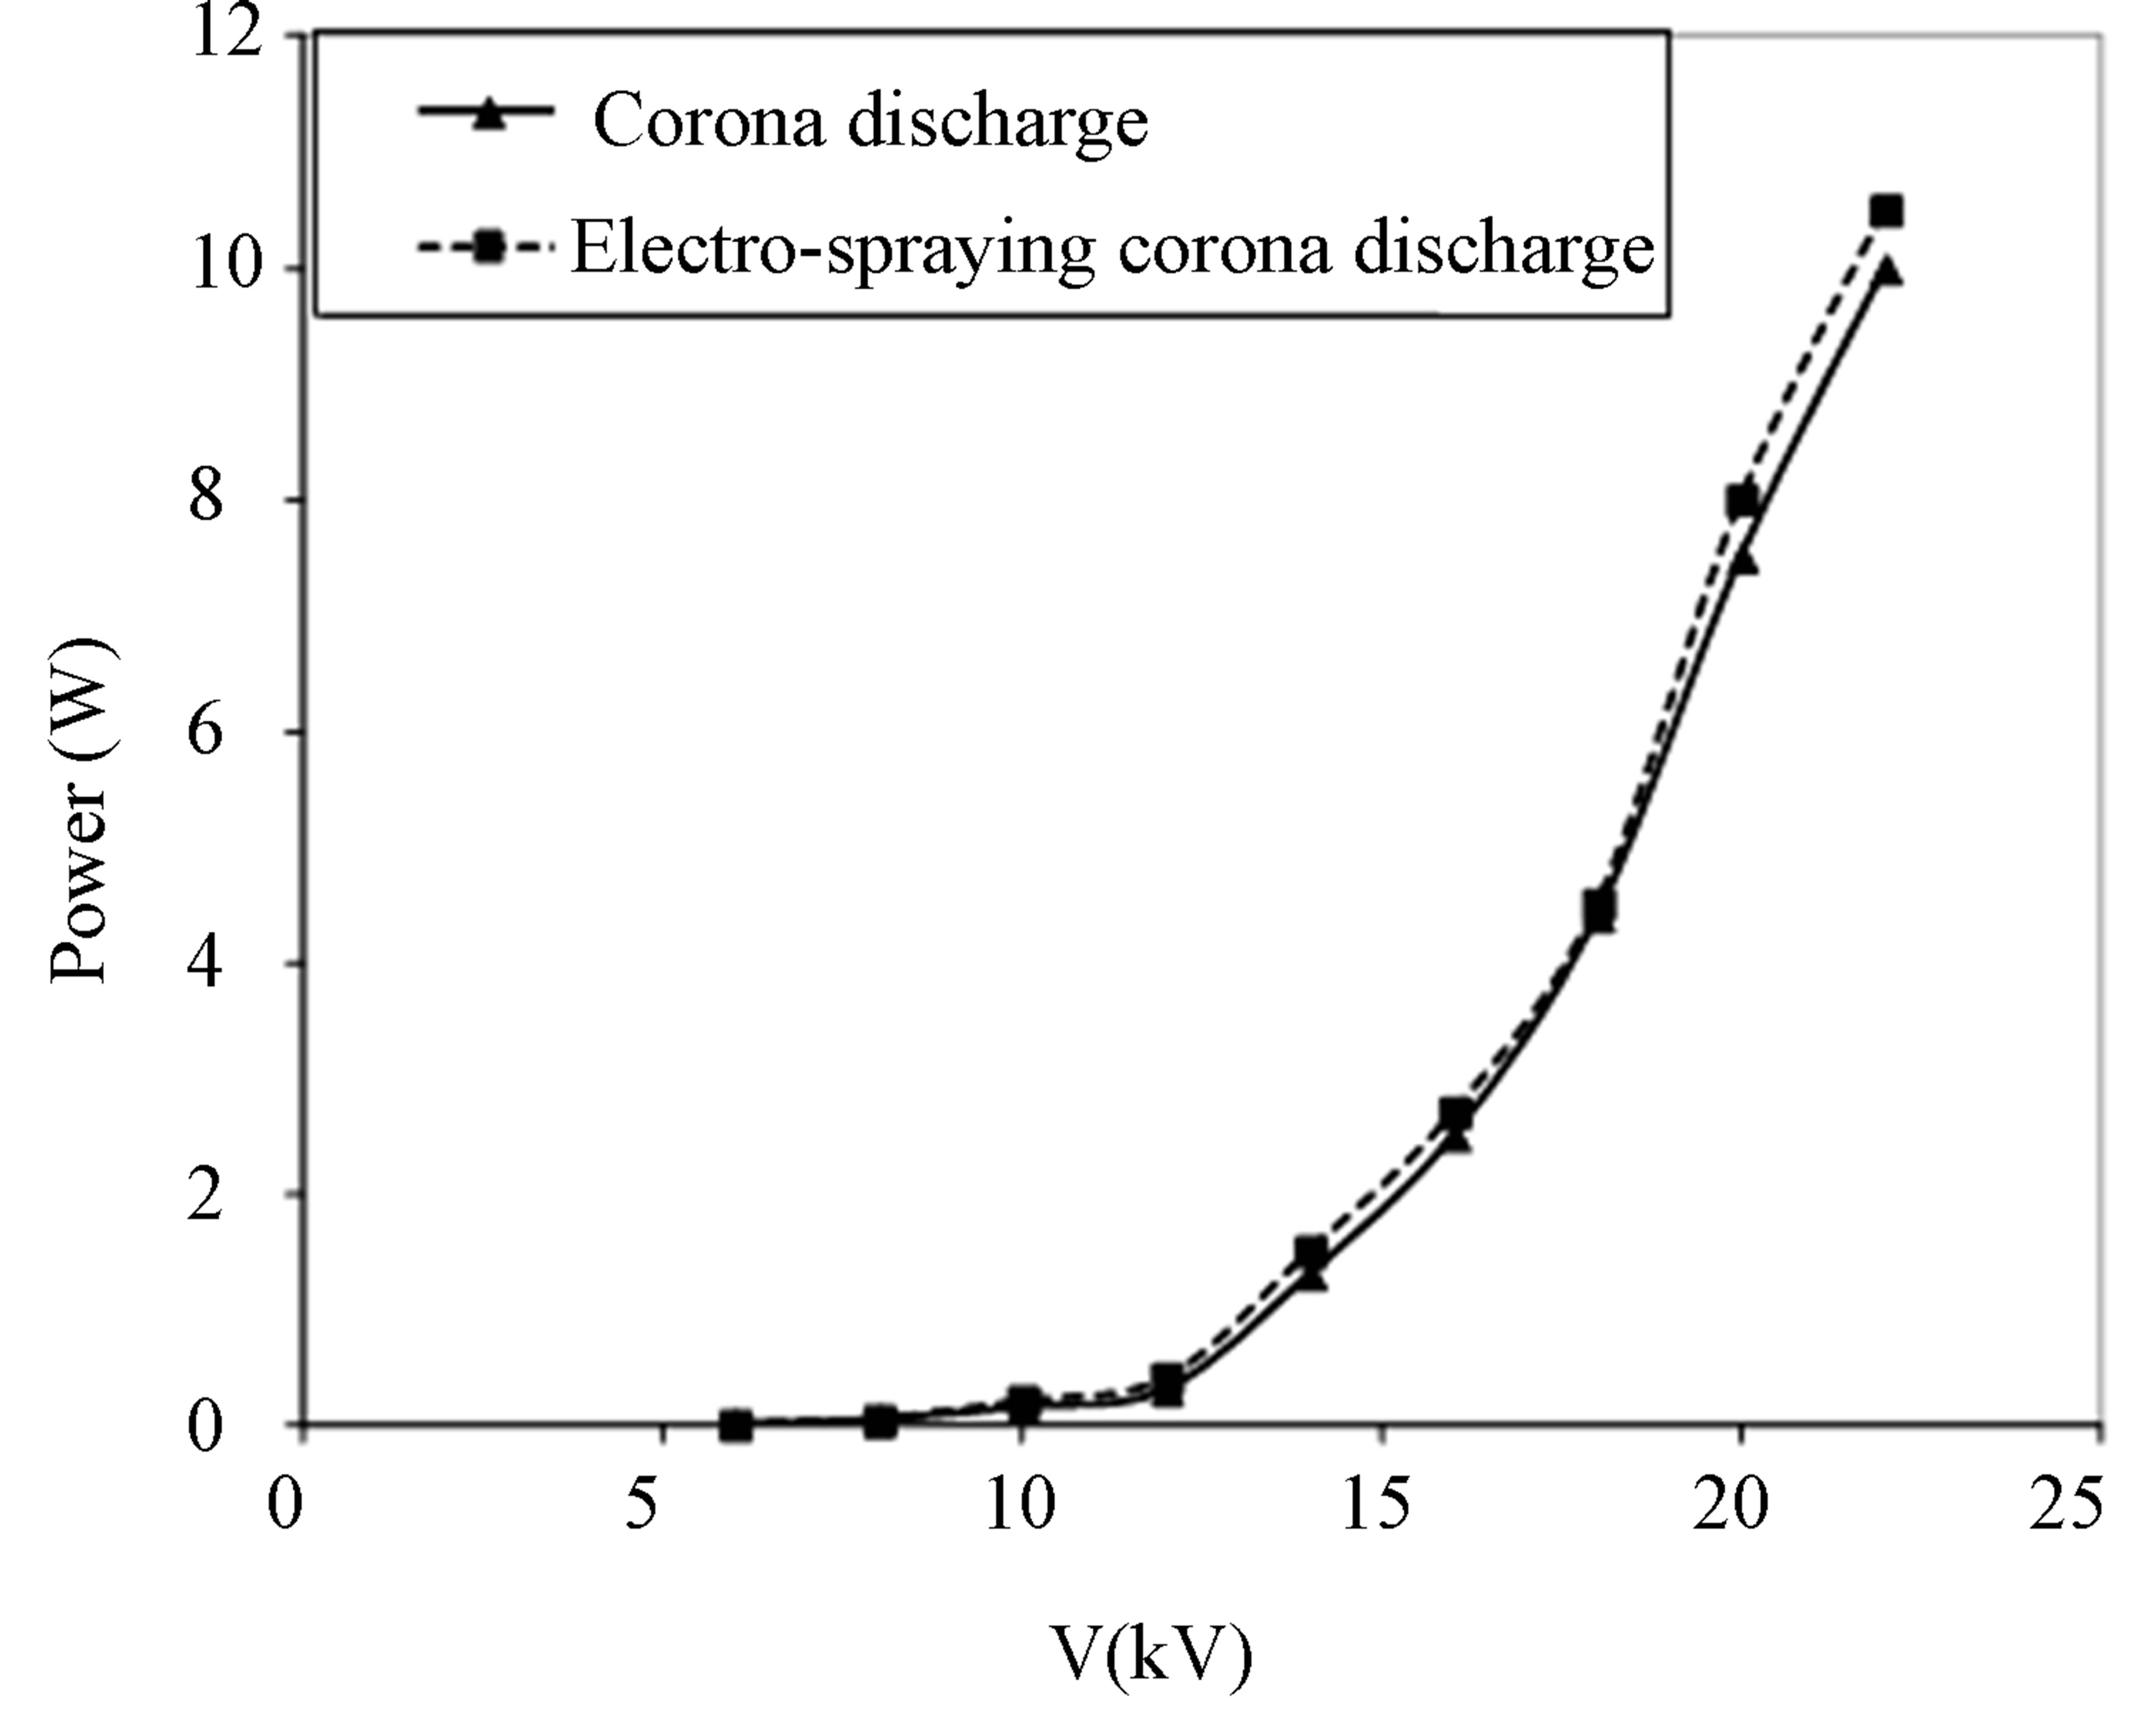
Figure 4. Power consumed during electrospraying corona discharge and corona discharge only.
discharge voltage. This behavior can be noticed clearly in both corona discharge and electro-spraying corona discharge. The two slopes behavior can be attributed to two different types of corona discharge. At discharge voltages lower than 14 kV, the corona discharge works as a glow corona discharge. At discharge voltages higher than 14 kV, however the voltage is enough to produce streamer corona discharge. In streamer corona discharge the discharge volume is larger and hence the charge carriers are denser, which increases the slope of the power-voltage curve.
In the present work, the treatment process has been carried out in the corona streamer mode in order to take the advantage of large discharge volume. Figure 4 illustrates that the electrospraying process doesn’t consume remarkable power compared with the corona discharge power, in other words, electro-spraying doesn’t need a valuable cost to be combined with the corona discharge.
3.2. Decontamination of Wastewater
Figure 5 shows the bacterial survival ratio in wastewater as a function of the number of treatments runs at different applied voltages using air as a working gas. Increasing the applied voltage and the number of treatment runs shows a positive effect on the decontamination process. Using oxygen as a working gas shows a more positive effect on the decontamination process, as shown in Figure 6, than in the case of using air as a woking gas, Figure 5. Almost a complete decontamination has been achieved at only one run for applied voltages higher than 16 kV when oxygen was used as a working gas.
The decontamination mechanism of microorganisms using electro-spraying corona discharge depends on the generation of disinfecting agents such as UV, OH, O3, O and H2O2 which is generated inside the streamer channels during corona discharge. Discharges in the presence of
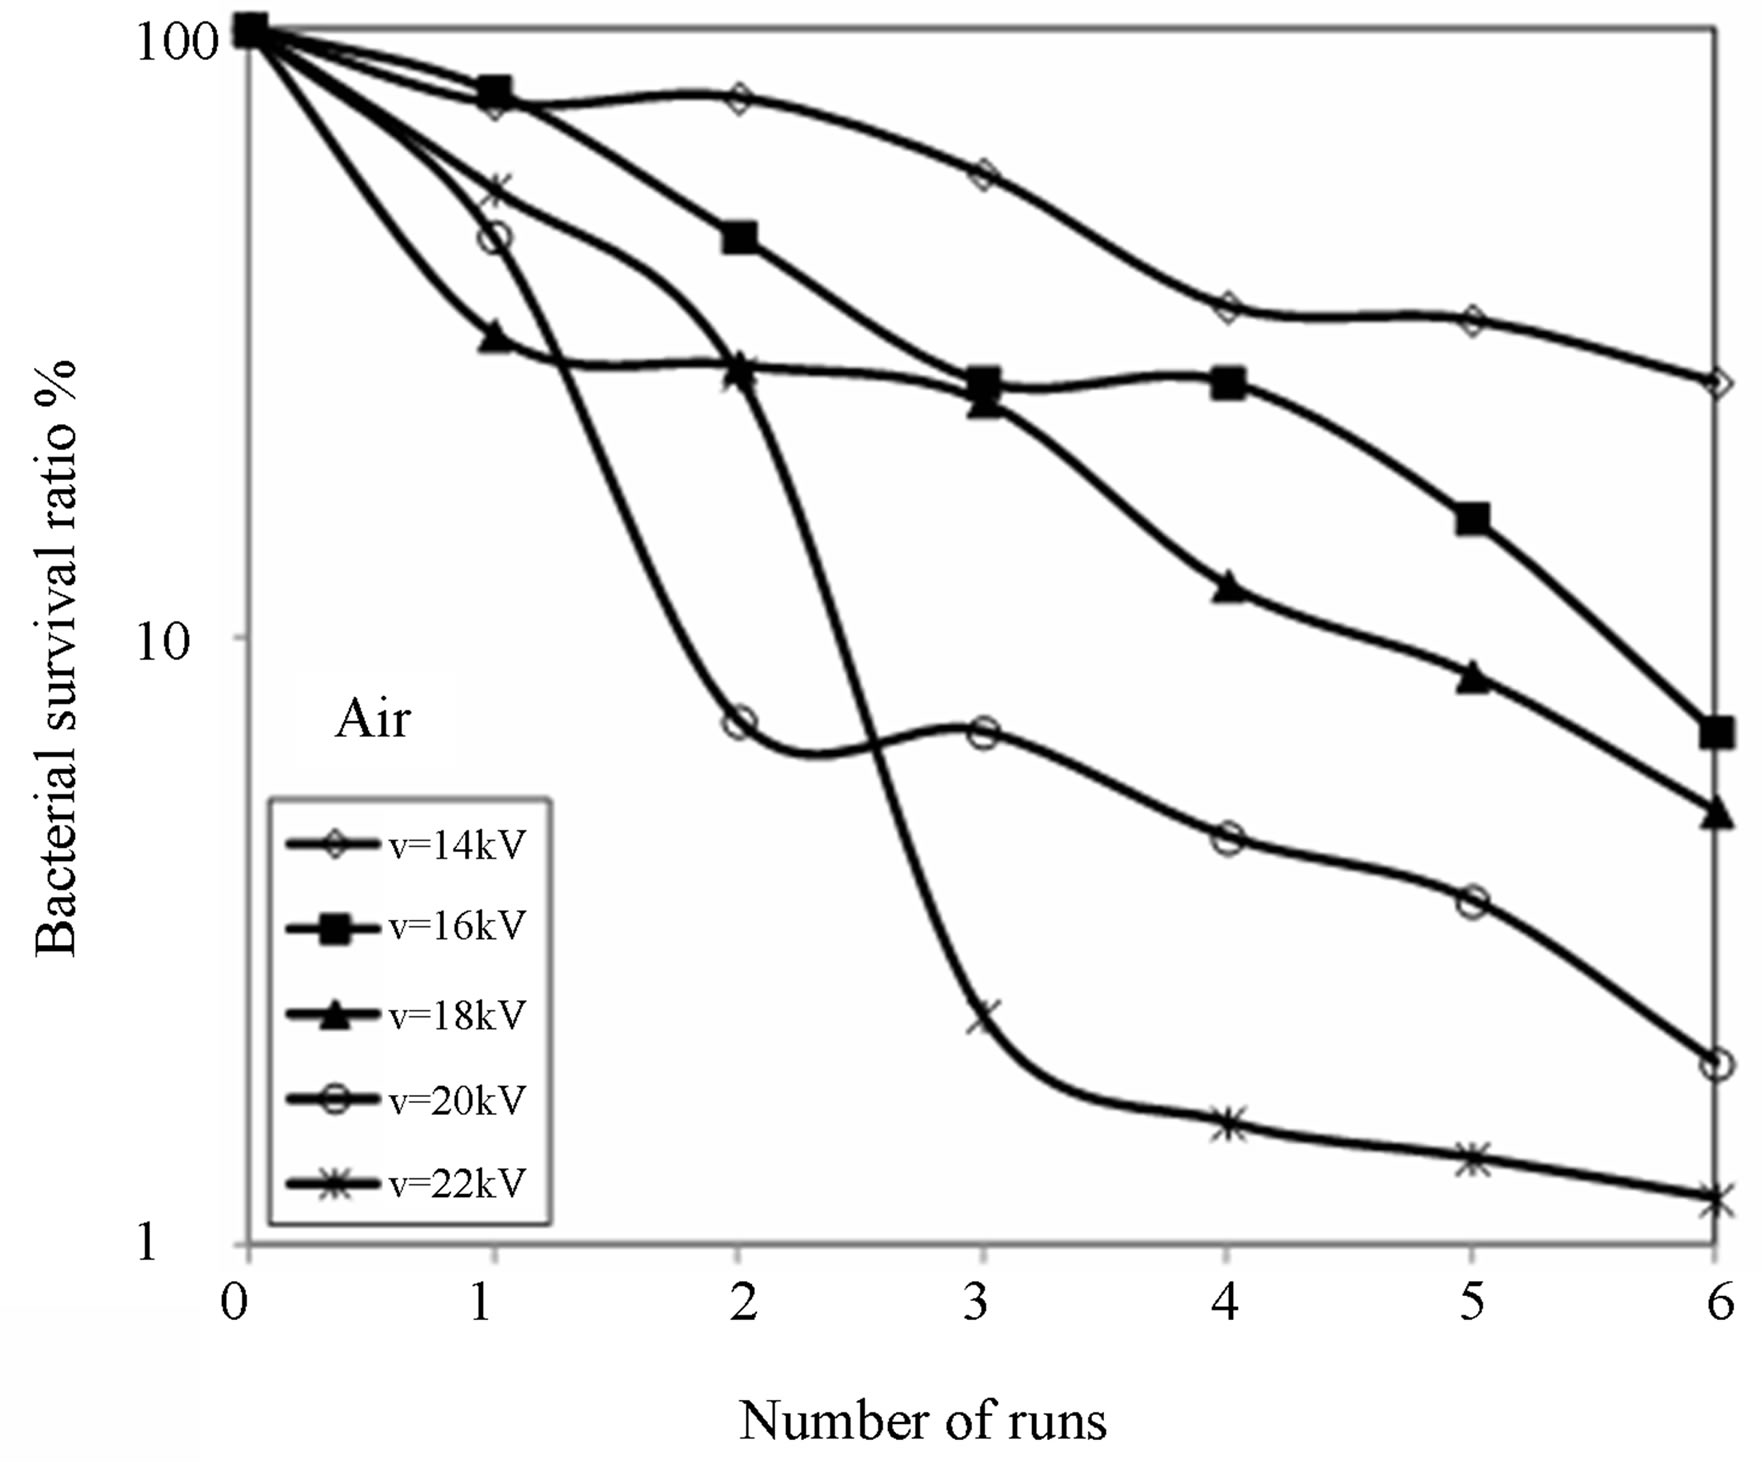
Figure 5. Survival curve ratio at different applied voltage as a function of no. of runs using air as a working gas.
water produce hydroxyl radical (OH) as a result of the dissociation of the water molecules. In addition, corona discharge produces ozone (O3), oxygen atom (O) and hydrogen peroxide (H2O2) (Joshi et al. 1995). Among the produced oxidants in corona are the OH radical which has the highest oxidation potential (2.8 V). The oxidation potential of atomic oxygen, ozone and hydrogen peroxide are 2.4, 2.1 and 1.8 V respectively [13]. Comparing chlorine (oxidation potential 1.3 V) and the oxidants produced in corona discharge, one can conclude that the oxidants produced in corona discharge are more efficient for decontamination. Various mechanism sustain the formation of oxidant in electro-spraying corona streamer are described in Table 1 [13-16]. These agents have high concentration when oxygen was used as a working gas which explains the reduction in the survival curve ratio shown in Figure 6 more than that when air has been used as working gas, Figure 5.
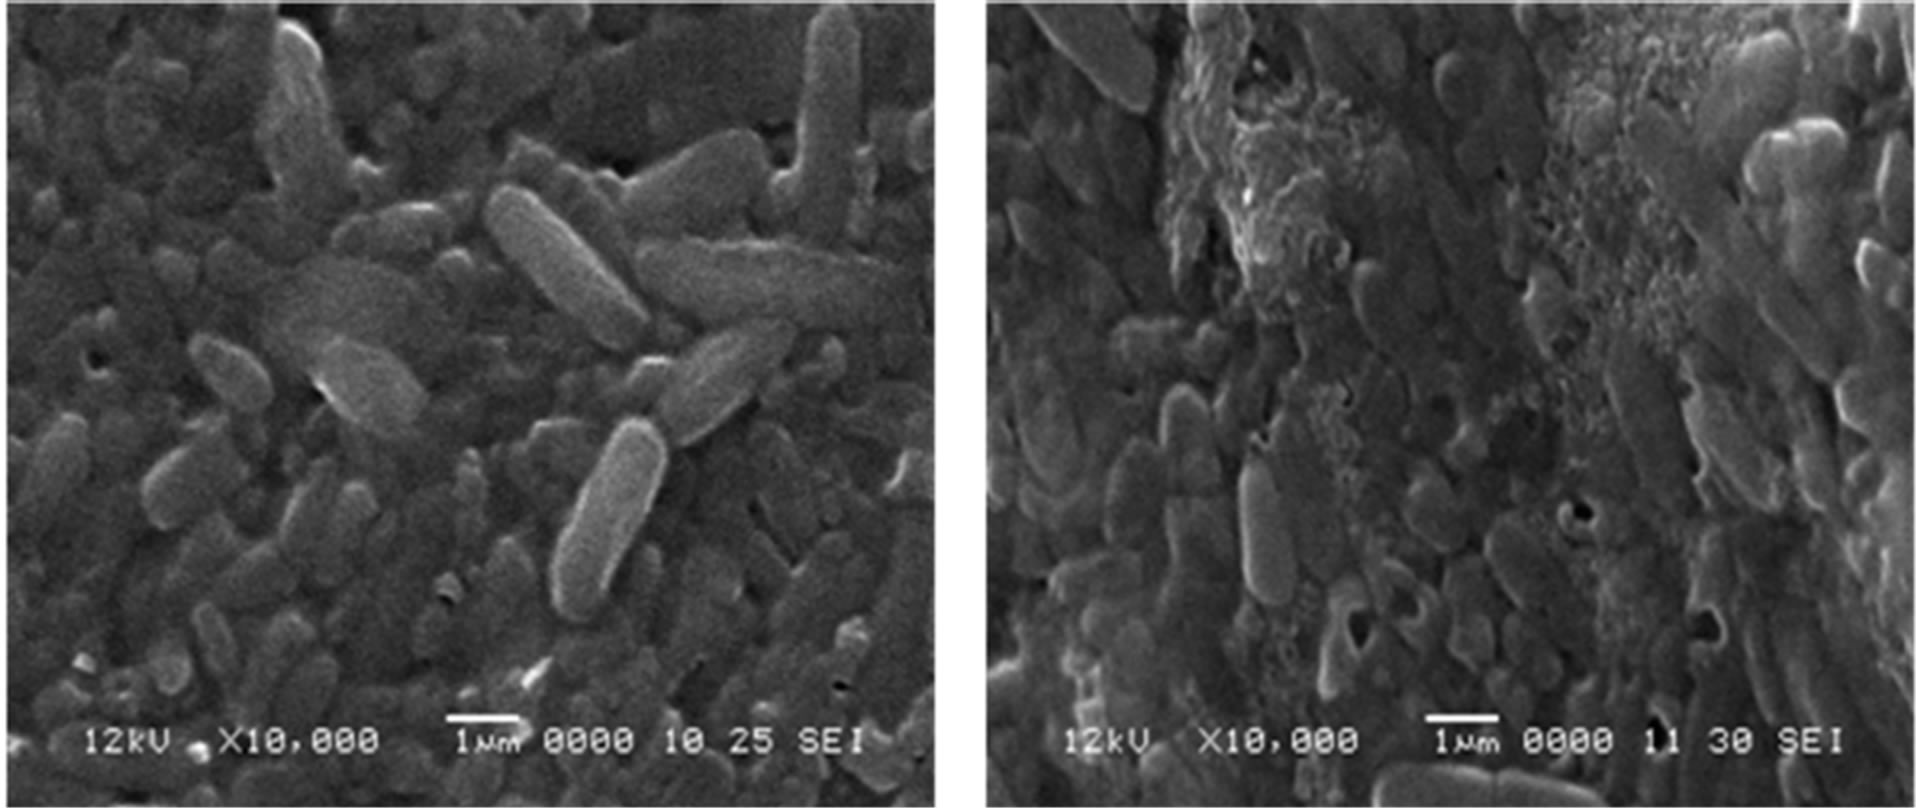
Figures 7(a) and (b) shows SEM photographs of both the untreated (a) and the treated (b) samples. The remarked destructions of the cell-wall of the microorganisms illustrated by SEM image shown in Figure 7 confirm that the rapture of the cells caused by the plasma active species is the main factor affecting the decontamination mechanism of the microorganisms. Such rapture of the cells can be referred to the oxidation processes of the cell walls by the active oxidant species generated by electro-spraying corona discharge.
3.3. Optical Emission Spectra
To identify the various reactive species generated during the electrospraying corona discharge process, the emission spectra, in the wavelength range of 270 to 430 nm, have been recorded. Typical emission spectra of the air corona discharge and electrospraying corona discharge are shown in Figure 8, in the range of wavelength of 270 -
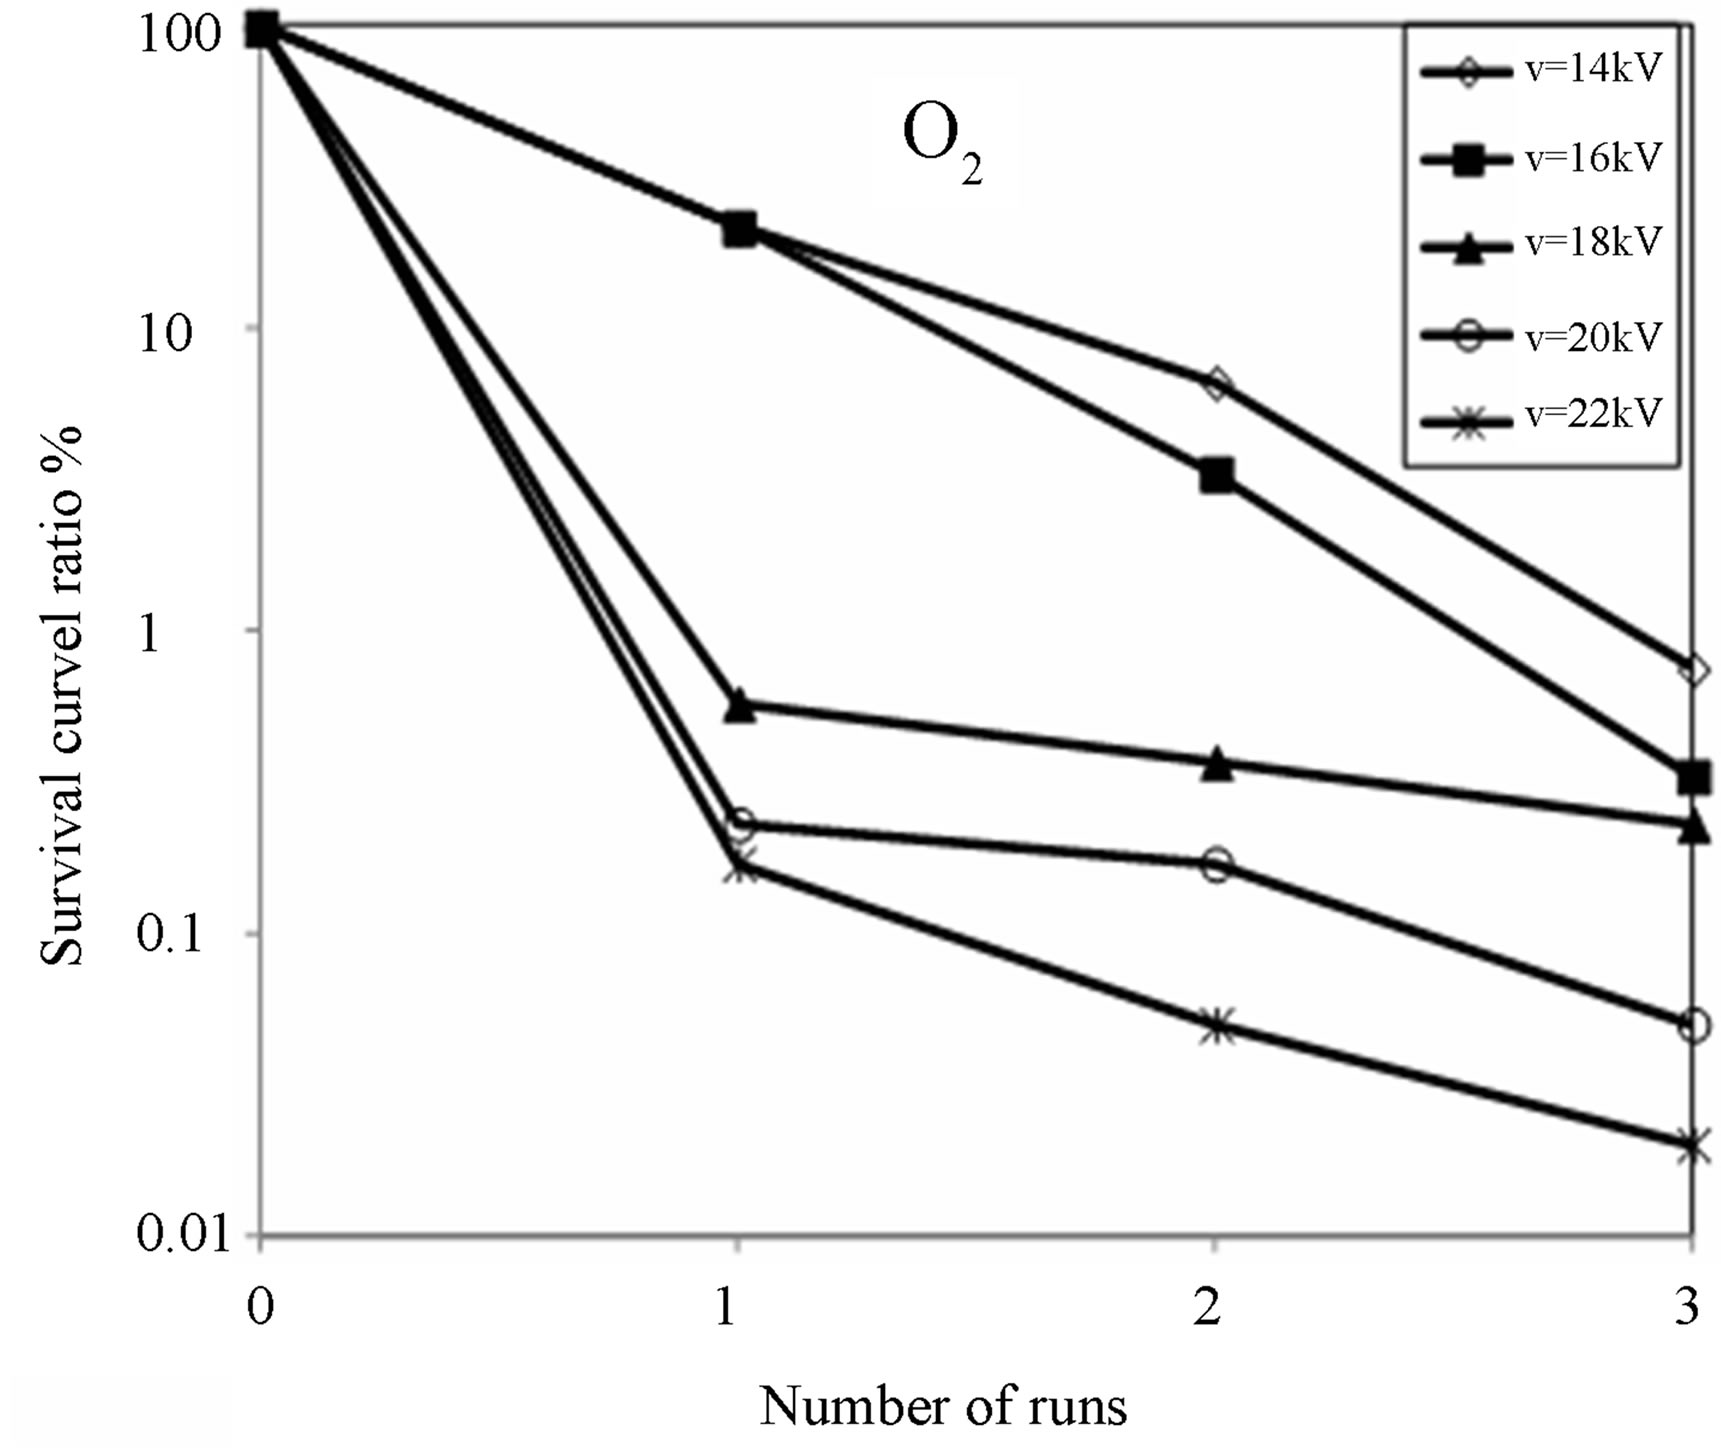
Figure 6. Survival curve ratio at different applied voltage as a function of no. of runs using oxygen as a working gas.
 (a) (b)
Figure 7. SEM of untreated (a) and treated (b) microorganism.
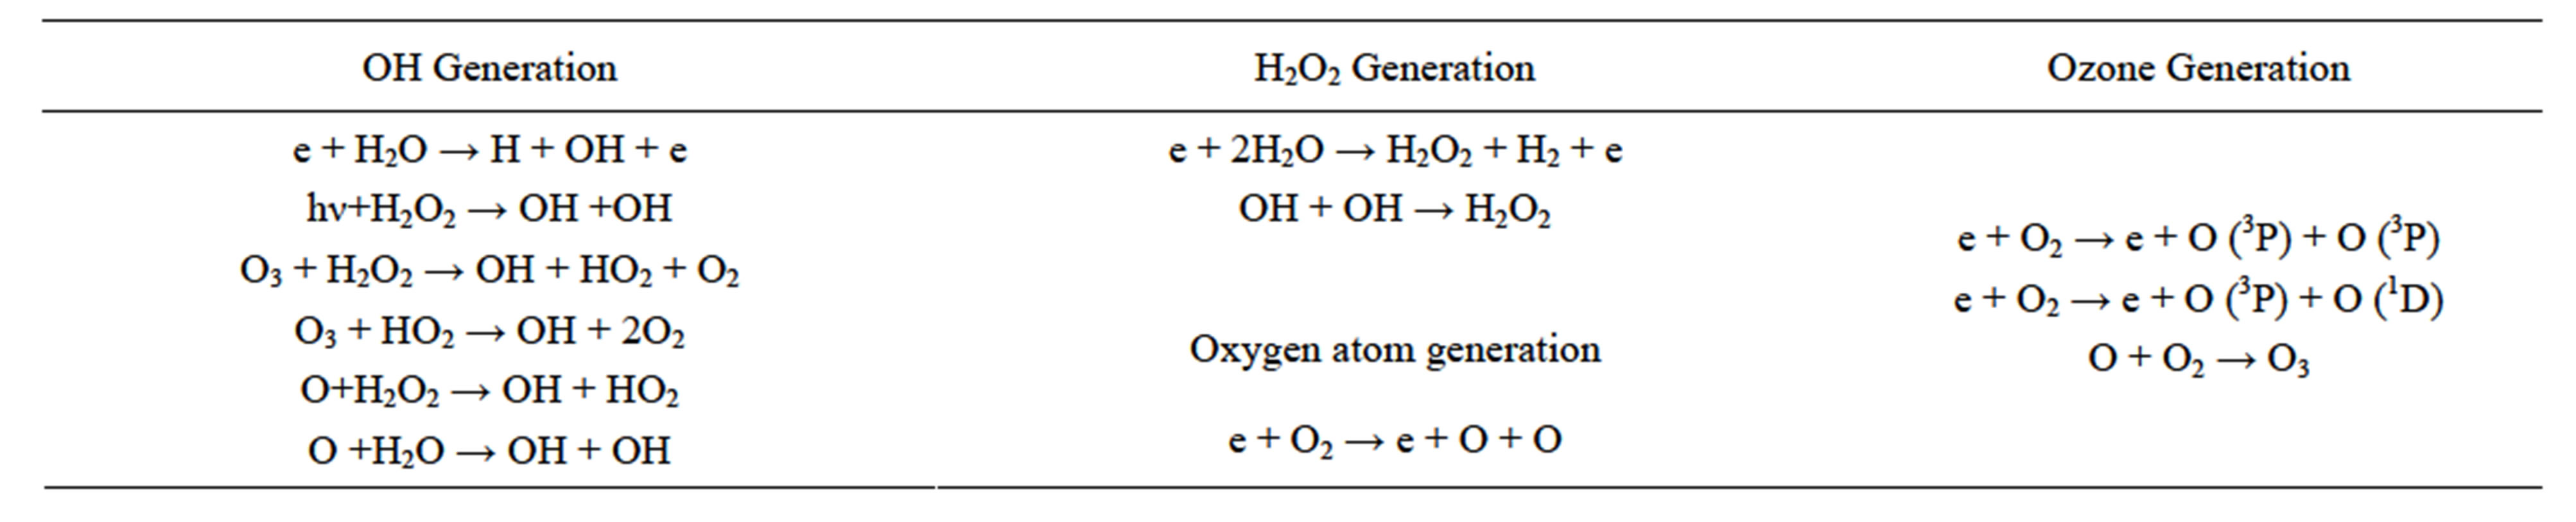
Table 1. Radicals generation during electrospraying corona discharge.
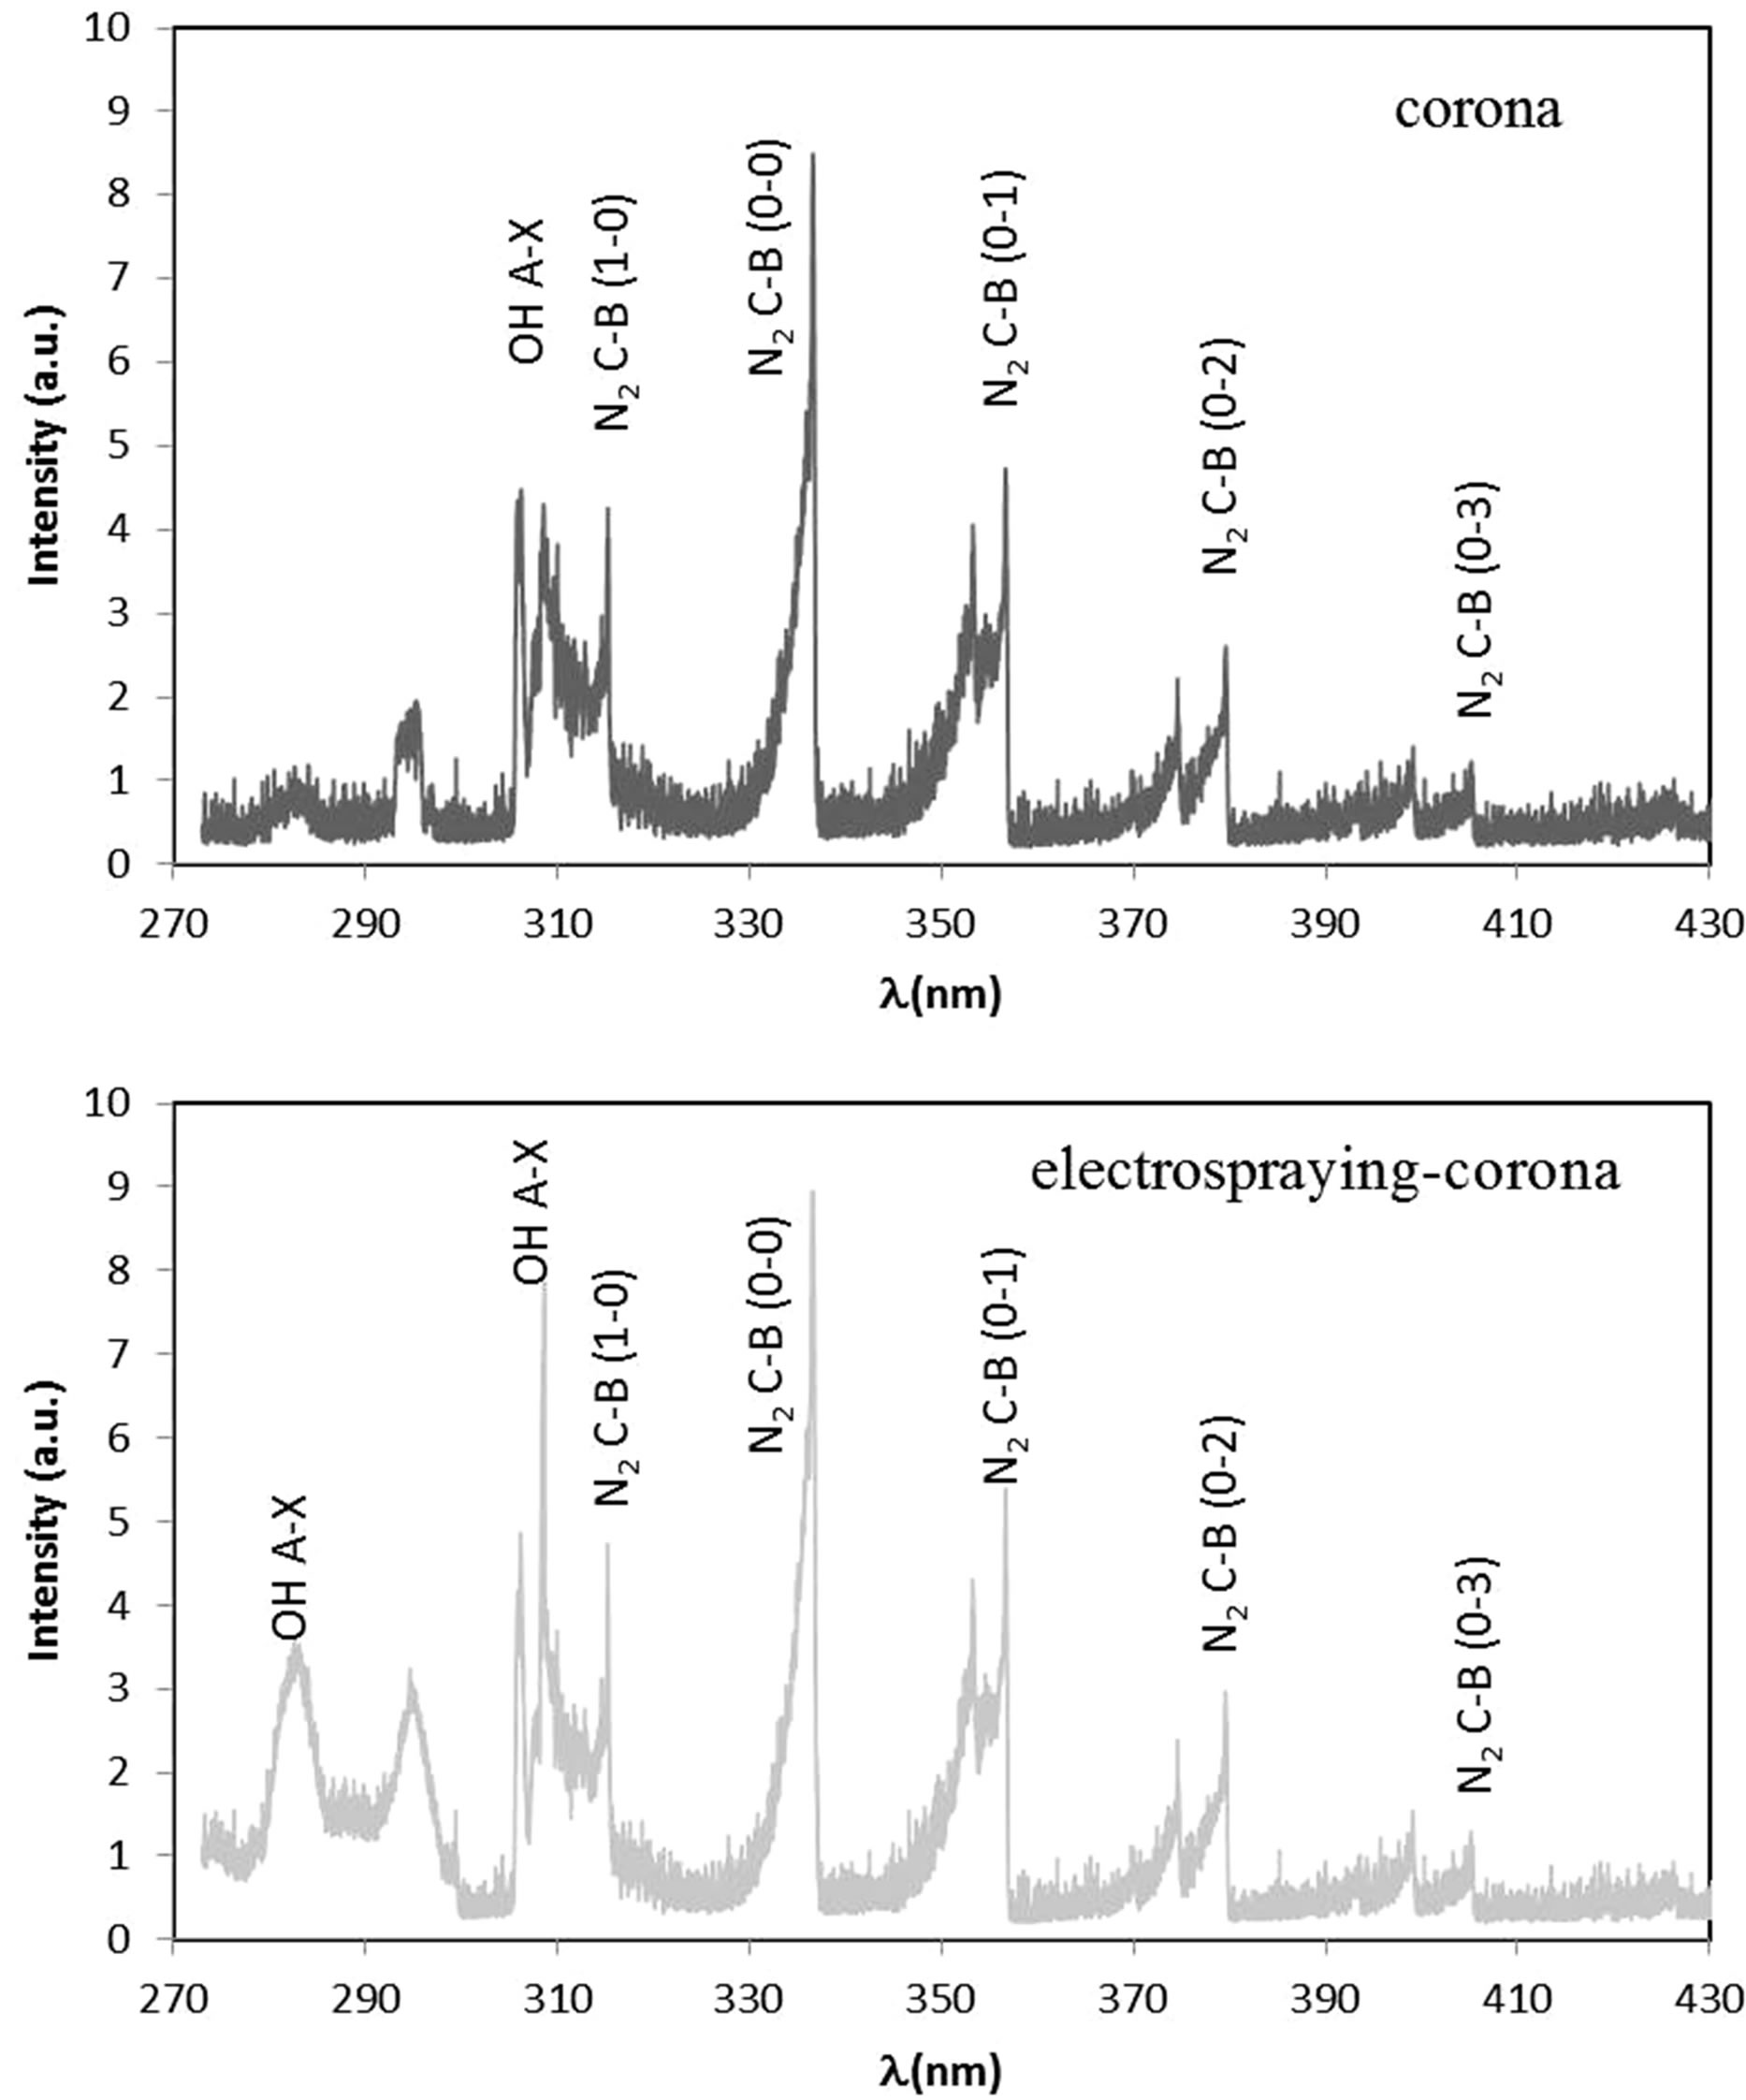
Figure 8. Optical emission spectra of corona discharge and electrospraying corona discharge.
430 nm. The spectrum collected from the corona discharge produced in air showed that the N2 second positive system emission bands are dominating. The observed N2 emission bands are the transitions N2C3Pu − B 3Pg(n1 = 0, 1, 2, and 3 and n2 = 0, 1, 2, and 3) transitions [17]. The excitation energies of the N2C3Pu states for n1 = 0 to 3 are 11.178 eV, 11.425 eV, 11.668 eV, and 11.908 eV, respectively.
The spectrum collected from the corona discharge in air has also showed OH emission lines. The observed OH emission is from the OH (A 2S − X 2P) (0 – 0) transition. The excitation energy of the OH A2S state is 4.2 eV. Besides, to generate OH, the gas phase H2O from the ambient air has to be dissociated into OH and H. The dissociation energy of H2O is 5.1 eV [18]. On the other hand, emissions from electrospraying corona discharge showed an increase in the intensity of the OH emission lines in addition to the N2 emission lines. The OH molecules recorded in the spectra are produced due to water dissociation caused by electron impact, i.e. e + H2O → OH + H + e. Results of the OE measurements confirm the vital role of OH radicals produced in the electrospraying corona discharge in the decontamination process.
4. Conclusion
A novel system for wastewater decontamination has been developed based on the combination of corona discharge and electro-spraying in the same reactor using the same power supply using air and oxygen as working gas at atmospheric pressure. Reactive oxidants such as OH, O, O3 and H2O2 have been found to be generated in electrospraying corona discharge system and play the major role in the decontamination processes. Electro-spraying plays an important role in increasing the exposure area of the treated water for larger contact area between the water droplets and the oxidant species formed inside the discharge zone. Also, electro-spraying increases the density of water vapor inside the reactor and hence increases the production rate of some active oxidant species such as OH and H2O2. The system showed high ability for the decontamination of the wastewater by killing the microorganisms. A complete decontamination has been achieved at 3 runs in air and only one run in oxygen. SEM images showed complete and partial destructions in the cells wall as a result of the oxidation process by oxidants which have been generated in the electro-spraying corona discharge. The system showed higher efficiency of treatments when using oxygen gas because of the increase in the density of oxidant species such as: OH, O3, O and H2O2. Optical emission spectra confirmed the production of OH radicals responsible for the decontamination.
REFERENCES
- R. Droste, “Theory and Practice of Water and Wastewater Treatment,” John Wiley and Sons, New York, 1996.
- C. Christos, A. Kapalka, S. Malato, S. A. Parsons, I. Poulios and D. Mantzavinos, Journal of Chemical Technology and Biotechnology, Vol. 183, 2008, pp.769-776.
- E. Mohammed, H. H. Abdel Ghafar, N. Morgan, S. Hassaballa, A. Samir, F. Elakshar and A. A. Garamoon, IEEE Transactions on Plasma Science, Vol. 40, 2012, pp. 29-34. http://dx.doi.org/10.1109/TPS.2011.2171373
- J. B. Fenn, M. Mann, C. K. Meng, S. F. Wong and C. M. Whitehouse, Science, Vol. 246, 2007, pp. 64-71. http://dx.doi.org/10.1126/science.2675315
- G. Taylor, Proceedings of the Royal Society A, Vol. 280, 1964, p. 383. http://dx.doi.org/10.1098/rspa.1964.0151
- G. Taylor, Proceedings of the Royal Society of London A: Mathematical Physical & Engineering Sciences, Vol. 313, 1969, pp. 453-475.
- J. Borra, P. Ehouarn and D. Boulaud, Journal of Aerosol Science, Vol. 35, 2004, pp. 1313-1332. http://dx.doi.org/10.1016/j.jaerosci.2004.05.011
- J. M. López-Herrera, A. Barrero, A. Boucard, I. G. Loscertales and M. Márquez, Journal of the American Society for Mass Spectrometry, Vol. 15, 2004, pp. 253-259. http://dx.doi.org/10.1016/j.jasms.2003.10.018
- B. Sun, M. Sato and J. S. Clements, Journal of Physics D: Applied Physics, Vol. 32, 1999, pp. 1908-1915. http://dx.doi.org/10.1088/0022-3727/32/15/319
- E. Nasser, “Fundamentals of Gaseous Ionization and Plasma Electronics,” Wiley-Interscience, New York, 1971.
- A. Von Engel, “Ionized Gases,” Oxford, 1965.
- L. Loeb, “Electrical Coronas: Their Basic Physical Mechanisms,” University of California, Press Berkeley, 1965.
- T. Sugiarto, S. Ito, T. Ohshima, M. Sato and J. D. Skalny, Journal of Electrostatics, Vol. 58, 2003, pp. 135-145. http://dx.doi.org/10.1016/S0304-3886(02)00203-6
- A. Joshi, B. R. Locke, P. Arce and W. C. Finney, Journal of Hazardous Materials, Vol. 41, 1995, pp. 3-30. http://dx.doi.org/10.1016/0304-3894(94)00099-3
- B. Sun, M. Sato and J. S. Clements, Environmental Science & Technology, Vol. 34, 2000, pp. 509-513. http://dx.doi.org/10.1021/es990024+
- A. Garamoon, F. Elakshar, A. Nossair and E. Kotp, Plasma Sources Science and Technology, Vol. 11, 2002, pp. 254-259. http://dx.doi.org/10.1088/0963-0252/11/3/305
- Z. Machala, M. Janda, K. Hensel, I. Jedlovsky, L. Lestinska, V. Foltin, V. Martisovits and M. Morvova, Journal of Molecular Spectroscopy, Vol. 243, 2007, pp. 194- 201.
- X. Lu, Z. Xiong, F. Zhao, Y. Xian, Q. Xiong, W. Gong, C. Zou, Z. Jiang and Y. Pan, Applied Physics Letters, Vol. 95, 2009, Article ID: 181501. http://dx.doi.org/10.1063/1.3258071
NOTES
*Corresponding author.