Modern Economy
Vol. 3 No. 4 (2012) , Article ID: 21286 , 6 pages DOI:10.4236/me.2012.34058
Venture Capital and Innovation in Europe
1Department of International Economic Relations and Development, Democritus University of Thrace, Komotini, Greece
2Department of Economics, Aristotle University of Thessaloniki, Thessaloniki, Greece
Email: ggeronik@ierd.duth.gr, gpapahr@econ.auth.gr
Received February 17, 2012; revised February 28, 2012; accepted April 23, 2012
Keywords: Innovation; Patents; Venture Capital; Entrepreneurship; Dynamic Panel Data
ABSTRACT
In this paper we search for evidence signifying whether VC activity is demand or supply stimulated. Namely, we examine whether innovation and entrepreneurship are fostered by Venture Capital (VC) investments or whether innovative entrepreneurship is a precondition of a VC involvement. Based on a European panel of VC investments, we test the direction of causality between VC and innovation (proxied by annual patent applications at the European Patents Office). We present evidence indicating that causality runs from patents to VC suggesting that, in Europe, innovation seems to create a demand for VC and not VC a supply of innovation. In this sense, innovative ideas seem to lack more than funds in Europe. We explain our findings on the basis of information asymmetry issues and irreversibility considerations of VC investments.
1. Introduction
Venture capital (henceforth VC) has emerged in the second half of the twentieth century as playing a key role in the financing of young and dynamic entrepreneurial firms. According to Gompers and Lerner [1], some of the most renowned high-tech innovators in the US, such as Apple Computers, Cisco Systems, Genentech, Microsoft, Netscape, and Sun Microsystems, have been developed thanks to VC assistance and thus, it plays an indisputable role in entrepreneurial success and technological progress in developed countries.
Research on the topic has been abundant, most researchers stressing the role of VC in fostering entrepreneurship and innovation. Timmons and Bygrave [2], Hellman and Puri [3], Kortum and Lerner [4] and Lerner [5] have analyzed the US evidence, while Bottazi and Da Rin [6] have found that, although the European VC market lags behind its US counterpart, European VC contributed substantially to the development of innovative companies listed in the Euronm stock market. The underlying idea in the literature above is the seemingly unquestionable assumption that VC generates innovation or, alternatively, that innovation and entrepreneurial accomplishment is an output rather than an input of the VC process.
The widely accepted view of VC to innovation causality—let us call it the direct causation hypothesis—has been challenged by Hirukawa and Ueda [7] using patent grants and Total Factor Productivity (TFP) as proxies of technological progress. On the basis of a US manufacturing sample, they find that when TFP is used as a measure of innovation, causality runs from innovation to VC. However, when the respective proxy is patents, reverse causation is not supported.
In this paper we explore these contrasting views on the role of European VC on innovative entrepreneurship and investigate the direction of causality in the innovation to VC relation. Based on a panel dataset of annual VC investments for 15 European countries for the period 1995-2004, we search for evidence in support of the direct/reverse causation. We follow the R&D literature, and we use European patent applications as a proxy of innovative entrepreneurship. We introduce causality in Granger’s [8] sense, that is, we test whether the inclusion of lagged values of a regressor in the right-hand side of the regression equation, controlling for lags of the regressand, improves predictability. The empirical method is based on standard dynamic panel data analysis, taking into account that patent applications are positive integers (counts).
Our evidence seems to run against the direct causation and in support of the reverse causation hypothesis, i.e. the innovation to VC causality. In our opinion, this possibly implies that innovative entrepreneurs tied with a probable patent grant have an edge over their non-patent counterparts in signaling higher “quality”, alleviating adverse selection issues and attracting VC finance. Our findings indicate that equilibrium VC activity is probably determined by the demand for high risk financing rather than the availability of funds to be supplied.
The paper is structured as follows. First, we discuss the issues involved in the role of VC in entrepreneurship and innovation and we explicitly pose our hypothesis to be tested; next we present our dataset and in a subsequent section we lay down explicitly our methodology and present the results. Finally, we epitomize our research in a concluding section.
2. The Role of VC in Innovative Entrepreneurship and Technological Progress
Schumpeter’s initial claim was that dynamic entrepreneurs are the source of innovation, but in his later works he attributed innovation to large corporations (Nooteboom [9]). Large firms have the edge over their smaller counterparts due to capital market imperfections and information asymmetries and their ability to fund independent R&D projects using their own resources. More recent studies examining the issue of the firm’s size on the production of innovation appear to be inconclusive (Tether [10]). However, the emergence of VC markets in modern economies has provided some support in Schumpeter’s initial claim. Due to the lack of collateral, small innovative firms, mostly individual entrepreneurs, have limited access to capital markets in order to finance their projects and hence, external equity is the main alternative. Venture Capitalists (henceforth VCsts), the managers of VC funds, come to bridge this funding gap by providing equity to small, dynamic and innovative firms, becoming thus, co-owners of the investee’s project.
Although the role of VC in technological progress is in general acknowledged, it has received less attention in empirical research, as opposed to R&D investments whose contribution has been examined extensively in numerous papers. Pakes and Griliches [11] were among the first to suggest a significant relation between R&D and patents. A series of related papers have found similar results. Namely, Hall et al. [12], Cincera [13], Crepon and Duquet [14], Blundell et al. [15] and others report a quite strong effect of R&D to patents at the firm level.
Kortum and Lerner [4] are among the few to investigate the VC to patent relation. Using US industry level data, they have showed that VC and R&D have a significant effect on patents and estimated that a VC dollar is three times more valuable in generating patents compared to a normal dollar. Narrowing the focus to VC, Hellman and Puri [3] have presented evidence at the firm level indicating that companies “pursuing an innovator rather than an imitator strategy are more likely to obtain Venture Capital financing”. Finally, Hirukawa and Ueda [7] have presented US evidence in support of the reverse hypothesis (“innovation comes first” in their terminology), using Total Factor Productivity as a proxy for innovation. In their view, a boom in new technologies may give rise to new start-ups increasing thus, the demand for Venture Capital financing.
In our opinion, reverse causation may also be explained in terms of information asymmetry considerations (Sahlman [16]). Venture Capital involvement might be deterred in the presence of severe adverse selection issues, due to the risk of venturing into an ex post unacceptably risky entrepreneurial project. In this context, a patent can act as a signal, indicate the entrepreneur’s higher quality, reduce due diligence’s cost and, as a consequence, attract prospective VC investment.
Moreover, VC, especially when funding the early stages of development1, can be considered as irreversible investment and according to the irreversibility-delay hypothesis (Dixit and Pindyck [17]) the decision to invest may be deterred in the presence of uncertainty over future cash flows. VC, especially early stage VC, is clearly a sunk cost since it refers mostly to firms with no production and no secondary market for their assets. Irreversibility might also make the cost of adverse selection more severe and thus the signaling effect of a patent more valuable.
Hence, we propose to test the following hypothesis.
Hypothesis: Due to information asymmetries and irreversibility considerations, innovation generates, rather than is generated by, VC activity.
3. Data Description
Although the preceding analysis refers mostly to the firm level, the issues directly extend to any level of aggregation. We use annual VC data covering the period 1995- 2004 for 15 European countries obtained from the European Venture Capital Association (EVCA). The countries are Austria, Belgium Denmark, Finland, France, Germany, Greece, Italy, Netherlands, Norway, Portugal, Spain, Sweden, Switzerland, and UK.
Patent data refer to the European Patents Office (EPO) and have been obtained from the Eurostat Database [18]. We as well choose patent applications rather than patent grants, as is typically the case in existing research, since there might be a significant time lag between filing an application and receiving a grant (Hall et al. [19]). Thus, we believe that the number of patent applications is a better proxy for a country’s innovation activity at a given year. On the other hand, the signaling effect of a patent is more pronounced on the time of application rather than on the time of the patent grant. The same holds, in our opinion, for the irreversibility-delay effect: a patent application is more uncertain than a patent grant or a patent rejection. As Hirukawa and Ueda [7] state, patent applications refer to innovative ideas, contrary to TFP growth which refers to new technology already implemented in the production. Since VC is by definition directed to newly establish small firms, we believe that TFP growth would not be a good proxy of innovativeness in the VC financed ventures.
Statistical parameters of our sample are depicted in Tables 1 and 2. Table 1 presents European VC, Business R&D and patenting activity in 2004 and Table 2 presents the descriptive statistics of our sample. The interested observer will note the great diversity across European countries both in terms of VC investment, R&D expenses but especially in the patent applications data with Germany showing the maximum patent count. UK and Sweden seem to have the highest VC activity in Europe whereas other countries like Greece and Italy seem to lag far behind the average.
Our EPO statistics on patent applications are classified by “priority date” that is, by the year of first filling in any national or regional patent organization (OECD patent glossary [20]) prior to EPO. Ahead of applying to EPO, one might have applied to another national or regional office reserving thus, priority to a subsequent application to a second patents office (EPO for example) for the same patent within a given period of time. The European Patent Convention (EPC) restricts this period to one year (Article 87(1) [21]).
4. Methodology
4.1. Direct Causality
We test whether lagged counts of patent applications— controlling for lagged values of VC investments—improve predictability of current VC or in other words, whether coefficients of lagged patent applications are jointly significant. In order to correct for heterogeneity (fixed effect) of the cross section units, when testing for direct causation, we use a linear dynamic distributed lag model in first differences. The model is estimated using a dynamic panel data methodology (Holtz-Eakin et al. [22] and Arellano and Bond [23]).
The initial equation to be estimated is:
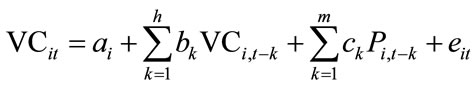 (1)
(1)
with eit = ηi + uit, where all variables are expressed in logarithms, i and t denote the cross section and time dimension respectively, uit is the usual disturbance and ηi is the individual or fixed effect. We make the standard
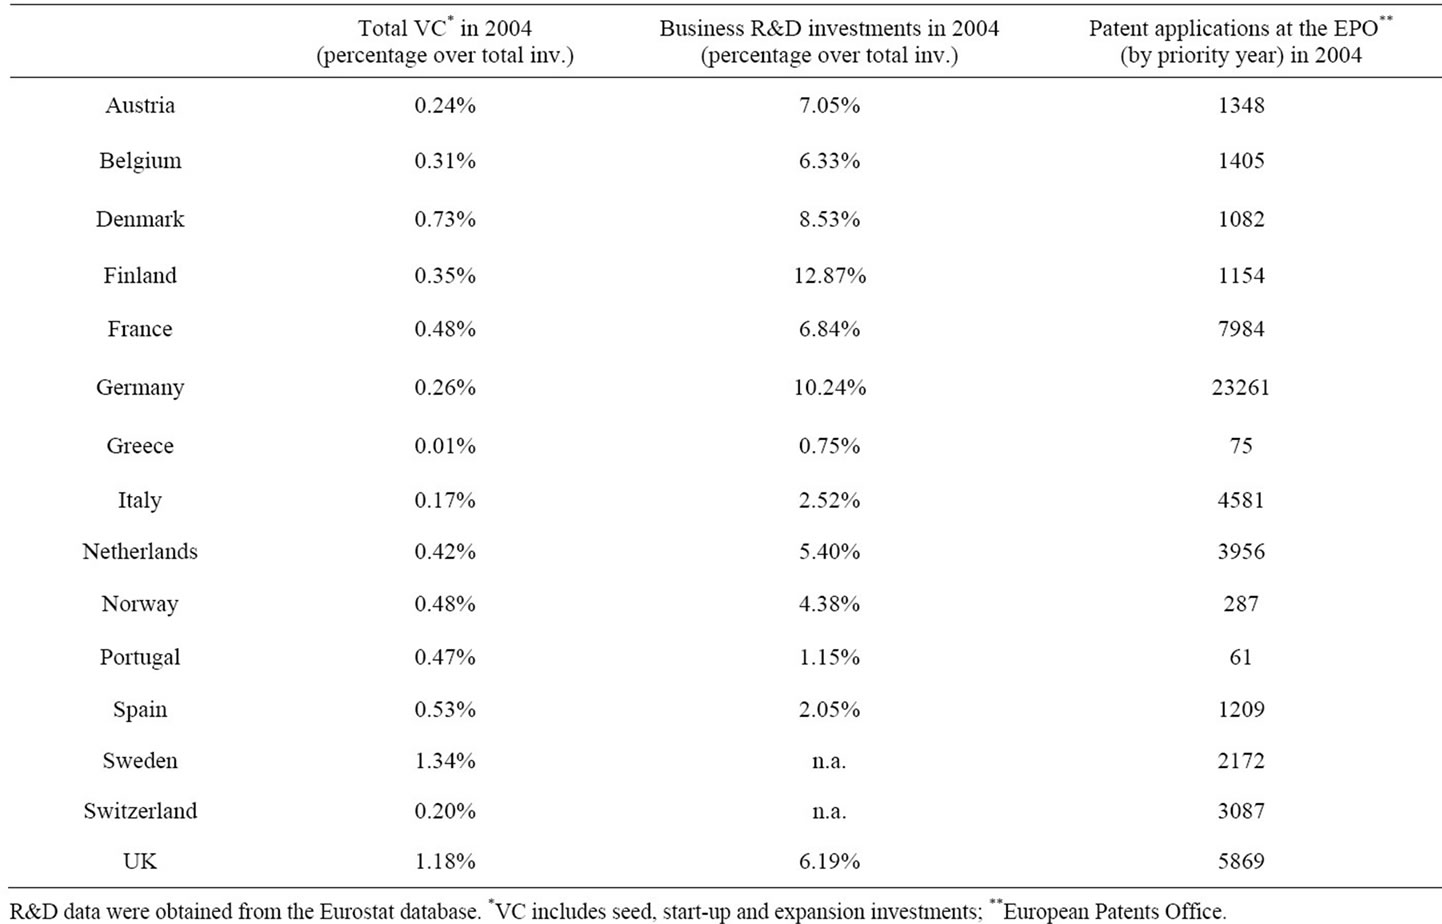
Table 1. VC, business R&D and patenting activity in 2004.
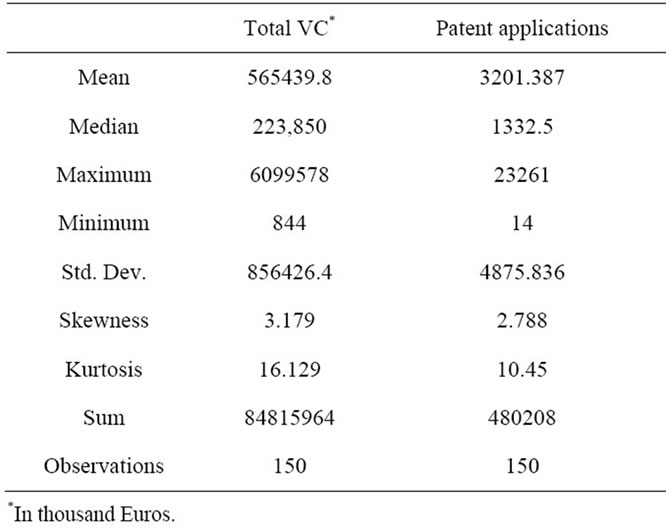
Table 2. Descriptive statistics.
hypothesis that ηi represents constant over time characteristics of the cross section units which might be correlated with the regressors. Different countries for example, might have time-invariant but different innovation networks or different mentality and attitude towards innovation, which might affect both VC investments and patenting. All lagged values VCi,t−k are correlated with αi and thus, with eit which induces a bias in OLS. Taking the first differences eliminates this individual effect and the respective bias:
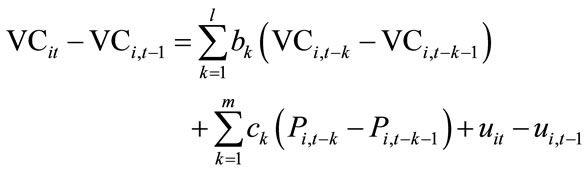 (2)
(2)
Since the right hand VCi,t−1 still depends on ui,t−1, and OLS is still not the proper method, we apply Arellano and Bond’s [23] Generalized Method of Moments. We assume that past values of VC and P are not correlated with the current error term and we use lagged values of Patents and VC as instruments such that the following orthogonality conditions are satisfied:
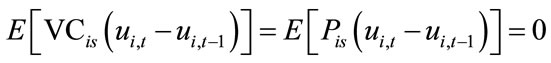 , (3)
, (3)
for all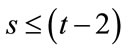 .
.
The above orthogonality conditions, relying on the absence of second order serial correlation among the first-differenced residuals (Arellano and Bond, 1991), are also proposed by Holtz-Eakin et al. [22]. For convenience we take  and we use the Wald test to test the null hypothesis that all lagged coefficients of patents are not significant:
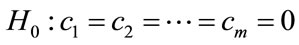 (4)
(4)
Rejection of the null hypothesis would imply that patents cause VC. Due to our small sample size and the limited time series dimension we apply this test only for m = 1, 2 and 3.
4.2. Reverse Causality
In order to test the reverse causality, i.e. from innovation to VC, an appropriate model is being called for. Since our data on patents are counts (positive integers) we have to apply models designed to facilitate the non-negativity and discreteness of patents. Furthermore, the panel form of our data may introduce individual heterogeneity of the cross section units which has to be taken explicitly into account.
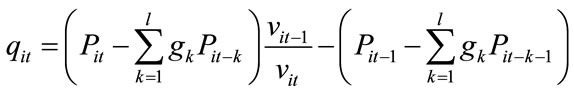
Assuming that our count variable follows a Poisson process and adding lags of the count among the regressors, we end up with a variant of the Linear Feedback Model (LFM) as the one introduced by Cincera [13], Blundell et al. [15] and Uchida and Cook [24] which in our purpose takes the following form:
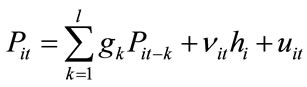 (5)
(5)
where 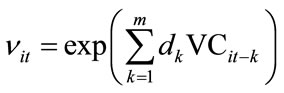 and
and  and ηi is the individually specific characteristic (fixed effect).
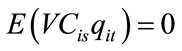
Except for the drawbacks mentioned earlier, individual heterogeneity may also generate data overdispersion, that is, a conditional data variance significantly greater (and not equal to) than the conditional data mean (as in the usual Poisson specification) (Cincera [13]). Since ηi enters the model multiplicatively, usual differencing doesn’t eliminate it. We use instead the quasi-differenced Generalized Method of Moments (GMM) estimator proposed by Blundell et al. [15] with the following orthogonality conditions:
 for all
  (6)
(6)
and
 for all
  (7)
(7)
where
In order to examine the significance of the VC to patents causality, we assume that l = m and test the null hypothesis that all coefficients of lagged VC investments are jointly zero:
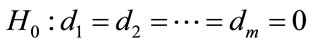 (8)
(8)
We test the reverse causation hypothesis with the Wald test for m = 1, 2 and 3 and we check for second order serial correlation (Uchida and Cook, 2007).
5. Results
Our estimates are presented in Tables 3 and 4. Table 3 presents the results of patents to VC causality test. The individual Patent coefficients for two lags appear to be positive and significant for all specifications. Moreover, the Wald tests for two and three lags specifications indicate that the effect of lagged patents is jointly significant. At one lag, on the contrary, the coefficient of patents is not significant at acceptable probability levels.
Regarding the VC to patents causality results depicted in Table 3, the Wald tests show that there is no joint significance of the VC coefficients for two and three lags specifications. At one lag, the coefficient of VC is found to be significant but with a negative sign, which is in line with Hirukawa and Ueda’s [7] finding.
As depicted in Table 4, the Wald tests indicate that VC does not cause patents in our sample, whereas the joint significance of the patent coefficients in Table 3 verifies the hypothesis that patents cause VC, that is, innovation precedes VC investments. Reverse causation is generated, in our opinion, by information asymmetries and irreversibility considerations. A small firm or an entrepreneur has to somehow indicate the quality of his project in order to be a good candidate for VC finance. Applying for a patent costs both money and time, thus a patent application signals high project quality and confers to the applicants cum investees an advantage over their non-applicant competitors. In other words, the significant resources that Venture Capitalists spend during the due diligence and valuation process (Sahlman [16]) may be reduced at the presence of a probable patent. Moreover, given that VC investment is mostly irreversible, patent applicants will increase their edge even more. Hence, it seems that international differences in VC activity across European countries are rather demand than supply side induced: ideas rather than funds are at shortage.
6. Conclusions
In this paper we have proposed a causality testing methodology in order to investigate whether innovative entrepreneurship is an input or an output to the VC process, i.e. whether causation is direct, from innovation to VC, or reverse, from VC to innovation. The widely accepted innovation to VC direct causation was tested by means of a GMM estimation of a linear dynamic panel in first differences, while reverse causation by means of a Linear Feedback Model due to the count nature of patents. Our findings indicate that causality in Europe runs from patents to VC and not the other way around. Adverse selection problems and irreversibility considerations may well explain the reason why innovation precedes rather that follows VC activity.
We also believe that, in the same line of argument, the low VC activity in some countries might also be attributable to the absence of value creating innovative ideas rather than the lack of available funds. Although the preceding empirical analysis refers to country level data, we
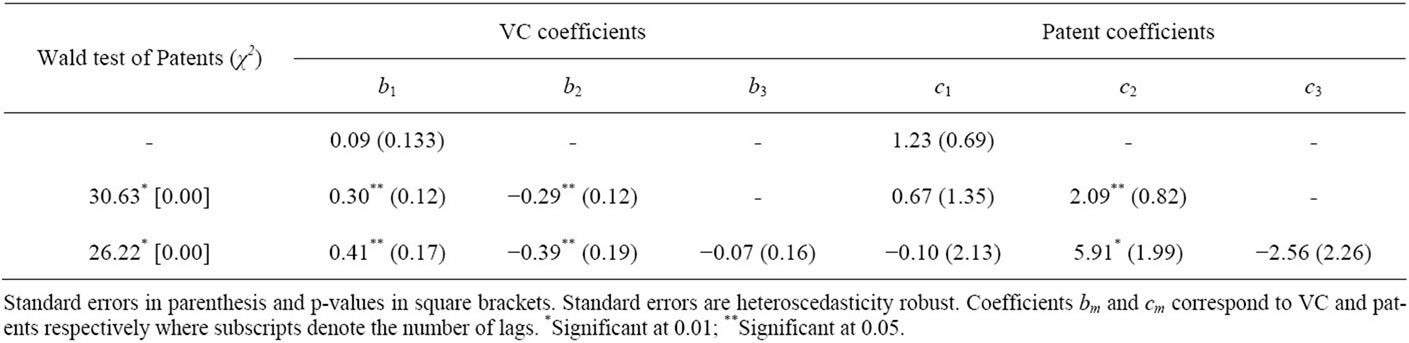
Table 3. Patents cause VC.
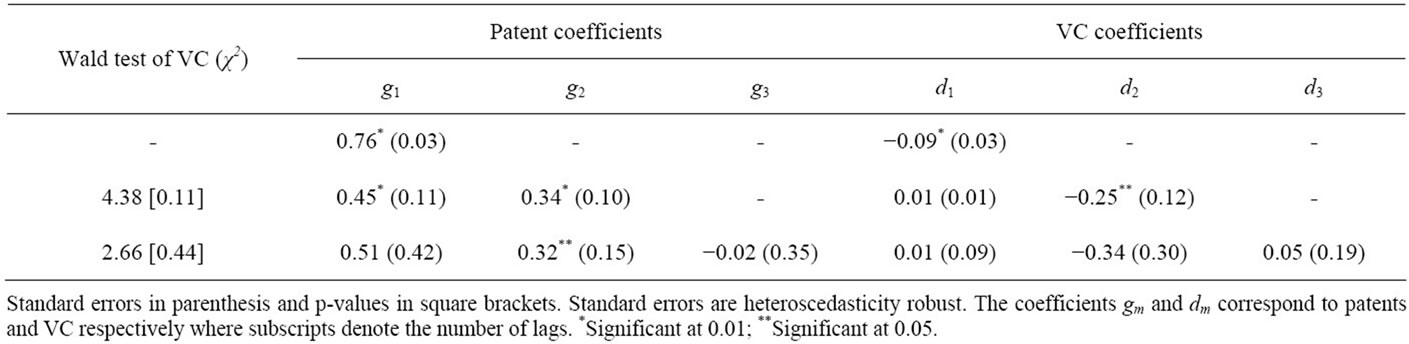
Table 4. VC causes patents.
have no special reason to believe that firm level behavior would generate conflicting results on the VC to patent relation.
REFERENCES
- P. Gompers and J. Lerner, “The Venture Capital Revolution,” Journal of Economic Perspectives, Vol. 15, No. 2, 2001, pp. 145-168. doi:10.1257/jep.15.2.145
- J. A. Timmons and W. D. Bygrave, “Venture Capital’s Role in Financing Innovation for Economic Growth,” Journal of Business Venturing, Vol. 1, No. 2, 1986, pp. 161-176. doi:10.1016/0883-9026(86)90012-1
- T. Hellman and M. Puri, “The Interaction between Product Market and Financing Strategy: The Role of Venture Capital,” The Review of Financial Studies, Vol. 13, No. 4, 2000, pp. 959-984. doi:10.1093/rfs/13.4.959
- S. Kortum and J. Lerner, “Assessing the Contribution of Venture Capital to Innovation,” Rand Journal of Economics, Vol. 31, No. 4, 2000, pp. 674-692. doi:10.2307/2696354
- J. Lerner, “Boom and Bust in the Venture Capital Industry and the Impact on Innovation,” Federal Reserve Bank of Atlanta Economic Review, Vol. 2002, No. Q4, 2002, pp. 25-39.
- L. Bottazzi and M. Da Rin, “Venture Capital in Europe and the Financing of Innovative Companies,” Economic Policy, Vol. 17, No. 34, 2002, pp. 229-265. doi:10.1111/1468-0327.00088
- M. Hirukawa and M. Ueda, “Venture Capital and Innovation: Which Is First?” Pacific Economic Review, Vol. 16, No. 4, 2011, pp. 421-465. doi:10.1111/j.1468-0106.2011.00557.x
- C. W. J. Granger, “Investigating Causal Relations by Econometric Models and Cross-Spectral Methods,” Econometrica, Vol. 37, No. 3, 1969, pp. 424-438. doi:10.2307/1912791
- B. Nooteboom, “Innovation and Diffusion in Small Firms: Theory and Evidence,” Small Business Economics, Vol. 6, No. 5, 1994, pp. 327-347. doi:10.1007/BF01065137
- B. S. Tether, “Small and Large Firms: Sources of Unequal Innovations?” Research Policy, Vol. 27, No. 7, 1998, pp. 725-745. doi:10.1016/S0048-7333(98)00079-1
- A. Pakes and Z. Griliches, “Patents and R&D at the Firm Level: A First Report,” Economic Letters, Vol. 5, No. 4, 1980, pp. 377-381. doi:10.1016/0165-1765(80)90136-6
- B. H. Hall, Z. Griliches and J. A. Hausman, “Patents and R&D: Is There a Lag?” International Economic Review, Vol. 27, No. 2, 1986, pp. 265-283. doi:10.2307/2526504
- M. Cincera, “Patents, R&D, and Technological Spillovers at the Firm Level: Some Evidence from Econometric Count Models for Panel Data,” Journal of Applied Econometrics, Vol. 12, No. 3, 1997, pp. 265-280. doi:10.1002/(SICI)1099-1255(199705)12:3<265::AID-JAE439>3.0.CO;2-J
- B. Crepon and E. Duguet,. “Estimating the Innovation Function from Patent Numbers: GMM on Count Panel Data,” Journal of Applied Econometrics, Vol. 12, No. 3, 1997, pp. 243-263. doi:10.1002/(SICI)1099-1255(199705)12:3<243::AID-JAE444>3.0.CO;2-4
- R. Blundell, R. Griffith and F. Windmeijer, “Individual Effects and Dynamics in Count Data Models,” Journal of Econometrics, Vol. 108, No. 1, 2002, pp. 113-131. doi:10.1016/S0304-4076(01)00108-7
- W. A. Sahlman, “The Structure and Governance of Venture Capital Organizations,” Journal of Financial Economics, Vol. 27, No. 2, 1990, pp. 473-521. doi:10.1016/0304-405X(90)90065-8
- A. K. Dixit and R. S. Pindyck, “Investment under Uncertainty,” Princeton University Press, Princeton, 1994.
- Eurostat, Eurostat Database. epp.eurostat.ec.europa.eu
- B. H. Hall, A. B. Jaffe and M. Tratjenberg, “The NBER Patent Citation Data File: Lessons, Insights and Methodological Tools,” NBER Working Paper 8498, NBER, Cambridge, 2001.
- OECD, Glossary of Patent Terminology. http://www.oecd.org/dataoecd/5/39/37569498.pdf
- European Patents Office (EPO), European Patent Convention. http://www.epo.org/patents/law/legal-texts/html/epc/1973/e/ma1.html
- D. Holtz-Eakin, W. Newey and H. S. Rose, “Estimating Vector Autoregressions with Panel Data,” Econometrica, Vol. 56, No. 6, 1988, pp.1371-1395. doi:10.2307/1913103
- M. Arellano and S. Bond, “Some Tests of Specification for Panel Data: Monte Carlo Evidence and an Application to Employment Equations,” Review of Economic Studies, Vol. 58, No. 2, 1991, pp. 277-297. doi:10.2307/2297968
- Y. Uchida and P. Cook, “Innovation and Market Structure in the Manufacturing Sector: An Application of Linear Feedback Models,” Oxford Bulletin of Economics and Statistics, Vol. 69, No. 4, 2007, pp. 557-580. doi:10.1111/j.1468-0084.2007.00450.x
NOTES
1European Venture Capital Association’s (EVCA) terminology split VC into three stages namely, seed finace (intended for new firms in order to evaluate their initial concept), start-up finance (aiming at the development of the firm’s product before the firm has sold any products) and expansion finance (aiming to assist the growth and expansion of the firm).