Psychology
Vol.5 No.9(2014), Article ID:48080,6 pages
DOI:10.4236/psych.2014.59122
Predicting School Achievement Rather than Intelligence: Does Metacognition Matter?
1Department of Psychology, Universidade Federal de Minas Gerais, Belo Horizonte, Brazil
2Núcleo de Pós-Graduação, Pesquisa e Extensão, Faculdade Independente do Nordeste, Vitória da Conquista, Brazil
3Institute of Psychology, Universidade Federal da Bahia, Salvador, Brazil
Email: cristianogomes@ufmg.br, hfgolino@gmail.com, igor.menezes@me.com
Received 30 May 2014; revised 22 June 2014; accepted 9 July 2014
ABSTRACT
This paper investigates the role of specific and general metacognitive ability on specific and gener- al academic achievement, controlling for the effects of intelligence. Four hypotheses were elabo-rated and empirically tested through structural equation modelling. The sample was composed by 684 students (6th to 12th graders) from a private Brazilian school, which answered to three intel-ligence tests and three metacognitive tests. The modeled hypotheses presented a good data-fit (χ² = 51.18; df = 19; CFI = 1.00; RMSEA = 0.05), showing that the general metacognitive ability explained general academic achievement rather than intelligence, but did not explain specific academic achievement. On the other hand, specific metacognitive ability explained specific academic achievement rather than intelligence, but did not explain general academic achievement. The pre-dictive power of the general metacognitive ability was greater than fluid intelligence in the expla-nation of general academic achievement. In the same line, specific metacognitive ability had a greater predictive power than intelligence and specific knowledge in the explanation of specific academic achievement. Finally, a new structural model of metacognition and its role in academic achievement is proposed.
Keywords: Metacognition, Intelligence, Academic Achievement
1. Introduction
Do psychological variables, other than intelligence, have any relevant predictive value on academic achievement? Gagné and St. Père (2002) raised this question from a consistent analysis of the literature on the predictive value of both intelligence and motivation on academic achievement. Provided that the specialized literature brings much evidence supporting that intelligence usually predicts around 25% to 50% of the students’ performance variance (Deary, Strand, Aith, & Fernandes, 2007; Gustafsson & Undheim, 1996; Naglieri & Bornstein, 2003), and that is not commonly noticeable that another psychological variable shows so high predictive power, the Gagné and St. Père’s question might be considered intriguing. From a more extreme point of view, there are some researchers who claim that intelligence is the only psychological variable that is capable of predicting academic achievement (Gottfredson, 2002a, 2002b; Kuncel, Hezlett, & Ones, 2004), what would make this construct the most important predictor in psychology. However, and paradoxically, Gagné and St. Père (2002) show that most of the studies that investigate the predictive role of some psychological variables on academic achievement other than intelligence usually don’t control for these variables influencing intelligence. Far from regarding the specific results of the Gagné and St. Père’s (2002) study, we intend to focus on the implication of their idea that scholars should “examine the antecedent causal role of intelligence with regard to popular psycho- educational constructs, like academic self-concept, self-efficacy, confidence, self-regulation, and many others” (p. 96). The primacy of intelligence in explaining academic achievement and the doubt about the incremental validity of other psychological variables are both pertinent and provocative issues brought by these authors.
1.1. Evidence against the Primacy of Intelligence The literature on metacognition has yield some results which contrastwiththe assumption that intelligence is more important than other psychological variables to predict achievement and other human behaviors. Some studies have shown that metacognition is as important as, or more important than intelligence to explain aca-demic achievement and learning outcomes (Van der Stel & Veenman, 2008, 2010; Veenman, 1993; Veenman & Beishuizen, 2004; Veenman, Kerseboom & Imthorn, 2000; Veenman & Spaans, 2005; Veenman & Verheij, 2003; Veenman, Wilhelm & Beishuizen, 2004).
Since the aforementioned research share some similarities in the way they are conducted, we will address synthetically some main elements presented in the methodology and results of these studies. Firstly, the main aspect of intelligence that is stated by these studies is specifically the general intelligence. Other important cog-nitive abilities from the field of psychometrics are not present, like fluid intelligence, crystallized intelligence, and so on. Secondly, metacognition is usually considered by these studies to be a general factor that explains ab-ilities such as monitoring, appraisal, and control. The scores of both the metacognitive and general metacogni-tion components are therefore produced within these studies by judges who analyze the individual’s verbal re-ports about their strategies, plans, monitoring, among others. This is known as the ‘think aloud’ method. Given that this method and the scores from judges require intensive protocols and individual data collection strategies, the sample size designed for these studies are usually small.
In order to explain the relationship between intelligence, metacognitive skills and academic achievement, Veenman and Elshout (1991) proposed three models. The first one, called intelligence model, postulates that metacognitive activities are an integral part of intellectual ability as metacognition does not have any incremen-tal validity apart from intelligence. The second one is the independency model, in which intellectual ability and metacognition are viewed as entirely independent predictors of learning performance. According to this model, intelligence and metacognition are not correlated. The third model, labeled the mixed model, assumes that intel-ligence and metacognition are somehow correlated, but they maintain their own unique contribution to the pre-diction of learning performance (Veenman, Elshout, & Meijer, 1997; Veenman, Kok, & Blöt, 2005). Veenman and Verheij (2003), Veenman et al. (2005), and Van der Stel and Veenman (2008) recognize that there is evi-dence in favor of these three models, but their studies have shown that metacognitive skills are as important as, or more general than intelligence to explain academic achievement and learning outcomes, and that intelligence and metacognition are correlated, which would support the third model.
These studies briefly presented above bring a new perspective that metacognition might be as important as intelligence or even more important than it in the prediction of learning outcomes and academic achievement. In spite of that, the evidence produced by Veenman and his colleagues has some limitations. Whereas the metacognition scores are assigned by judges rather than by standardized tests, it might occur that a considerable part of the variance which is supposed to be related to metacognition be also associated to cognition, or in other words, to intelligence. This imbricate relationship between cognition and metacognition makes it difficult to distinguish one from another, although this is a very important distinction to be made. A methodological approach able to differentiate these constructs would involve analytical tools that could tell us what proportion of the variance can be accounted for cognition and which part for metacognition. Therefore, a priori strategies to produce scores of metacognition by judges could be turned into a posteriori strategies, as a confirmatory step after the scores have been produced from metacognitive tests. A second challenge in these studies lies on the need to both increase the required sample size, in order to produce fewer extreme values in the confidence interval of the correlation between intelligence and metacognition, and decrease the confidence interval of its explanatory power in the prediction of academic achievement.
The current paper aims to bring evidence on the incremental validity of metacognition over intelligence, by creating and using tests’ scores of metacognition instead of judges’ evaluation and also using a large sample, that can reduce the size of the confidence interval estimation. It is believed that only intelligence is really im-portant to explain academic achievement. However, there are good reasons to study psychological variables other than intelligence in order to better explain and comprehend academic achievement. Spinath, Spinath, Harlaar and Plomin (2006) introduced some reasons to investigate the predictive role of other psychological constructs, and not only intelligence, on learning and academic achievement. First of all, intelligence explains around 25% - 50% of the variance in academic achievement, which means that the other 50% - 75% remains unexplained. Secondly, metacognition, like other psychological variables, is susceptible to educational interven-tion. Hence, finding any incremental predictive role of these variables onacademic achievement is relevant to educational programs.
1.2. Modeling the Question of the Study
With the purpose of improve the evidence about the incremental validity of metacognition, and considering not only intelligence on the prediction of academic achievement, we designed this study including some innovations: 1) Two metacognitive tests were created in order to prevent that judges produced the raw scores, 2) The cogni-tive and metacognitive components were distinguished through statistical methods of structural equation modelling, 3) The sample size was large enough to shorten the extreme values of the confidence interval (90% c.i.), and 4) Both general and specific metacognitive variables were included in the study. This was based on the motivational research field, which has provided evidence on the relationship between the hierarchical order of psychological traits and the hierarchical order of academic achievement (Freudenthaler, Spinath, & Neubauer 2008; Spinath, Spinath, & Plomin, 2008; Steinmayr & Spinath, 2009). The Expectancy-Value Theory shows that specific motivational traits are more accurate to explain specific academic achievement than broad motivational ones (Guay, Marsh, & Boivin 2003; Wigfield & Eccles, 1992, 2000). Conversely, the Self-Determination Theory emphasizes that general motivational traits explain better general academic achievements than specific motivational traits (Brockelman, 2009;
Guay, Ratelle, Roy, & Litalien, 2010)
In addition to the question of the incremental validity of metacognition, this study investigates whether general and specific metacognitive abilities have different roles in the prediction of specific and general academic achievement. Therefore, four hypotheses were elaborated based on previous results obtained fromthe motivational research field, as it follows:1) General metacognitive ability (GMA) explains general academic achievement (GAA) rather thanintelli-gence (incremental validity).
2) General metacognitive ability (GMA) does not explain, or even weakly explains, specific academic achievement (SAA).
3) Specific metacognitive ability (SMA) explains specific academic achievement rather thanintelligence (in-cremental validity).
4) Specific metacognitive ability (SMA) does not explain, or even weakly explains, general academic achievement.
To investigate these hypotheses we proposed a model to be investigated through structural equation modeling (Figure 1).
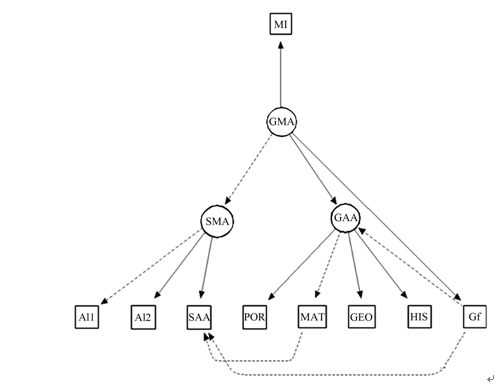
Specific Academic Achievement (SAA) is measured by one indicator of arithmetic ability; Intelligence is measured byone indicator of fluid intelligence (Gf); Specific Metacognitive Ability (SMA) is measured by two indicators (Appraisal Indicator 1—AI1 and Appraisal Indicator 2—AI2, see Figure 1); Reading Monitoring is measured through the Monitoring Indicator (MI); 5) General Metacognitive Ability (GMA) is measured by the Monitoring Indicator and by the Specific Metacognitive Ability; 6) General Academic Achievement (GAA) is measured by Math, Brazilian Portuguese, Geography, and History annual grades. Concerning the relations among the latent variables and some manifest variables: a) General Metacognitive Ability and Gf explain Gen-eral Academic Achievement, and b) Specific Metacognitive Ability, Gf and Math Achievement explain Specific Academic Achievement. For further explanation of these measures, see the section measures and procedures.
2. Method
2.1. Participants
The sample is composed of 684 students (6th to 12th graders) of a private school in Belo Horizonte, Minas Ge-rais, Brazil. The data were collected in 2008. Psychologists or trained undergraduate psychology students admi-nistrated the tests collectively in 19 classes. The sample was relatively balanced in terms of graders (6th grade, N= 91; 7th grade, N = 107; 8th grade, N = 98; 9th grade, N = 116; 10th grade, N = 90; 11th grade, N = 93; 12th grade, N = 89), sex (N = 328 to male and N = 356 to female) and age (11 years old, N = 83; 12 years old, N = 106; 13 years old, N = 92; 14 years old, N = 108; 15 years old, N = 98; 16 years old, N = 80; 17 years old, N = 73) with exception of 10 years old (N = 35) and 18 years old (N = 9).
2.2. Measures and Procedures
2.2.1. Metacognitive Tests
1) Reading Monitoring Test (RMT). This test composes the broad metacognitive indicator in Figure 1 (GMA). It is one-page long text and contains nine conflicting pieces of information. The instruction requires from the respondent to read the text carefully and introduces two examples of contradictory statements, which were per-ceived by one fictitious respondent in terms of the reading processes he or she employed. Furthermore, the in-struction requires respondents to write in a separate part of the test what processes they are using to read the text, either highlighting or numbering parts of the text where they could identify any strategy, challenge, and process involved in the reading process. It was expected that those participants who adequately monitor their reading processes were able to find the errors (contradictory information) in the text and produce verbal statements on them. The errors were categorized into easy, medium and difficulty. Each item has a contradictory information in the text and it has two possible scores: passed (1) if the respondent identifies the error, or failed (0) if they are not able to identify it. The test has 9 items and a time limit of 40 minutes.
The test design is closely related to the error detection paradigm, which was introduced by Markman (1977, 1979) through the use of elaborated texts with selected errors that should be identified by the readers. However, there are some problems in the tasks used by this paradigm as readers may fail to detect errors because they presuppose that all texts are complete and without inconsistencies, and if there are some inconsistencies it will be explained latter in the text. Moreover, readers can lack the adequate vocabulary or previous knowledge re-quired to understand the text and its inconsistencies (McCormick, 2003). To prevent these problems the first part of the RMT is composed by instructions that show some possible errors in a text and how readers can get a broader understanding of the “rules of the game” by responding adequately to the test demands. The text of the test was carefully elaborated so as not to present difficult vocabulary words or to demand significant prior knowledge that might increase the difficulty of error detection. The instructions of the test are shown below.
Instructions:
This is a test about your ability to reflect on your own actions when you are performing them. This ability is used to evaluate different tasks. Here are some examples:
1) A soccer player pays attention to the way he is kicking the ball in order to score.
2) A student carefully compares the statement of the item with a given graph for the same mathematical question.
In this test, you will be introduced to several statements based on a written part and a map. Read all these elements carefully.
You must be aware of your own actions of understanding the text (written part + map). As to any important action that you make to understand the text, underline the excerpt where it occurred, write down a number on the side of it, and after the placeholder text, justify your marking.
Examples:
Mary is a friend of John. John does not like Mary1)
Mary was born in Belo Horizonte and never left her hometown. Mary met John in Rio de Janeiro2).
Placeholder field to describe your action of understanding the text:

2) Appraisals Ability on Mathematics Expressions (AAME). The test has 18 items, each one composed of an arithmetic expression, such as: 20 − (8 + 9) + (5 + 4 + 7) − 6. After solving the item, the respondents must evaluate their probability of success and answer in a four point scale if they are: a) sure of having failed the item; b) not sure, but think they have failed the item; c) not sure, but think they have passed the item; d) sure of having succeed in the item. Items were categorized into easy, medium and difficult. In the proposed model, the test is represented by two specific metacognitive indicators: Appraisal Indicator 1 (AI1) is composed by the easier items and Appraisal Indicator 2 (AI2) by the most difficult ones.
Students who are certain that failed an item are scored 0. Those who were sure that succeed in an item, but failed it, were scored 1. Students who were not sure, but thought that failed an item and in fact succeed in it, were scored 2, as well as those who were not sure, but thought that succeed in an item and actually did not. Those who were not sure, but thought that succeed in an item and in fact did it, and those who were not sure, but thought that failed an item and failed it indeed, were scored 3. Students that were sure of succeed in an item and in fact did it were scored 4. Hence, the attributable scores are 0, 1, 2, 3 and 4, for each of the 18 items. This test has a 30-minute time limit.
The choice of attributing score 0 to those who were sure of having failed an item comes from the interpretation that students should be minimally able to solve the item in order to perform the evaluative process. If an item seems hard to be answered correctly, given its difficulty level, then it is not possible to say that the metacognitive evaluative process could be activated in its plenitude. This strategy can be also justified by the avoidance of measuring other construct than self-appraisal, like the feeling-of-not-knowing—FOnK (Glucksberg & McCloskey, 1981; Klin, Guzman, & Levine, 1997) or the feeling-of-knowing—FOK (Hart, 1965; Koriat, 1993, 1995; Nelson, Gerler, & Narens, 1984). Respondents may be sure that failed an item just because they realize that do not know how to perform the item. So, if respondents score 4, this will be evaluating their ability to judge what they know, rather than how good they performed the item. FOK and FOnK concern a sense of judgment about learning, which means that someone makes a judgment even when he or she does not know the target object. This process is also expected to happen even if the person is not able to recall the information from memory (Hart, 1965). FOK and FOnK are different from, as well as prior than, the judgment of performance, in which someone has to evaluate whether a result is correct or wrong (Winne & Nesbit, 2010).
The psychometric properties of both tests, Reading Monitoring Test and Appraisals Ability on Mathematics Expressions, are described in Golino and Gomes (2011). Briefly, the Reading Monitoring Test has a reliability of 0.63, while the Appraisals Ability on Mathematics Expressions presents a reliability of 0.86 (Cronbach’s alpha). The moderate reliability of the Reading Monitoring test may be due to the number of items (only nine), i.e. the amount of conflicting pieces of information presented in the text. The authors provide evidence supporting a three latent variables structure (χ2 = 561.77; df = 139; CFI = 0.92; RMSEA = 0.07). One latent variable loads on the RMT items, while the other two latent variables load on the Appraisals Ability on Mathematics Expressions’s easy (Appraisal Indicator 1) and difficult items (Appraisal Indicator 2). All the items loaded ≥0.35 in the confirmatory factor analysis.
2.2.2. Specific Academic Achievement
The Arithmetic Expressions Test (AET). It measures the specific academic achievement (SAA) in arithmetic expressions. The 18 items are composed of 18 arithmetic expressions. The items were scored 1 (pass) and 0 (fail). The one factor model CFA fits the data (χ2 = 280.98, df = 71, CFI = 0.93, RMSEA = 0.07). Excepting item 1 (0.18) and item 2 (0.29), all the other items had loadings higher than 0.55. We employed all the 18 items in the present study. The Cronbach’s alpha was .88. The factor scores obtained from the CFA were used in the data analysis as the SAA indicators.
2.2.3. Fluid Intelligence Tests Kit (CTIF)
In order to measure Gf, 27 items of the CTIF (Gomes & Borges, 2009) were used, being eight items of the Inductive Reasoning Test (I), 11 items of the Logical Reasoning Test (RL), and 8 items of the General Reasoning Test (RG). The items used in the present study are a reduced version of the CTIF, and they are scored according to their degrees of difficulty (easy, medium and difficult). The reduced version was used to fit the school logistical demands. Evidence showed that Fluid Intelligence Tests Kit, in Brazilian samples of middle and high school students, presented convergent and divergent validity, as well as an adequate reliability, in terms of Cronbach’s alpha (higher than 0.70, Gomes & Borges, 2009). I, RL and RG tests were chosen as they are three of the best Gf markers (Carroll, 1993). More details on these tests are shown as follows:
1) Inductive Reasoning Test (I). For this test, eight items were selected; each one composed by five sets of four letters, with four sets following the same rule and one set following a different one, which was the alternative supposed to be chosen by the participants. Participants are expected to identify the set of letters that have a different coordination rule, and mark it with an X, in a time limit of 8 minutes (Figure 2).
2) Logical Reasoning Test (RL). Eleven items were selected, each one formed by one conclusion from two abstract premises. The respondent must indicate whether the conclusion is logically adequate or not (Figure 3).
3) General Reasoning Test (RG). Eight items were selected. Each one has a statement, where a math problem is introduced. Students are meantto interpret this statement, solve the problem and choose one of the five multiple-choice answer options, in 12 minutes (Figure 4).
Gomes and Golino (2012) showed that the reduced version of the CTIF, with the 27 items used in the present study, has an adequate reliability (α = 0.75). The confirmatory factor analysis using the MPLUS 5.2 showed that unidimensional model (χ2 = 233.56, df = 134, CFI = 0.90, RMSEA = 0.03) of the fluid intelligence wasthe best fit. Only 8 out of the 27 initial itemsdid not show loadings greater than 0.40: RL1 (l = 0.34), RL4 (l = 0.27), RL5 (l = 0.39), RL9 (l = 0.05), RL10 (l = 0.23), RL11 (l = 0.39), RG1 (l = 0.29) and RG7 (l = 0.35).
2.3. Data Analysis
Factor scores of fluid intelligence, appraisal indicator 1, appraisal indicator 2, monitoringindicator, and specific academic achievement were used instead of summed scores. In short, factor scores are composite measures

Figure 2. Inductive reasoning test’s item 1.

Figure 3. Example of the logical reasoning test.

Figure 4. Example of the logical reasoning test.
created for each observation (case) on each factor extracted in the factor analysis, providing information about an individual’s location on the factor(s) (DiStefano, Zhu, & Mîndrilã, 2009). The preference for factor scores is because they take into account only the true score and eliminate both the error and specific variance. Instead, summed score is a measure of the true score along with specific variance and error. The Gf, Monitoring Indicator, Appraisal Indicator 1, Appraisal Indicator 2, Specific Academic Achievement’s factor scores, and the Math, Portuguese, History, and Geography grades were standardized with mean 100 and standard deviation 10, in each group of grades. This procedure allows us to analyze all students’ grades and factor scores in the same data matrix. Structural Equation Modelling (SEM) was applied to investigate the relationship between the variables, as established in the hypotheses of the study. The model-data fit was verified by the comparative fit index (CFI) and the root mean square error of approximation (RMSEA). CFI ≥ 0.95 and RMSEA ≤ 0.06 indicate good modeldata fit (Byrne, 2001). SEM was performed through the software Amos 18.0. All of the figures presented in the current paper were created using the R semPlot package (Epskamp, 2013).
3. Results
3.1. Descriptive
As we have only the annual school grades from the year of the data collection, we could only analyze individual differences and not the patterns of growth from grade to grade. Thus, results presented in this paper restrictedly concern the participants’ variation in a unique developmental period (performance at the end of one school year).
The standardized factor scores and the standardized students’ scores in Math, Portuguese, Geography and History were almost normally distributed. The kurtosis value of this multivariate data, 12.21, is higher than the critical ratio, 11.35, but the difference is small, indicating that the data can be analyzed by SEM using a maximum likelihood estimation (Blunch, 2008). Measures of Dispersion for each variable can be visualized in Table1
Table 2 presents the mean and standard deviation of the tests’ summed scores grouped by student’s grades. These tests’ summed scores were not standardized from the student’s grades. The Arithmetic Expression’s Test (AET) has a possible minimal score of 0 and a maximum of 18. The minimal and maximal possible scores of the Reading Monitoring Test (RMT) are 0 and 9, respectively. Minimal and maximal possible scores of Appraisal Ability in Mathematical Expressions (AAME) are 0 and 72, respectively. Minimal and maximal possible scores
Table 1 . Minimum, maximum, skew, critical ratio and kurtosis for each variable used.
Note: Fluid Intelligence (Gf), Mathematics (MATH), Monitoring Indicator (MI), Appraisal Indicator 1 (AI1), Appraisal Indicator 2 (AI2), Specific Academic Achievement (SAA), History (HIST), Geography (GEO), Portuguese (PORT).
Table 2. Mean and standard deviation for each test, from grade 6th to 12th.
Note: The Arithmetic Expressions Test (AET), Reading Monitoring Test (RMT), Appraisals Ability on Mathematics Expressions (AAME), Fluid Intelligence Tests Kit (CTIF).
of the Fluid Intelligence Tests Kit (CTIF) are 0 and 27, respectively. The participants’ performance showed no ceiling effects. As can be seen from Table 2, the mean generally increases as the grades progress, except in the cases of AAME, between seventh and eighth grades, and of CTIF, between ninth and tenth grade.
3.2. Structural Equation Modelling
The model has two main components. While the first component deals with the measure, the second one captures the relationship between the latent variables. For the first component 1) Specific Academic Ability (SAA) is measured by one indicator of arithmetic ability, 2) Intelligence is measured by one indicator of fluid intelligence (Gf), 3) Specific Metacognitive Ability (SMA) is measured by two indicators (AI1 and AI2, see Figure 1), 4) Reading Monitoring is measured by the Monitoring Indicator (MI), 5) General Metacognitive Ability (GMA) is measured by the MI indicator and by the SMA; and 6) General academic achievement (GAA) is measured by Math, Brazilian Portuguese, Geography, and History annual grades.
Concerning the relationship among the latent variables: 1) General Metacognitive Ability and Gf explain General Academic Achievement, while 2) Specific Metacognitive Ability, Gf and Math achievement explain Specific Academic Achievement. It is worth noting that instead of being represented by a square in the model (see Figure 1 and Figure 5), Gf is thought to be a latent variable, since we are employing the factor score of
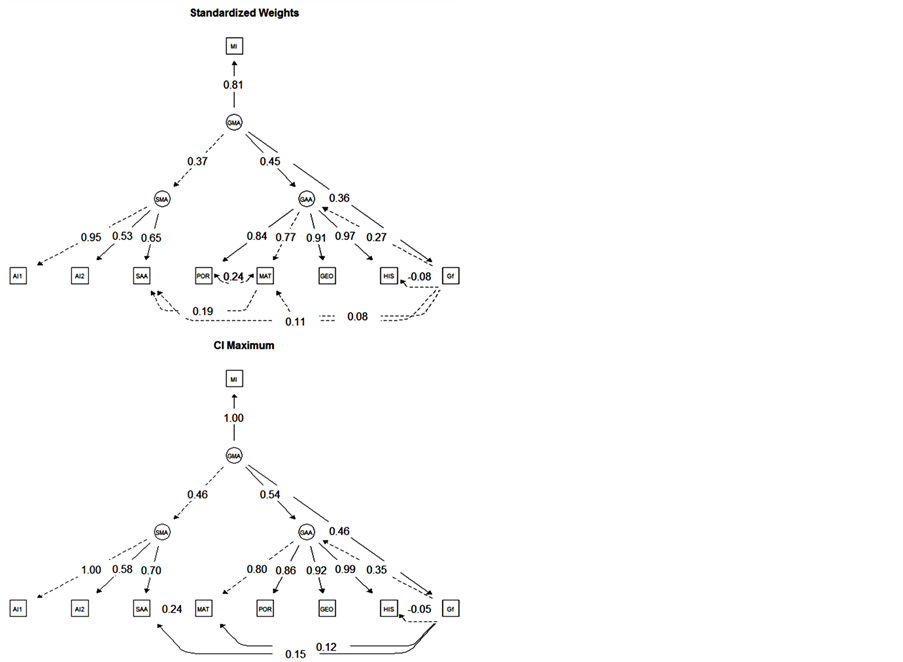
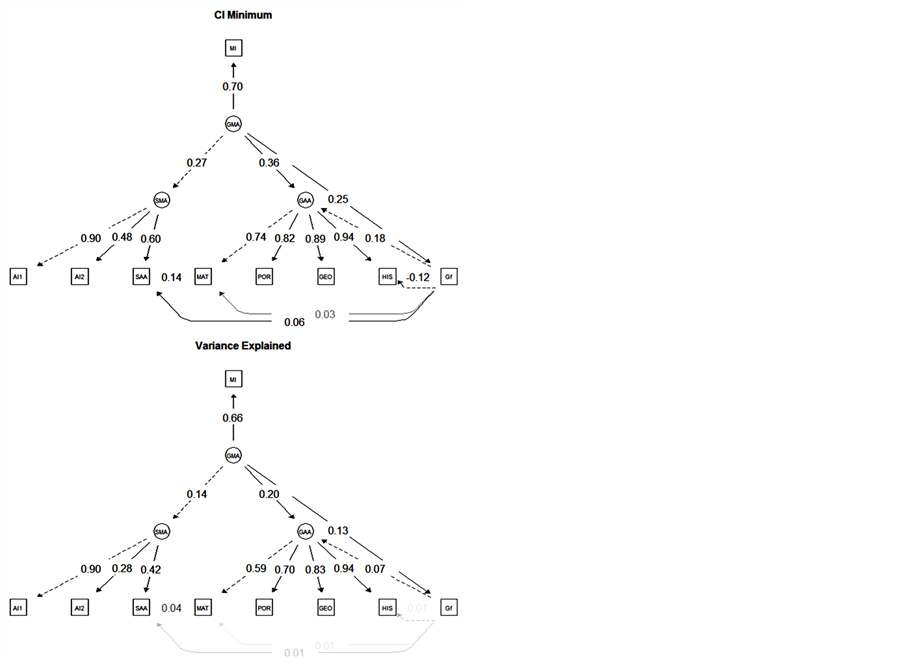
Figure 5. The model standardized weights, its confidence interval and the variance explained.
each individual in the CTIF. Although the proposed model (Figure 1) had been fitted to the data (χ2 = 103.31, df = 22, CFI = 0.98, RMSEA = 0.07), some relations were added between variables based on the modification indices, such as a covariance between Math and Portuguese, and a regression weight from Gf to Math and History. The resulting model (Figure 5, “Standardized Weights”) improved substantially the goodness-of-fit (χ2 = 51.18; df = 19; CFI = 1.00; RMSEA = 0.05). Those relations were added as an exploratory strategy, available from the modification indices, which allowed the verification of which relations between model’s variables, if added, would improve the model data fit (Blunch, 2008; Byrne, 2001).
The following exogenous and endogenous variables are presented in the model. Mathematics (MATH), Portuguese (PORT), Geography (GEO), History (HIST), Specific Academic Ability (SAA), Fluid intelligence (Gf), Appraisal Indicator 1 (AI1), Appraisal Indicator two (AI2) and Monitoring Indicator (MI) are the endogenous observable variables. General Academic Ability (GAA) and Specific Metacognitive Ability (SMA) are the endogenous unobservable variable. Variable errors and General Metacognitive Ability (GMA) are exogenous unobservable variables. The relationships between variables, standardized direct effects and correlations in the model are represented in Figure 5. Regressions weights that do not show significant loadings are omitted.
Aiming to estimate the confidence interval (CI) of the regression weights and the standardized direct effects, we performed a bootstrap of 1000 cases with 90% confidence interval (Monte Carlo method). The results are synthesized in Figure 5, showing the values rounded to the next centesimal number (format 0.00), so that a slight difference may be found between the figure labels and the values described. Furthermore, the labels of the “Variance Explained” structure in Figure 5 represent the square of the standardized weights. Figure 5 show that Gf and General Metacognitive Ability explain General Academic Achievement variance. The former explains 7.45% (from 3.31% to 12.46%, p = 0.002), whereas the latter explains 20.43% (from 12.60% to 29.38%, p = 0.002). General Metacognitive Ability also explains 66.10% of the Monitoring Indicator (from 49% to 99.06%, p = 0.002), 13.69% of Specific Metacognitive Ability (from 7.29% to 21.16%, p = 0.002), and 12.85% of Gf variance (from 6.05% to 21.25%, p = 0.002). Fluid intelligence (Gf) explains 1.12% of Specific Academic Achievement (from 0.32% to 2.34%, p = 0.002), 0.59% of Math (from 0.12% to 1.44%, p = 0.006), and 0.67% of History (from 0.21% to 1.44%, p = 0.002). The Specific Metacognitive Ability trait explains 90.25% of the Appraisal Indicator 1 (from 81.36% to 100%, p = 0.002), 28.09% of the Appraisal Indicator 2 (from 22.66% to 33.64%, p = 0.002) and 42.12% of Specific Academic Achievement (from 36% to 48.44%, p = 0.002). Specific Academic Achievement has also its variance explained by 3.72% of Math’s standardized grade (from 1.99% to 5.86%, p = 0.002).
The students’ performance in Mathematics (MATH), History (HIST), Geography (GEO) and Portuguese (PORT) are mostly explained by the General Academic Achievement trait (54.02% - 64.48%, 89.11% - 98.41%, 79.92% - 85.19% and 67.24% - 74.30%, respectively).
The results make way for at least two peculiarities. Firstly, the relationships found between the variables Gf and Specific Academic Achievement, as well as between Gf and Math can be thought of as an effect of the RG’s items, once they are statements containing math problems, which is a similar domain presented in the Specific Academic Achievement and Math performance. Secondly, there were some RL and RG items with low factor loadings, which could make the fluid intelligence indicator vulnerable. In order to verify both situations, a new analysis was performed, creating a reduced Gf indicator, in which the items of RL and RG with loadings equal or greater than .40 were excluded. It was also generated a new Specific Academic Achievement indicator, by eliminating items 1 and 2, since they loaded weakly on the Specific Academic Achievement factor. Both new indicators presented an adequate goodness-of-fit. The reduced Gf showed CFI = 0.93 and RMSEA = 0.05, α = 0.69, and loadings varying from 0.36 to 0.80, while the reduced Specific Academic Achievement presented CFI = 0.92 and RMSEA = 0.08, α = 0.84, and loadings varying between 0.56 and 0.85. Therefore, a new model was performed, with the same variables and relations, except by the elimination of the old Gf and Specific Academic Achievement indicators and its replacement by its new reduced version. This new model presented a good data fit (CFI = 1.00, RMSEA = 0.03). Figure 6 represents only the differences between Gf’s estimates and its relationships in the old and new model.
The new result shows no differences between Gf and Specific Academic Achievement, Gf and Math, and Gf and History. The old and the new model values are within the confidence interval. The only difference concerns the General Academic Achievement, since it is better explained by Gf in the old model. This new findings show that when all the Gf items whose domain is related with Math were removed, there was no decrease in the magnitude of the relationship between Gf and Math or Gf and Specific Academic Achievement. Conversely, in the presence of the Gf reduced indicator, its relation with general academic achievement decreases, which is not exclusively a Math domain, but a latent variable composed by the grades in different school subjects. In short, this result presents good evidence that the items of the General Reasoning Test are good fluid intelligence markers, as supposed in the Methods section.
4. Discussion
The current study addresses two research questions: 1) Does a General Metacognitive Ability explain General Academic Achievement other than intelligence, and 2) does a Specific Metacognitive Ability explain Specific Academic Achievement, other than intelligence and specific knowledge (mathematics achievement)? The result shows that the General Academic Ability variance can be explained by the General Metacognitive Ability and by the Fluid Intelligence. In the best of the scenarios the General Metacognitive Ability can explain General Academic Achievement approximately nine times more than Gf. Moreover, a Specific Metacognitive Ability explains Specific Academic Achievement rather than intelligence (at worst in 15:1) and specific knowledge (at worst in 18:1).
These results lead to three main consequences. Firstly, it provides evidence contrary to the assumption that intelligence is the major predictor of academic achievement (Brody, 1997; Ceci, 1991; Colom & Flores-Mendoza, 2007; Deary et al., 2007; Gustafsson & Undheim, 1996; Naglieri & Bornstein, 2003; Neisser et al., 1996; Watkins et al., 2007), and goes against the belief that is even unnecessary the presence of other variables to predict human performance other than intelligence, once intelligence would tend to incorporate all the variance (Gottfredson, 2002a; 2002b; Kuncel, Hezlett, & Ones, 2004). As pointed out by Spinath et al. (2006), one of the good reasons to investigate psychological variables, such as metacognition, and not only intelligence, is the possibility of improving the knowledge about the predictors of academic achievement, since a considerable part of the variance remains unexplained. Our findings show that Fluid Intelligence has a moderated impact on General Academic Achievement and weak impact on Specific Academic Achievement.

Figure 6. Old and reduced Gf estimates.
An important question yet to be explored is why the impact of intelligence on academic achievement is relatively low, whereas many other studies highlight that this is the construct which plays the main role in the prediction of academic achievement (Brody, 1997; Ceci, 1991; Colom & Flores-Mendoza, 2007; Naglieri & Bornstein, 2003). One feasible explanation can be found in the model proposed in this study. When a metacognition trait is placed concurrently with Gf, it extracts considerably the intelligence’s variance, decreasing the strength of the Gf-General Academic Achievement and Gf-Specific Academic Achievement relationship. So, this paper holds the assumption that metacognition is as important as, or more important than intelligence to explain academic achievement, in accordance with the metacognitive literature regarding academic achievement and learning outcomes (Van der Stel & Veenman, 2008; Veenman & Verheij, 2003; Veenman et al., 2005).
Secondly, the findings of this work point to a direction neither supporting that metacognition is strictly domain-general (Schraw & Neitfeld, 1998; Van der Stel & Veenman, 2008; Veenman & Verhiej, 2003; Veenman et al., 1997), nor considering it as strictly domain specific (Desoete & Roeyers, 2002; Glaser et al., 1992; Kelemen et al., 2000). Theresults suggest that metacognition can be eitherdomain-general ordomain-specific, or both. The metacognitive architecture seems to work in accordance with the Carroll’s (1993) cognitive architecture, having different strata, from general to specialized level. Carroll conducted a meta-analysis of the psychometric studies of intelligence published until the 1980s. He found a hierarchical structure of three levels: the first one consisting of dozens of factors or specific cognitive abilities, closely tied to the context and to specialized processes; the second level composed of eight broad abilities, such as Fluid Intelligence, Crystallized Intelligence and Short-Term Memory, among others, related to more general processes and domains; and the third level consisting of a single General Intelligence Factor. According to Carroll (1993, 1995, 2003), there is no cognitive test explained only by a single intelligence factor. All cognitive tests have their variance explained at least by the General Intelligence Factor, by a second level broader ability and by a first level ability. The Carroll’s model (1993) shows that human performance is influenced by abilities distributed in different hierarchical levels in the architecture of the mind. It is possible to moot that the same could happen with the metacognitive abilities, since one of the current findings of this study show the existence of different levels of metacognition. A more general metacognitive ability either along with a range of broad metacognitive skills, such as metacomprehension and metamemory, or along with a range of specific metacognitive skills, such as the accuracy of the success appraisal in arithmetic expressions, is also justifiable. Together, they would constitute the architecture of the human metacognitive structure.
This proposal can be synthesized in the Figure 7, where in the third stratum is placed the General Metacognitive Ability (GMA), in the second stratum is placed a range of broad metacognitive skills (BMS), and in the first

Figure 7. The hierarchical model of the metacognitive architecture.
stratum is set several specific metacognitive skills (SMS). To verify this speculative hierarchical model of the metacognitive architecture a number of further studies using a broad set of specific metacognitive tasks will be necessary, in order to allow the identification of different metacognitive levels.
The third implication suggests that specialized metacognitive abilities are relevant to explain specific school performance, and general metacognitive abilities play a central role inGeneral School Achievement. This result seems to be relevant to interventions, once it suggests that educational programs aiming to improve specific academic performance would focus on the development of specific metacognitive abilities. On the other hand, educational programs, which seek to improve General Academic Performance, would focus their efforts on the development of general metacognitive abilities. In spite of the number of studies showing that metacognitive intervention improves academic achievement (Bianchi, 2008; Bigozzi, De Bernart, & Del Vecchio, 2007; Blank, 2000; Csíkos & Steklács, 2010; Juliebö, Malicky, & Norman, 1998; Victor, 2005), further studies should investigate the suggestion aforementioned, incorporating general and specific metacognitive abilities in their intervention (or instruction), and relating them to general and specific achievement.
Besides the existence of the three models to explain the relation between intelligence, metacognitionand academic achievement (Veenman & Elshout, 1991; Veenman & Spans, 2005; Veenman et al., 1995, 2005), the results show that none of these are precise or complete to explain the data. In the intelligence model, general cognitive ability should explain school performance by itself (Veenman et al., 1997). However, that is not the case. The independent model, argues that metacognition is not related to intelligence accordingly (Veenman et al., 2005). This is also not assumed in this study, since Gf is directly explained by General Metacognitive Ability, and indirectly by the Monitoring Indicator and the Appraisal Ability on Mathematical Expressions. Furthermore, the mixed model could be the key to interpret the data of the study, whereas it postulates that both intelligence and metacognition explain school performance (Veenman & Spans, 2005). However, this could still be insufficient in explaining the results, as it points to the need of extending the traditional mixed model by adding two points. Usually the mixed and the other two models verify the metacognitive incremental validity using a general intelligence trait.
Modern intelligence models in the psychometrics area recognize that intelligence is much more than General Intelligence (Carroll, 1993; Floyd et al., 2009; McGrew, 2009; McGrew & Wendling, 2010; Newton & McGrew, 2010), being a broad set of abilities distributed in different strata or levels. So, the first proposal is to incorporate tasks and tests that measure abilities in different cognitive strata to investigate the incremental validity of metacognition rather than intelligence. The second proposal involves the incorporation of the aforementioned metacognitive architecture proposition, which defines the metacognitive abilities in a stratum-like organization. This proposal could bring new evidence on the relationship between cognition, metacognition and school achievement, investigating the role of different cognitive and metacognitive strata in the prediction of specific and general academic achievement.
Different limitations of this study can be highlighted. First of all, students from only one school composed the sample. The administration of extensive instruments and items in the sample was unfeasible because it would affect the schedule of the school, since a larger amount of tests to be administered would demand more time. Likewise, the collection of a larger sample seemed to be inconvenient to the school, which restricted a broader data collection. Secondly, the measure of academic achievement took into account exclusively Mathematics, Brazilian Portuguese, History and Geography grades. These four subjects are currently considered by the Brazilian Ministry of Education as representative of the overall academic achievement, regardless subjects like Biological Sciences and Writing. Unfortunately, this situation does not occur exclusively in Brazil, also happening in developed countries, like Germany (Steinmayr & Spinath, 2009). Thirdly, since Fluid Intelligence (Gf) can be regarded as the best predictor of intelligence (Carroll, 1993), this study follows the premise that a Gf indicator is sufficient to test the hypotheses we formulated. So we did not consider other intelligence factors, such as Crystalized Intelligence, Visual-Spatial Ability, Memory, along with others. Future studies could benefit from broadening the number of intelligence factors, seeking to replicate our results in face of a set of different broad cognitive abilities. Finally, metacognitive abilities were assessed only by two perspectives (self-appraisal and selfmonitoring) given that Schraw (1998) considers these are relevant metacognitive components. These limitations have economical and logistical reasons.
Despite these limitations, the incremental validity of psychological variables other than intelligence seems to be a valuable research agenda as it can be regarded as an important way of predicting future students’ academic achievement and learning performance.
5. Conclusion
The findings of this study provide new evidence that a General Metacognitive Ability can explain General Academic Achievement rather than intelligence, and a specific metacognitive ability explains specific academic achievement, rather than intelligence and specific knowledge. On the strength of these results, we could come to a conclusion that: 1) metacognition has incremental validity upon intelligence when predicting school performance, 2) metacognition can be either domain-general (e.g. General Metacognitive Ability) or domain-specific or both (e.g. Specific Metacognitive Ability); and 3) different metacognitive abilities, in distinct strata, can explain different school performances.
The current study is based upon some theoretical and methodological issues concerning the metacognitive research field: the necessity to distinguish cognitive components from metacognitive ones and using objective items, as well as to employ larger sample sizes. Moreover, this study suggests the development of a future research agenda concerned with: 1) the construction of a large set of metacognitive skills tests; 2) the selection of a large set of cognitive tests to assess both specific and broad abilities rather than the general cognitive ability; 3) the investigation of whether metacognitive abilities have incremental validity rather than specific, broad and general cognitive abilities; and 4) the examination of whether specific metacognitive and cognitive traits explain specific academic performances, as well as whether broad metacognitive and cognitive traits explain broad academic achievement.
Acknowledgements
The current research was financially supported by a grant provided by the Fundação de Amparo à Pesquisa de Minas Gerais (FAPEMIG) to the first two authors.
References
Bianchi, G. A. (2008). Effects of Metacognitive Instruction on the Academic Achievement of Students in the Secondary Sciences (Doctoral Dissertation). Available from ProQuest Dissertations & Theses Database (UMI No. 3272507).
Bigozzi, L., de Bernart, D., & Del Vecchio, P. (2007). Apprendimento e metacognizione: Gli effetti di un training di potenziamento nel primo ciclo di scuola primaria. Psicologiadell’educazione, 1, 371-384.
Blank, L. M. (2000). A Metacognitive Learning Cycle: A Better Warranty for Student Understanding? Science Education, 84, 486-506. http://dx.doi.org/10.1002/1098-237X(200007)84:4<486::AID-SCE4>3.0.CO;2-U
Blunch, N. J. (2008). Introduction to Structural Equation Modelling Using SPSS and AMOS. Califórnia: SAGE Publications.
Brockelman, K. (2009). The Interrelationship of Self-Determination, Mental Illness, and Grades among University Students. Journal of College Student Development, 50, 271-286. http://dx.doi.org/10.1353/csd.0.0068
Brody, N. (1997). Intelligence, Schooling, and Society. American Psychologist, 52, 1046-1050. http://dx.doi.org/10.1037/0003-066X.52.10.1046
Byrne, B. M. (2001). Structural Equation Modeling with AMOS: Basic Concepts, Applications, and Programming. Mahwah: Lawrence Erlbaum Associates.
Carroll, J. B. (1993). Human Cognitive Abilities: A Survey of Factor-Analytical Studies. New York: Cambridge University Press. http://dx.doi.org/10.1017/CBO9780511571312
Carroll, J. B. (1995). On Methodology in the Study of Cognitive Abilities. Multivariate Behavioral Research, 30, 429-452. http://dx.doi.org/10.1207/s15327906mbr3003_6
Carroll, J. B. (2003). The Higher-Stratum Structure of Cognitive Abilities: Current Evidence Supports g and about Ten Broad Factors. In H. Nyborg (Ed.), The Scientific Study of General Intelligence: Tribute to Arthur R. Jensen (pp. 1-20). Oxford: Elsevier Science/Pergamon Press. http://dx.doi.org/10.1016/B978-008043793-4/50036-2
Ceci, S. (1991). How Much Does Schooling Influence General Intelligence and Its Cognitive Components? A Reassessment of the Evidence. Developmental Psychology, 27, 703-722. http://dx.doi.org/10.1037/0012-1649.27.5.703
Colom, R., & Flores-Mendoza, C. (2007). Intelligence Predicts Scholastic Achievement Irrespective of SES Factors: Evidence from Brazil. Intelligence, 35, 243-251. http://dx.doi.org/10.1016/j.intell.2006.07.008
Csíkos, C., & Steklács, J. (2010). Metacognition-Based Reading Intervention Programs among Fourth-Grade Hungarian Students. In A. Efklides, & P. Misailidi (Eds.), Trends and Prospects in Metacognition Research (pp. 345-366). New York: Springer Science + Business Media.
Deary, I. J., Strand, S., AIth, P., & Fernandes, C. (2007). Intelligence and Educational Achievement. Intelligence, 35, 13-21. http://dx.doi.org/10.1016/j.intell.2006.02.001
Desoete, A., & Roeyers, H. (2002). Off-Line Metacognition: A Domain-Specific Retardation in Young Children with Learning Disabilities? Learning Disability Quarterly, 25, 123-139. http://dx.doi.org/10.2307/1511279
DiStefano, C., Zhu, M., & Mîndrilã , D. (2009). Understanding and Using Factor Scores: Considerations for the Applied Researcher. Practical Assessment, Research & Evaluation, 14, 1-11.
Embretson, S., & Reise, S. P. (2000). Item Response Theory for Psychologists. New Jersey: Lawrence Erlbaum Associates, Inc., Publishers.
Epskamp (2013). semPlot: Path Diagrams and Visual Analysis of Various SEM Packages’ Output. R Package Version 0.3.3. http://CRAN.R-project.org/package=sem
Floyd, R. G., McGrew, K. S., Barry, A., Rafael, F., & Rogers, J. (2009). General and Specific Effects on CattellHorn-Carroll Broad Ability Composites: Analysis of the Woodcock-Johnson III Normative Update Cattell-Horn-Carroll Factor Clusters across Development. School Psychology Review, 38, 249-265.
Freudenthaler, H., Spinath, B., & Neubauer, A. (2008). Predicting School Achievement in Boys and Girls. European Journal of Personality, 22, 231-245. http://dx.doi.org/10.1002/per.678
Gagné, F., & St Père, F. (2002). When IQ Is Controlled, Does Motivation still Predict Achievement? Intelligence, 30, 71-100. http://dx.doi.org/10.1016/S0160-2896(01)00068-X
Glaser, R., Schauble, L., Raghavan, K., & Zeitz, C. (1992). Scientific Reasoning across Different Domains. In E. De Corte, M. C. Linn, H. Mandl, & L. Verschaffel (Eds.), Computer-Based Learning Environments and Problem Solving (pp. 345-371). Berlin: Springer-Verlag. http://dx.doi.org/10.1007/978-3-642-77228-3_16
Glucksberg, S., & McCloskey, M. (1981). Decisions about Ignorance: Knowing that You Don’t Know. Journal of Experimental Psychology: Human Learning and Memory, 7, 311-325. http://dx.doi.org/10.1037/0278-7393.7.5.311
Golino, H. F., & Gomes, C. M. A. (2011). Preliminary Internal Validity Evidences of Two Brazilian Metacognitive Tests. Testing International, 26, 11-12.
Gomes, C. M. A., & Borges, O. N. (2009). Qualidades Psicométricas do Conjunto de Testes de Inteligência Fluida. Avaliação Psicológica, 8, 17-32.
Gomes, C. M. A., & Golino, H. F. (2012). O que a inteligência prediz: Diferenças individuais ou diferenças no desenvolvimento acadêmico? Psicologia: Teoria e Prática (Online), 14, 126-139.
Gottfredson, L. S. (2002a). g: Highly General and Highly Practical. In R. J. Sternberg, & E. L. Grigorenko (Eds.), The General Factor of Intelligence: How General Is It? (pp. 331-380). Mahwah, NJ: Erlbaum.
Gottfredson, L. S. (2002b). Where and Why g Matters: Not a Mystery. Human Performance, 15, 25-46.
Guay, F., Marsh, H., & Boivin, M. (2003). Academic Self-Concept and Academic Achievement: Developmental Perspectives on Their Causal Ordering. Journal of Educational Psychology, 95, 124-136. http://dx.doi.org/10.1037/0022-0663.95.1.124
Guay, F., Ratelle, C., Roy, A., & Litalien, D. (2010). Academic Self-Concept, Autonomous Academic Motivation, and Academic Achievement: Mediating and Additive Effects. Learning and Individual Differences, 20, 644-653. http://dx.doi.org/10.1016/j.lindif.2010.08.001
Gustafsson, J., & Undheim, J. (1996). Individual Differences in Cognitive Functions. In Handbook of Educational Psychology (pp. 186-242). New York: Macmillan Library Reference USA.
Hart, J. T. (1965). Memory and the Feeling-of-Knowing Experience. Journal of Educational Psychology, 56, 208-216. http://dx.doi.org/10.1037/h0022263
Juliebö, M. F., Malicky, G. V., & Norman, C. (1998). Metacognition of Young Readers in an Early Intervention Programme. Journal of Research in Reading, 21, 24-35. http://dx.doi.org/10.1111/1467-9817.00040
Kelemen, W. L., Frost, P. J., & Weaver, C. A. I. (2000). Individual Differences in Metacognition: Evidence against a General Metacognitive Ability. Memory & Cognition, 28, 92-107. http://dx.doi.org/10.3758/BF03211579
Klin, C. M., Guzman, A. E., & Levine, W. H. (1997). Knowing that You Don’t Know: Metamemory and Discourse Processing. Journal of Experimental Psychology: Learning, Memory, and Cognition, 23, 1378-1393. http://dx.doi.org/10.1037/0278-7393.23.6.1378
Koriat, A. (1993). How Do We Know What We Know? The Accessibility Model of the Feeling of Knowing. Psychological Review, 100, 609-637. http://dx.doi.org/10.1037/0033-295X.100.4.609
Koriat, A. (1995). Dissociating Knowing and the Feeling of Knowing: Further Evidence for the Accessibility Model. Journal of Experimental Psychology: General, 124, 311-333. http://dx.doi.org/10.1037/0096-3445.124.3.311
Kuncel, N. R., Hezlett, S. A., & Ones, D. S. (2004). Academic Performance, Career Potential, Creativity, and Job Performance: Can One Construct Predict Them All? Journal of Personality and Social Psychology, 86, 148-161. http://dx.doi.org/10.1037/0022-3514.86.1.148
Markman, E. M. (1977). Realizing that You Don’t Understand: A Preliminary Investigation. Child Development, 48, 986- 992.
Markman, E. M. (1979). Realizing that You Don’t Understand: Elementary School Children’s Awareness of Inconsistencies. Child Development, 50, 643-655. http://dx.doi.org/10.2307/1128929
McCormick, C. B. (2003). Metacognition and Learning. In I. B. Weiner, D. K. Freedheim, W. M. Reynolds, J. A. Schinka, & G. E. Miller (Eds.), Handbook of Psychology: Educational Psychology (pp. 79-102). New Jersey: John Wiley & Sons. http://dx.doi.org/10.1002/0471264385.wei0705
McGrew, K. S. (2009). CHC Theory and the Human Cognitive Abilities Project: Standing on the Shoulders of the Giants of Psychometric Intelligence Research. Intelligence, 37, 1-10. http://dx.doi.org/10.1016/j.intell.2008.08.004
McGrew, K. S., & Wendling, B. J. (2010). Cattell-Horn-Carroll Cognitive-Achievement Relations: What We Have Learned from the Past 20 Years of Research. Psychology in the Schools, 47, 651-675.
Naglieri, J., & Bornstein, B. (2003). Intelligence and Achievement: Just How Correlated Are They? Journal of Psychoeducational Assessment, 21, 244-260. http://dx.doi.org/10.1177/073428290302100302
Neisser, U., Boodoo, G., Bouchard Jr., T. J., Boykin, A. W., Brody, N., Ceci, S. J., Halpern, D. F., Loehlin, J. C., Perloff, R., Sternberg, R. J., & Urbina, S. (1996). Intelligence: Knowns and Unknowns. American Psychologist, 51, 77-101. http://dx.doi.org/10.1037/0003-066X.51.2.77
Nelson, T. O., Gerler, D., & Narens, L. (1984). Accuracy of Feeling-of-Knowing Judgments for Predicting Perceptual Identification and Relearning. Journal of Experimental Psychology: General, 113, 282-300. http://dx.doi.org/10.1037/0096-3445.113.2.282
Newton, J. H., & McGrew, K. S. (2010). Introduction to the Special Issue: Current Research in Cattell-Horn-Carroll-Based Assessment. Psychology in the Schools, 47, 621-634.
Schraw, G. (1998). Promoting General Metacognitive Awareness. Instructional Science, 26, 113-125. http://dx.doi.org/10.1023/A:1003044231033
Schraw, G., & Nietfeld, J. (1998). A Further Test of the General Monitoring Skill Hypothesis. Journal of Educational Psychology, 90, 236-248. http://dx.doi.org/10.1037/0022-0663.90.2.236
Spinath, B., Spinath, F., Harlaar, N., & Plomin, R. (2006). Predicting School Achievement from General Cognitive Ability, Self-Perceived Ability, and Intrinsic Value. Intelligence, 34, 363-374. http://dx.doi.org/10.1016/j.intell.2005.11.004
Spinath, F. M., Spinath, B., & Plomin, R. (2008). The Nature and Nurture of Intelligence and Motivation in the Origins of Sex Differences in Elementary School Achievement. European Journal of Personality, 22, 211-299. http://dx.doi.org/10.1002/per.677
Steinmayr, R., & Spinath, B. (2009). The Importance of Motivation as a Predictor of School Achievement. Learning and Individual Differences, 19, 80-90. http://dx.doi.org/10.1016/j.lindif.2008.05.004
Van der Stel, M., & Veenman, M. (2008). Relation between Intellectual Ability and Metacognitive Skillfulness as Predictors of Learning Performance of Young Students Performing Tasks in Different Domains. Learning and Individual Differences, 18, 128-134. http://dx.doi.org/10.1016/j.lindif.2007.08.003
Van der Stel, M., & Veenman, M. (2010). Development of Metacognitive Skillfulness: A Longitudinal Study. Learning and Individual Differences, 20, 220-224. http://dx.doi.org/10.1016/j.lindif.2009.11.005
Veenman, M. J., Elshout, J. J., & Meijer, J. (1997). The Generality vs Domain-Specificity of Metacognitive Skills in Novice Learning across Domains. Learning and Instruction, 7, 187-209. http://dx.doi.org/10.1016/S0959-4752(96)00025-4
Veenman, M. V. J. (1993). Intellectual Ability and Metacognitive Skill: Determinants of Discovery Learning in Computerized Environments. Dissertation, Amsterdam: Universiteit van Amsterdam.
Veenman, M. V. J., & Beishuizen, J. J. (2004). Intellectual and Metacognitive Skills of Novices While Studying Texts under Conditions of Text Difficulty and Time Constraint. Learning and Instruction, 14, 621-640. http://dx.doi.org/10.1016/j.learninstruc.2004.09.004
Veenman, M. V. J., & Spaans, M. (2005). Relation between Intellectual and Metacognitive Skills: Age and Task Differences. Learning and Individual Differences, 15, 159-176. http://dx.doi.org/10.1016/j.lindif.2004.12.001
Veenman, M. V. J., & Verheij, J. (2003). Technical Students’ Metacognitive Skills: Relating General vs. Specific Metacognitive Skills to Study Success. Learning and Individual Differences, 13, 259-272. http://dx.doi.org/10.1016/S1041-6080(02)00094-8
Veenman, M. V. J., Kerseboom, L., & Imthorn, C. (2000). Test Anxiety and Metacognitive Skillfulness: Availability versus Production Deficiencies. Anxiety, Stress and Coping, 13, 391-412. http://dx.doi.org/10.1080/10615800008248343
Veenman, M. V. J., Kok, R., & Blöte, A. W. (2005). The Relation between Intellectual and Metacognitive Skills in Early Adolescence. Instructional Science, 33, 193-211. http://dx.doi.org/10.1007/s11251-004-2274-8
Veenman, M. V. J., Van Hout-Wolters, B. H. A. M., & Afflerbach, P. (2006). Metacognition and Learning: Conceptual and Methodological Considerations. Metacognition and Learning, 1, 3-14. http://dx.doi.org/10.1007/s11409-006-6893-0
Veenman, M. V. J., Wilhelm, P., & Beishuizen, J. J. (2004). The Relation between Intellectual and Metacognitive Skills from a Developmental Perspective. Learning and Instruction, 14, 89-109. http://dx.doi.org/10.1016/j.learninstruc.2003.10.004
Veenman, M. V., & Elshout, J. J. (1991). Intellectual Ability and Working Method as Predictors of Novice Learning. Learning and Instruction, 1, 303-317. http://dx.doi.org/10.1016/0959-4752(91)90011-V
Victor, A. (2005). The Effects of Metacognitive Instruction on the Planning and Academic Achievement of First and Second Grade Children. Doctoral Dissertation, Available from ProQuest Dissertations & Theses database. (UMI No. 3152786)
Watkins, M., Lei, P., & Canivez, G. (2007). Psychometric Intelligence and Achievement: A Cross-Lagged Panel Analysis. Intelligence, 35, 59-68.
Wigfield, A., & Eccles, J. (1992). The Development of Achievement Task Values: A Theoretical Analysis. Developmental Review, 12, 265-310. http://dx.doi.org/10.1016/0273-2297(92)90011-P
Wigfield, A., & Eccles, J. (2000). Expectancy-Value Theory of Achievement Motivation. Contemporary Educational Psychology, 25, 68-81. http://dx.doi.org/10.1006/ceps.1999.1015
Winne, P. H., & Nesbit, J. C. (2010). The Psychology of Academic Achievement. Annual Review of Psychology, 61, 653- 678.