Journal of Environmental Protection
Vol.3 No.11(2012), Article ID:25062,12 pages DOI:10.4236/jep.2012.311172
A Multiparameter Colloidal Titrations for the Determination of Cationic Polyelectrolytes
![]()
1Centro de Graduados e Investigación del Instituto Tecnológico de Tijuana, Blvd. Industrial s/n Mesa de Otay, Tijuana, México; 2Centro de Investigación y Desarrollo Tecnológico en Electroquímica-Unidad Tijuana, Carretera Tijuana-Tecate, Parque Industrial El Florido, Tijuana, México.
Email: oropeza1@yahoo.com, moropeza@cideteq.mx
Received August 10th, 2012; revised September 9th, 2012; accepted October 6th, 2012
Keywords: Polyelectrolyte Quantification; Colloidal Titration; Zeta Potential; Polydadmac; O-Toluidine Blue Indicator; Wastewater Treatment
ABSTRACT
In water treatment processes and conditioning drinking water, PEs are widely used; however, their environmental impact is still doubtful, since residual concentrations increase organic matter content and represents a potential health hazard. This paper demonstrates a multiparametric study of two colloidal titration methods: spectrophotometric and zeta potential end point detection. The first one was optimized to guarantee the accuracy of cationic commercial PE quantification. It includes the indicator dose optimization using analytical criteria for competing equilibria, a calibration curve for two ranges of CPE concentration (1 - 5 ppm and 5 - 100 ppm) and the interference study of flocculant and Sn in the CPE quantification. The second method provides a physicochemical validation of the electric surface phenomena occurring during the colloidal titration and the end point detection. As an additional contribution the zeta potential titration was discussed and proposed as an alternative method for quantifying CPE when the sample is metal free.
1. Introduction
A polyelectrolyte, PE, is a polymer that dissociates in solution. Usually, PEs are identified as macroions, i.e. charged macromolecules or dissociable groups covalently linked to the polymeric structure and balanced by simple counterions. Natural and synthetic PEs are used in different industrial areas by their ability to modify the stability of dispersed solid particles in water. In the environmental area, for example, PEs are mainly employed in sludge conditioning, removal of heavy metals [1], coagulants and flocculants in the wastewater treatment and drinking water conditioning. In those cases, PEs play the role of neutralizing agents that adsorb strongly into the solid particles, usually found in after-process raw water. When suspended or colloidal particles in waste water do not precipitate or they take long time to sediment two popular cationic polyelectrolytes are used: Polydadmac and EPI-DMA [1]. Frequently, the dose of PEs is exceeded looking for a faster sedimentation; however, this phenomenon depends on the particle size and particle density. For this reason PEs are recommended to promote solids separation by gravity [2]. Although cationic and anionic PEs are effective in the water treatment processes, in recent years they have claimed attention due to the environmental impact of residual concentration. Another environmental risk is that PEs may contain considerable amounts of toxic raw materials commonly used in their production chains. Moreover, there are reports [3] that show the adverse effect caused by PEs linked with toxic substances after a water treatment process. Consequently, operators of waste water treatment plants need to control the residual concentration of PEs, in the early stages of the treatment process, and improve the quality of treated water.
Therefore, sensitive and rapid analytical methods for measuring the concentration of PEs in different systems (biochemical, biomedical and environmental) are necessary, as well as in those cases where an overdose (processes out of control) or accidental spills occur. The desired limit of detection for polymers is 1 mg/L suggested by Michael Fielding AWWA [3] which is 10% of the maximum allowable dose (10 mg/L) for Polydadmac. This paper demonstrates how to optimize and guarantee the accuracy of cationic commercial PE quantification performing a multiparametric study of two colloidal titration methods: spectrophotometric and zeta potential end point detection. For the spectrophotometric end point detection the indicator dose optimization, two differente ranges of detection (1 - 5 ppm) (5 - 100 ppm), as well as the interference of flocculants and metals as Sn, were studied. Zeta potential end point detection was used to validate the spectrophotometric method, showing that the polydamac quantification could be done successfully for water samples without dissolved metals.
1.1. Analytical Methods for the Determination of PEs
Different analytical methods to quantify residual PEs in the effluent of treated water are reported (Figure 1). For example, size exclusion chromatography (with ultraviolet detection or refractive index) [4], kinetic methods [5], fluorescent probes [6], tannic acid method [7], two-phase titration [8], polarography [9], voltammetry [10], extraction-spectroscopy [11], clay sedimentation rate [12], systems of injection analysis flow [13,14] and colloidal titration [15].
To quantify and identify PEs with high charge density, in solution, Terayama [15] proposed the colloidal titration. This method is based on the stoichiometric reaction between colloidal particles, positively and negatively charged. The end point is frequently detected with colorimetric indicators by visual inspection or spectrophotometric measurements. Several authors have shown that colorimetric detectors are preferred to quantify cationic PEs. For anionic PEs only few indicators work efficiently; however, it is common to use the well known back-titration [16].
The endpoint of cationic or anionic PE titration, without indicator, may be followed by measuring the zeta potential [2,17], conductimetry [18], viscosimetry (minimum viscosity at the point of equivalence) [19], turbidimetry (maximum turbidity at the point of equivalence) [20], fluorimetry [2,22] and potentiometry [16,23].
In this paper the colloidal titration, with spectrophotometry and zeta potential end point detection, was chosen to show that analytical criteria as equilibrium predominance in parallel reactions and interferences of another PE or metallic species could be considered to improve the quantification of CPE even if they seem to be well known methods.
1.2. Colloidal Titration Particularities
Cationic PEs are usually determined in water by colorimetric methods with OTB (blue/purple). The end point could be detected by visual inspection; however it depends on eye sensibility of each person, thus UV-Vis spectroscopy is a better technique. Kam and Gregory [24] and Zanuttini and Mocchiutti [9] suggested to relate the absorbance diminution at 628 nm as the titrant is added. They propose that the aqueous solution absorbance diminish first by a dilution effect but then the indicator starts to complex with PVSK, appearing a new absorbance point at 509.5 nm (hipsochromic displacement). As established for competing equilibriums the predominance of one reaction over the other one depends on the concentration of each reactive. For a colloidal titration three issues should also be considered, the formation of a solid phase that may interfere the UV-Vis detection, the pH and the ionic strenght. Zanuttini and Mocchiutti [9], for example, avoid the solid phase formation using surfacetants. Kam and Gregory [24] presented studies of pH and ionic strength. However they do not present any informa-
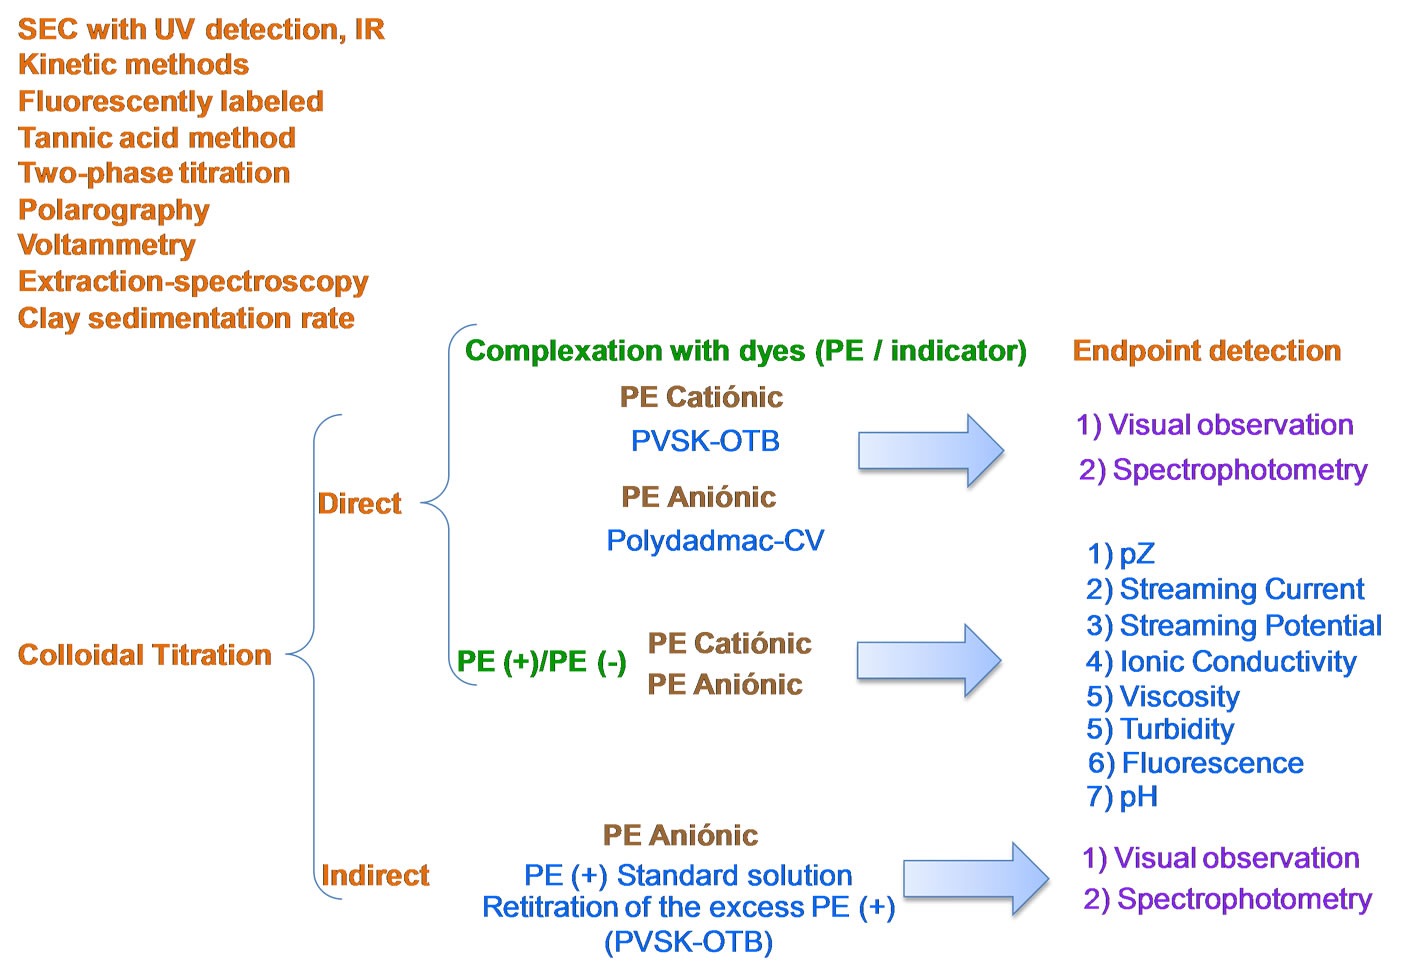
Figure 1. Analytical methods for the quantification and identification of dissolved PEs.
tion concerning the optimization of OTB concentration. In this paper the optimization of OTB dose is one of the main objectives using the Abs at 509 nm vs µmoles OTB. For direct titration of anionic PEs, there are few suitable indicators that show a distinct color change end point; moreover another disadvantage is that the absorption spectrum of the indicator is pH dependent, needing a buffer solutions shortening the pH range for accurate titration. On the other hand, some studies reported indirect colloidal titration for anionic PEs [25]. This method consists of adding a known amount of cationic PE, and back-titrate the excess of cationic PE with the system PVSK/OTB. However, back-titration is tedious and time consuming. The direct titration method with the system PE(+)/PE(−) using the streaming current and streaming potential technique to monitor the progress of the titration continuously is one method currently used to determine anionic PEs [25]. In this paper we use the direct titration method with the system PE(+)/PE(−) without the use of indicators detecting the end point titration by measuring the zeta potential, and even if it requires the understanding of the physicochemical phenomena (Figure 2), it results very simple to quantify the residual PEs in treated water.
2. Materials and Methods
2.1. Reagents
Poly(vinyl sulfate) potassium salt (PVSK), molar mass 170 KDa, obtained from Sigma-Aldrich. The negative charges are attributed to sulfate group in each monomer. Polydadmac (OPTIFLOC C-1008) and Flocculant (Trident 27506) that are commercial PEs intended to be quantified in an industrial waste water treatment process. The concentration of polymers, M (mol/L), was expressed on the basis of monomeric unit which indicates the moles of ionic group per liter of the polymer solution.
Toluidine Blue O (OTB) solution was used as an indicator and was obtained from Sigma-Aldrich. Tin solution standard for AAS, 1000 mg/L (FLUKA).
2.2. Apparatus
Absorbance of the sample solution was measured at 400 - 800 nm with a spectrophotometer UV-Visible (Cary 100 Conc, Varian) using a 10 mm pathlength cell.
Turbidimetry. The optical density of aqueous polymer solutions was monitored at 500 nm by means of a Uvvisible spectrophotometer (Cary 100Conc, Varian) using a 10 mm pathlength cell.
For zeta potential measurements during titration of cationic PEs the Zetasizer ZS (Malvern) instrument was employed [26].
2.3. Quantification of Cationic PEs by UV-Visible
Synthetic PVSK-OTB solutions were prepared mixing 1.0 mL of a 1.24 mM PVSK and different additions of a 0.27 mM OTB into a 10 mL final volume.
First the optimal OTB/PVSK was studied to detect the equivalence point of the titration according to the following procedure: 1 mL of solution added PVSK 1.24 mM and dilute to 10 mL with deionized water in a volumetric flask 10 mL giving a final concentration of 0.124 mM, this was taken as blank. Other solutions were prepared containing 1 mL of 1.24 mM PVSK and additions

Figure 2. Particle surface charge distribution during the electrophoretic mobility measurement.
from 0.1 to 1 mL of 0.27 mM OTB and diluted to 10 mL with deionized water. A solution was prepared with 1 mL of 0.27 mM OTB and diluted to 10 mL with deionized water. UV-Vis absorbance of each prepared solutions were done and a graph of absorbance at 509 nm vs µmoles OTB, was constructed.
The determination of cationic PE was made by the colloidal titration method with spectrophotometric detection of the equivalence point using the color change of the OTB (blue to pink) via the PE system/indicator. Indicator solution was prepared by 0.27 mM OTB, a solution of 1.24 mM PVSK which was used as titrant.
A synthetic Polydadmac (10 mg/L) + OTB (13.5 µM) solution was prepared in a volumetric flask of 10 mL. After the UV-Vis absorbance was read, the solution of the cell was returned to a 20 mL vial and added a known amount of titrant PVSK, stirred for 30 s, and returned to the UV-Vis cell for its absorbance measurement again. In the same way, titrant additions continued until the end of titration (the color changed from blue to pink) of the positive PE solution.
According to the colloidal titration method described above, the titration of synthetic Polydadmac solutions in the concentration range of 1 to 100 mg/L using the system PVSK/OTB were carried out until the end point detection.
2.4. Quantification of Cationic PEs by pZ
Polydadmac synthetic solutions were prepared in the concentration range of 1 to 100 ppm, taking a certain amount of a solution 1.28 mM PVSK and diluting to 10 mL with distilled water in a volumetric flask. The prepared solution was poured into a 20 mL vial and the zeta potential was measured initial solution to be titrated. Next was added a certain amount of titrant 1.28 Mm PVSK solution, was stirred for 30 s and measured the pZ of the solution. There have been various additions of titrant until it reached the isoelectric point and the solution turned turbid.
2.5. Flocculant and Metal Interference in the Quantification of Polydadmac
Solutions of 5 ppm Polydadmac in the presence of varying amounts of Sn (1, 2.5, 5 and 10 ppm Sn), then titrated with PVSK detecting the equivalence point by the spectrophotometric method.
Solutions of 5 ppm Polydadmac in the presence of varying amounts of flocculant (1, 2.5 and 5 ppm Flocculant Trident 27506), then titrated with PVSK detecting the equivalence point by the spectrophotometric method.
2.6. Zeta Potential Measurements
With a syringe, 1 mL of sample was placed into a port of the zeta potential cell, the sample was injected slowly checking that all air bubbles were removed. Once the sample begins to come out the other port of the cell, the respective plugs were placed. Capillary cell was inserted in the Zetasizer ZS equipment and read the zeta potential value.
3. Results and Discussions
The experimental strategy was based on a multiparametric study of two colloidal titration methods: spectrophotometric and zeta potential end point detection. The first one was optimized to guarantee the accuracy of cationic commercial PE quantification. It includes the indicator dose optimization using analytical criteria for competing equilibrium, two linear regressions of CPE concentration vs. titrant added volume for different concentration ranges and the interference study of flocculant and Sn in the CPE quantification. The second method provides a physicochemical validation of the electric surface phenomena occurring during the colloidal titration and the end point detection. As a additional contribution the zeta potential titration (Figure 3) will be discussed and proposed as an alternative method for quantifying CPE when the sample is metal free.
3.1. Quantification of Cationic PEs by UV-Visible
Usually the indicator concentration is at least 10–3 times less concentrated than the titrant but there is no a strict rule to decide it. In this paper we propose a previous optimization of these parameters based on the used method for metal titrations with spectrophotometric detection [27].
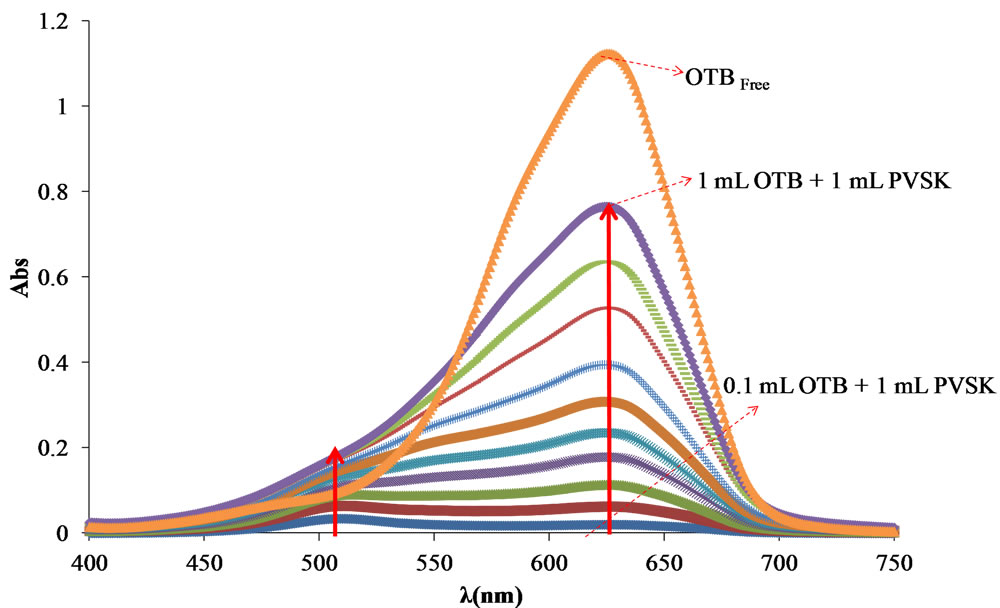
As far as me understand there are no published data about the optimum wavelength and PVSK-OTB ratio, previous to perform the titration of cationic PE, the absorbance spectra of a PVSK and PVSK-OTB solutions were obtained. In Figure 4 free OTB has a maximum absorbance at 628 nm and the intensity decreases when OTB interacts with PVSK. The complex formed by the association of these two species presents an absorbance band at 509 nm. In the first solution (0.1 mL OTB solution + 1.0 mL 1.24 mM KPVS solution) the spectrum shows almost exclusively the absorption band corresponding to the OTB-PVSK complex (509 nm). For the rest of solutions the absorption band corresponding to the formed complex increases, but also the absorption band of free OTB in solution indicating that at higher concentration of OTB, PVSK has been saturated.
Figure 4(b) reports the profile of OTB-PVSK complex absorbance, at 509 nm, versus the amounts (µmoles) of OTB added. It is observed a change in slope at 0.5 mL of OTB solution added (13.5 µmoles). This corresponds
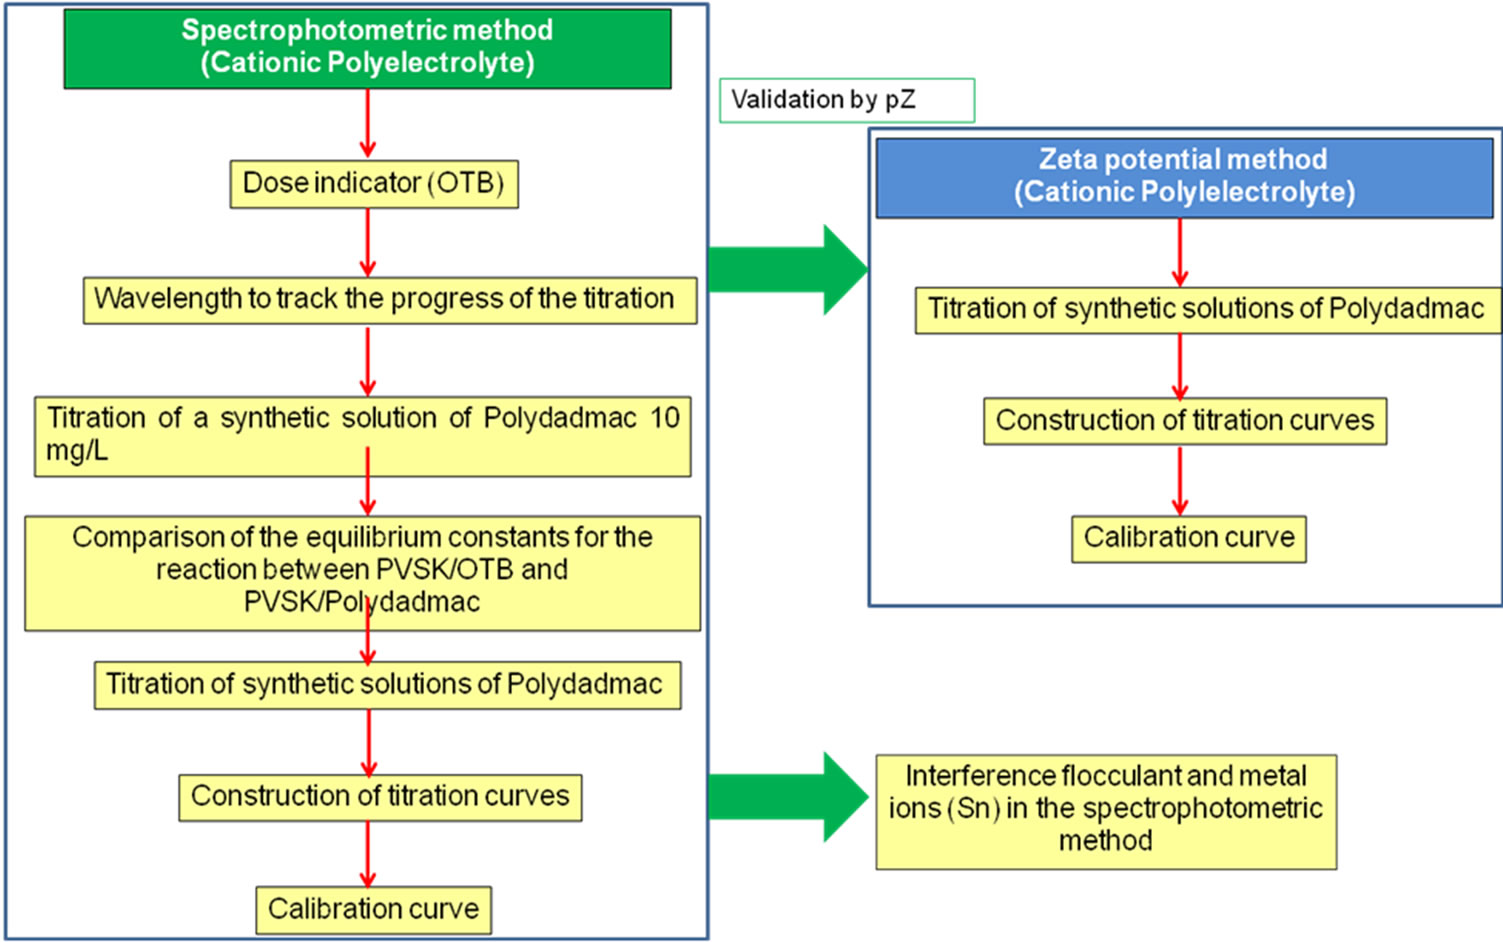
Figure 3. Experimental strategy for the quantification of PEs.
 (a)
(a) (b)
(b)
Figure 4. (a) Absorbance spectra of solutions containing 1.24 mM PVSK and OTB, with increasing additions of 0.27 mM OTB, (b) Relationship OTB-PVSK optimal for the titration of cationic PE.
to the equivalence point titration of PVSK with OTB and indicates the optimal dose of indicator that must be used to detect the equivalence point in the CPEs titrations.
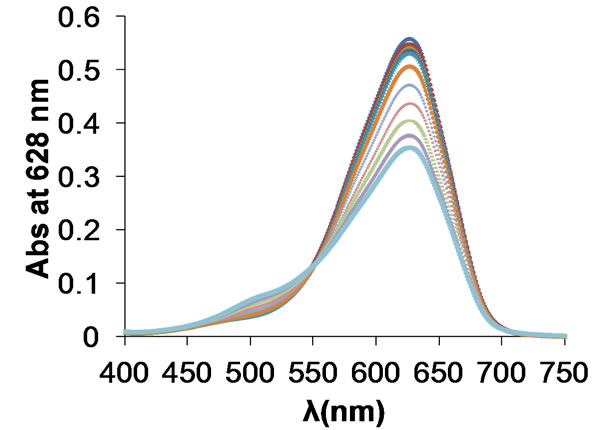
The titration of a Polydadmac (10 mg/L), using OTB (13.5 µM) solution as indicator, was performed with a 1.24 mM PVSK solution. Figure 5(a) shows a serie of UV-Vis spectra nitide and well defined with an initial maximum absorbance at 628 nm corresponding to free OTB. As the titration progress, a hypsochromic shift of the band occurs from 628 nm to 509 nm due to the adsorption of the OTB on PVSK, as reported by Kam and Gregory [24]. The decrease in absorbance value at 628 nm during the titration is more prominent and sensitive than the increase in of absorbance at 509 nm. For this reason, the wavelength at 628 nm is preferred to monitor progress of the titration [28].
One way too compare the equilibrium reactions (Equations (1) and (2) that occur during the titration of PEs (Figure 6), is to construct the plot K1/K2 vs added volume of PVSK (Figure 7) even if the real values of K1 and K2 are unknow as presented by Kam and Gregory [24].
If K1 is hundred times larger or more than K2, the reaction between the anionic PE and OTB does not occurs until the reaction between the anionic and cationic PEs (K1) is completed. Comparison of the molar percentage (M %) of OTB complexed with PVSK (based on the decrease in absorbance value at 628 nm) with respect to the amount of PVSK added is shown in Figure 7 for different K1/K2 ratios. The best fit of the experimental data corresponds to K1/K2 = 100 ensuring that the colloidal titration with the end point detection by spectrometry at the OTB dose, previously established, can be considered
 (a)
(a) (b)
(b)
Figure 5. Titration of a solution of 10 mg/L Polydadmac and 13.5 mM OTB using 1.24 mM PVSK as titrant (curves corresponding to additions of PVSK 0 - 2 mL). (a) Absorbance spectra; (b) Absorbance at 628 nm vs mL of PVSK.
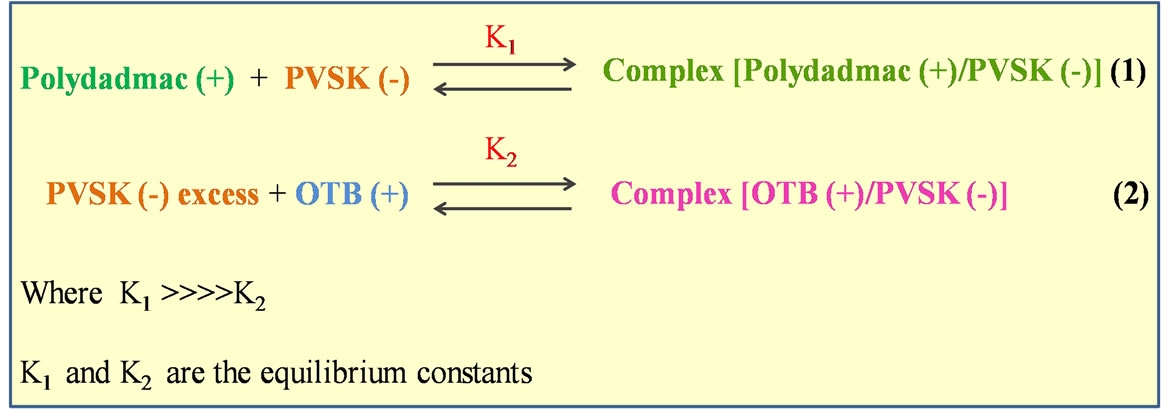
Figure 6. Reactions of equilibrium titration UV-visible spectrophotometer.
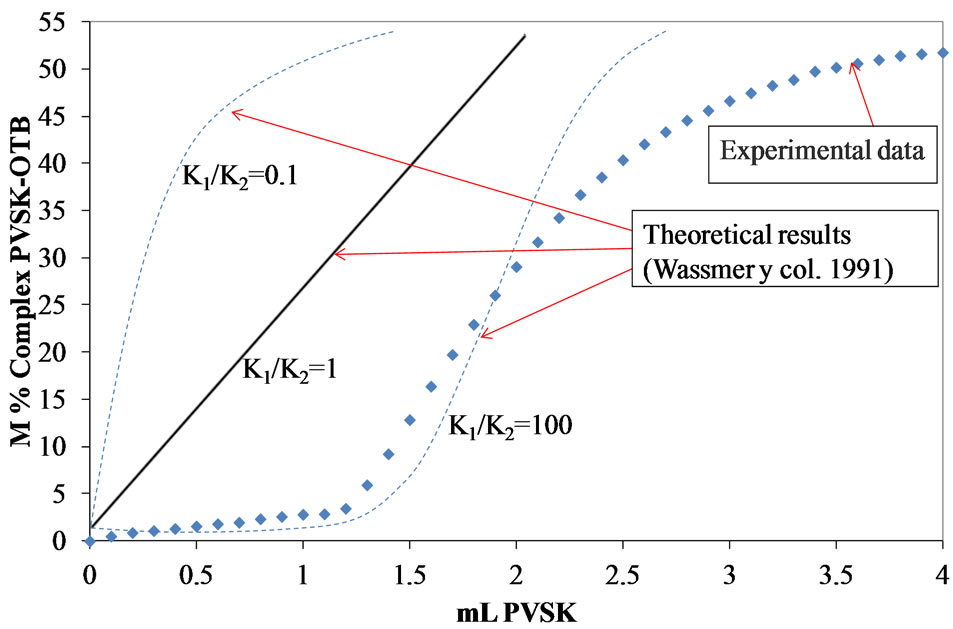
Figure 7. M% PVSK-OTB complex during the titration of a solution of 10 mg/L polydadmac.
as an accurate method. Experimental data Figure 7 demonstrates that the equivalent point of titration for Polydadmac with OTB-PVSK is exactly where the value of absorbance at 628 nm clearly decreases. Since, the titrant have totally reacted with Polydadmac and then continue with OTB.
Figure 5 shows the titration curve of a 10 mg/L of Polydadmac solution with PVSK as titrant. At the beginning (to the third addition) of the titration the absorbance decreased only by diluting the solution with the addition of titrant. Then the PVSK forms a complex with the Polydadmac in the solution without reacting with OTB. Once all the Polydadmac has reacted, PVSK in excess, forms a complex with the OTB, and the absorbance value at 628 nm decreases, while at 509 nm absorbance value increases [28].
According to Rice and Roeraade [29], it is difficult to identify the exact equivalence point titration because certain amount of indicator is adsorbed on the PVSK before changing color. Furthermore, it is not possible to accurately observe the turning point in the titration curve. The natural alternative should be to prepare a more concentrated solution of titrant, but this action might implied to repeat the optimization of the indication dose, as described above. Another way to determine the endpoint of the titration curve, with the same titrant solution is using the Equation (1);
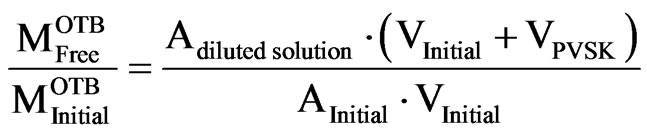 (1)
(1)
 mol/L of initial OTB solution to the holder.
 mol/L of OTB that have not reacted with the titrant PVSK.
 absorbance of the solution to holder at λ 628 nm.
 absorbance of the diluted solution and where the OTB PVSK not yet reacted.
 volume of the diluted solution PVSK.
 initial volume of the solution to the holder.
This relationship is a correction to quantify the effect of dilution caused by the addition of PVSK (Figure 8).
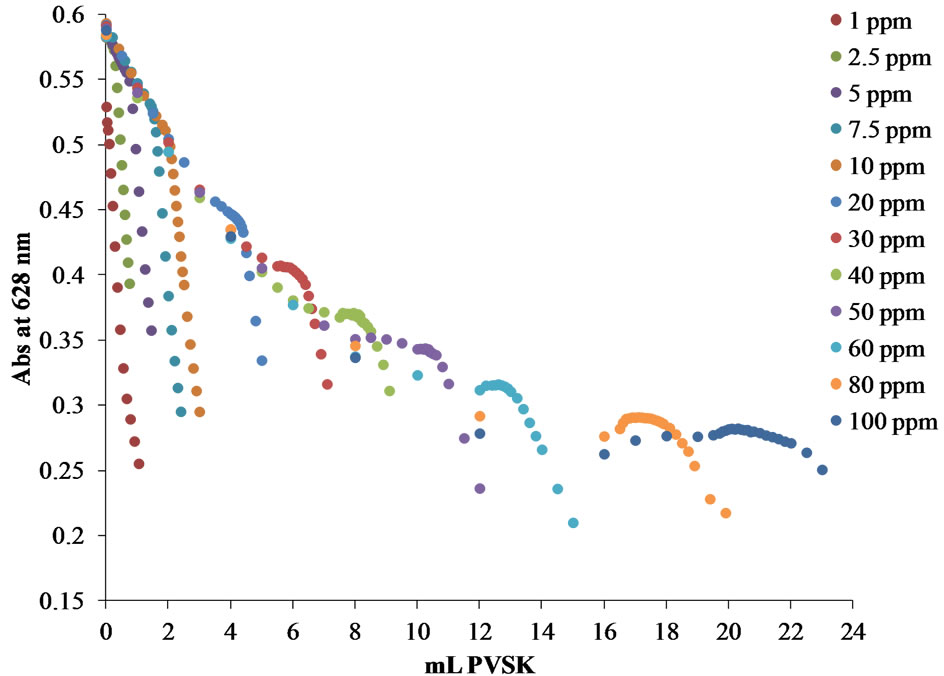
In order to compare the behavior following the titration curves through two forms of graphical representation and determine which is more reliable to determine the equivalence point, two different plots were constructed: Abs at 628 nm vs mL PVSK and OTBlibre/OTBinical vs mL PVSK. In Figure 9, both graphical representations are shown, in Figure 9(a), it is observed that a higher concentration of Polydadmac solutions the equivalence point is shifted to larger volumes of PVSK. However, this form of representation cannot adequately determine the equivalence points in the titration curves for lower concentrations of 5 ppm Polydadmac.
Figure 9(b) shows that by this form of representation can be seen in the titration curves of higher concentrations of 5 ppm of polydadmac, that the ratio of OTBFree/ OTBInitial throughout the progress of the titration takes values greater than unity and shows a maximum near the equivalence point. This behavior is attributed to the increase of turbidity as the amount of complex PVSK/ Polydadmac appear and deposition of material on the quartz cell. Therefore, the equivalence point determined more accurately by representing the titration curves in

Figure 8. Relationship OTBFree/OTBInitial titration of a solution of 10 mg/L polydadmac using 13.5 µM as an indicator and PVSK as titrant.
 (a)
(a)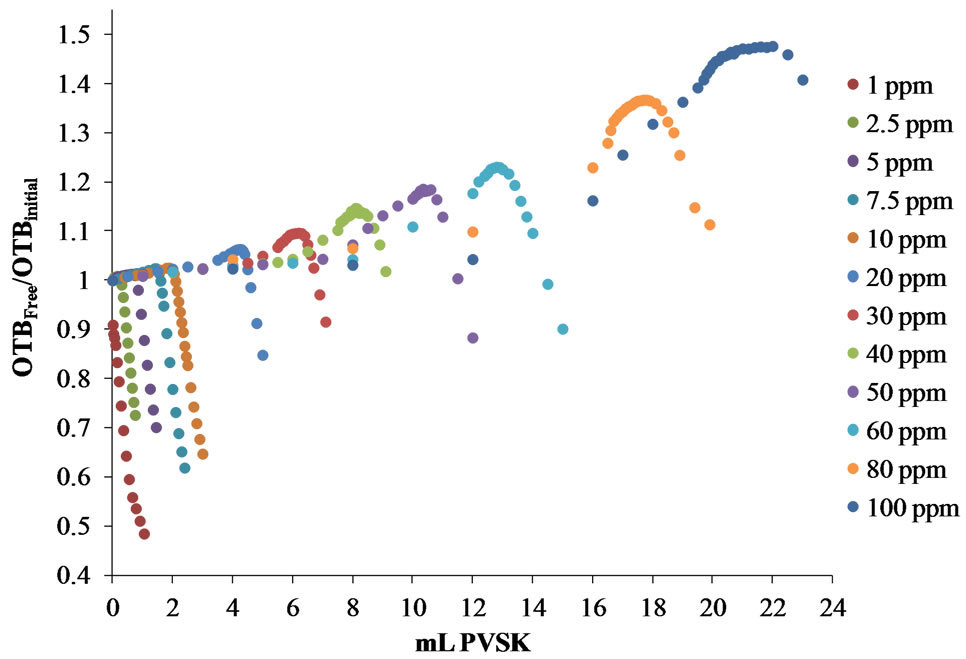 (b)
(b)
Figure 9. Titration curves for synthetic solutions from 1 to 100 ppm of polydadmac. (a) Absorbance at 628 nm vs mL PVSK, (b) OTBFree/OTBInitial vs mL PVSK, for cationic PE solutions (polydadmac).
the form of the relationship OTBFree/OTBInitial based on mL PVSK added only for solutions of concentration below 5 ppm.
Figure 10 shows the calibration curve obtained for the concentration range of 1 - 5 ppm Polydadmac for determining the equivalence point by way OTBFree/OTBInitial vs mL PVSK, and the calibration curve obtained for the concentration range of 5 - 100 ppm Polydadmac for determining the equivalence point by way Abs 628 nm vs mL PVSK. Standard curves of both forms of determining the equivalence point coincide, giving a tool for any WWTPs operators to quantifying Polydadmac in two concentration ranges. Therefore, it is very reliable to use this curve to estimate Polydadmac concentration in samples of treated wastewater.
In order to validate the direct colloidal titration method with spectrophotometric detection of the equivalence point by interacting PVSK/OTB, we performed direct titration Polydadmac synthetic solutions with detection of the equivalence point by zeta potential measurements. It is important to mention that this method is also an alternative to the spectrophotometric if a zeta potential equipment is available. Titration was performed from a solution of 5 ppm Polydadmac + 13.5 µM OTB with a solution of 1.24 mM PVSK measuring pZ. Figure 11(a) shows that the equivalence point is about 0.82 mL of PVSK, which coincides with the amount of titrant required to reach the equivalence point for the spectrophotometric method.
Furthermore, the titration was performed in a solution containing 5 ppm of Polydadmac (without OTB) with a solution of 1.24 mM PVSK. According to the titration curve obtained (Figure 11(b)), the isoelectric point of the solution was reached with the addition of 0.77 ± 0.01 mL

Figure 10. Calibration curves Polydadmac: ppm = 4.3627 (mL PVSK) + 1.0729, R2 = 0.9911 linear regression to the concentration range of 1 - 5 ppm Polydadmac, ppm = 4.5119 (mL PVSK) + 1.0152, R2 = 0.9996 linear regression for 7.5 - 100 ppm polydadmac.
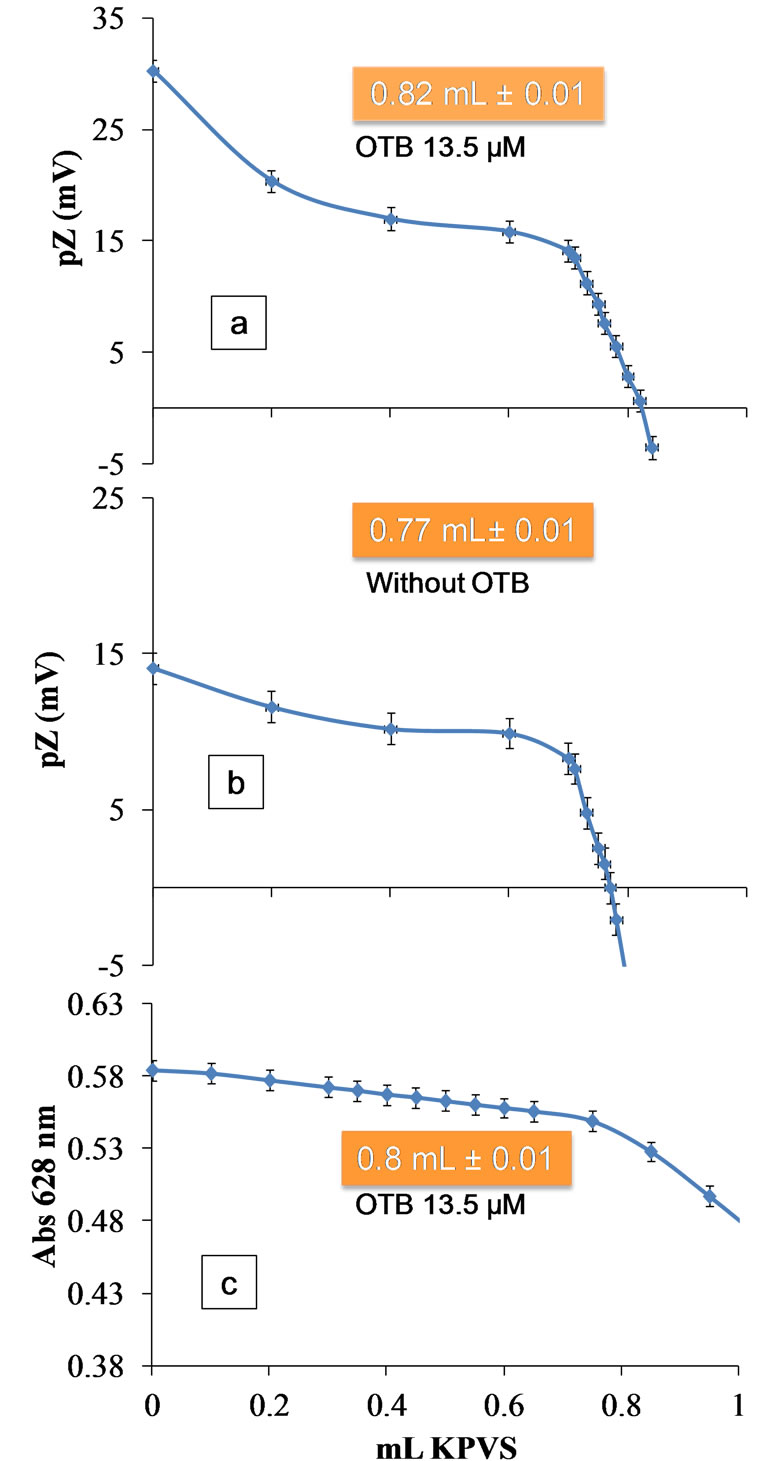
Figure 11. Titration of a solution of 5 ppm Polydadmac with 1.24 mM PVSK measuring the pZ. (a) 13.5 mM solution of OTB; (b) Without OTB; and (c) 13.5 mM solution of OTB by the spectrophotometric method.
of KPVS, corresponding to the equivalence point titration. This value is smaller than (0.05 ± 0.01 mL) the estimated by spectrophotometric method and (0.01 ± 0.01 mL) pZ in the presence of toluidine.
Therefore, it was decided to perform a titration series of Polydadmac synthetic samples to compare the equivalence points estimated by the spectrophotometric method and zeta potential.
Figure 12 shows the titration curves of Polydadmac synthetic solutions with PVSK in the concentration range of 1 to 100 ppm. Figure 13 shows the calibration curve obtained.
Under the same conditions for preparing synthetic solutions Polydadmac and volume measurements, the two methods show a good correlation. However, analyzing the principle of measuring the spectrophotometric method is strongly influenced by the generation of turbidity in the medium or the formation of colloidal particles in the colloidal titration. In contrast, the method of pZ is a direct measure because it is based on measuring the sur-
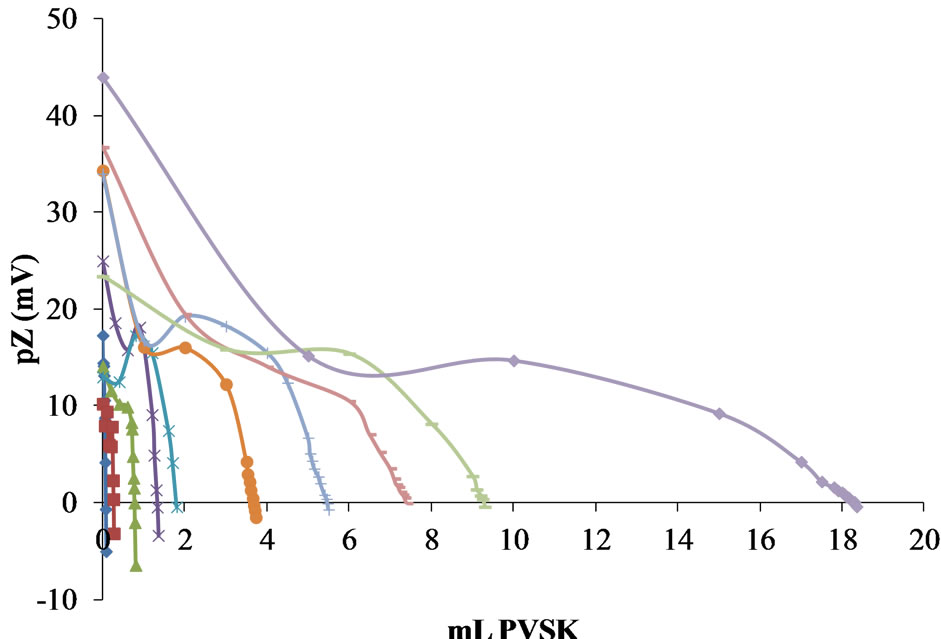
Figure 12. Titration curves of Polydadmac synthetic solutions with PVSK in the concentration range of 1 to 100 ppm.

Figure 13. Comparison of calibration curves obtained by the spectrophotometric method and zeta potential.
face charge of the colloidal particles formed during the progress of colloidal titration. Therefore, the calibration curve obtained by the method of pZ is more accurate in comparison with the spectrophotometric method.
As can be seen, both curves show a good linear fit between the concentration of CPE and mL of titrant, however, it is important to note that the slope of the calibration curve obtained by zeta potential is greater in comparison with the spectrophotometric method, which indicates that the zeta potential method is more sensitive than the spectrophotometric method.
3.2. Effect of the Presence of Flocculant in the Quantification of Polydadmac
In the process of coagulation-flocculation of this study using two types of polyelectrolytes (cationic and anionic), poor dosing of these polyelectrolytes as a result of the interaction that occur in the presence of metal ions may give rise primarily to three situations: 1) to an excess of coagulant in the treated water, 2) an excess of flocculant in the effluent and 3) an excess of both in the treated water. Therefore, it was proposed to study the effect of the presence of a flocculant in the determination of residual polydadmac.
Synthetic solutions of Polydadmac 5 ppm in the presence of 1, 2.5 and 5 ppm of flocculant was titrated using 13.5 µM OTB as an indicator and PVSK as titrant. In Figure 14(a) shows the absorbance spectra and the titration curve in Figure 14(b) of a solution of 5 ppm flocculant polydadmac + 1 ppm and by the spectrophotometric method described above. Compared to the equivalence point of a solution of 5 ppm Polydadmac in the absence of flocculant shifted to about 0.45 ml of PVSK. Using previously obtained calibration curve for quantification of Polydadmac, it was determined that the cationic polyelectrolyte concentration was 3 ppm.
Figure 15 shows as the equivalence point decreases as the flocculant concentration increases. For solutions containing 5 ppm of polydadmac 2.5 and 5 ppm of flocculant, we observed the formation of a precipitate. Therefore, the supernatant was titrated for each solution. As shown in the titration curve of the solution prepared with 2.5 ppm of flocculant, the amount of Polydadmac remaining in the supernatant was 1.4 ppm Polydadmac.
The titration curve of the supernatant of the prepared solution with 5 ppm and 5 ppm flocculant polydadmac polydadmac shows that all the precipitates, and there is nothing remainingin solution.
3.3. Effect of the Presence of Metal Ions in Quantifying Polydadmac
On the other hand, the analytical interference studied of
 (a)
(a)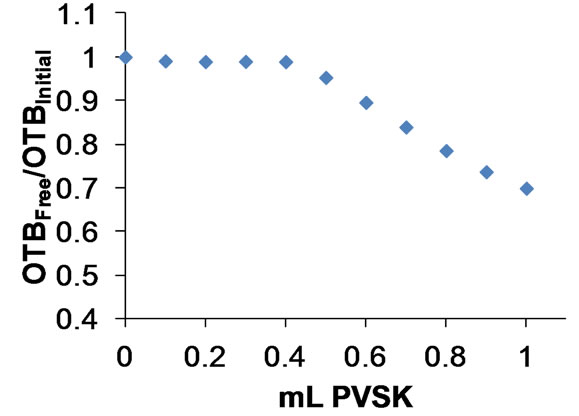 (b)
(b)
Figure 14. Titration of 5 ppm Polydadmac + 1 ppm flocculant with PVSK. (a) Absorbance spectra; (b) Titration curve.
metal ions present in the waste water treated in the cationic polyelectrolyte quantification by titration of 5 ppm Polydadmac synthetic solutions containing different amounts of Sn by the spectrophotometric method. It is important to mention that this case is common in waste water treatment of metal-mechanic industries. Figure 16(a) shows the absorbance spectra and Figure 16(b) the titration curve of a solution containing 5 ppm Poly-dadmac + 10 ppm Sn.
The equivalence point was reached with the addition of 1.35 ml of PVSK, which is greater than the volume of titrant required for the titration of a solution of 5 ppm of Polydadmac without Sn (0.8 mL PVSK). In general, Figure 17 shows that as the concentration of Sn increases the equivalence point is shifted to larger amounts of titrant. The same sample was titrated following the zeta potential of the titrated solution, however the end point detection was unclear suggesting that kinetic effects interfere during the zeta potential measurement.
4. Conclusions
An accurate method to quantify cationic PEs using UV-Visible spectrophotometric method and OTB as an indicator was developed using physicochemical and analytical criteria. First of all the formation of the complex PVSK/OTB (maximum absorbance at 509 nm) is the critical point to decide the correct dose of OTB since the excess of OTB may form a solid aggregate in early stages of the titration. This determination was done using OTB as titrant for 0.124 mM of PVSK. If the titrant concentration changes, the OTB dose may also change and it could be adjusted using the criteria of the breaking point in a plot of Absorbance of the soluble complex (509 nm) vs. moles of OTB added, since this point indicates the change of soluble PVSK/OTB to a solid aggregate. For the studied case in this paper, the optimal OTB concentration was 13.5 µM. This allows the method to be used in the quantification of the coagulant commonly used in
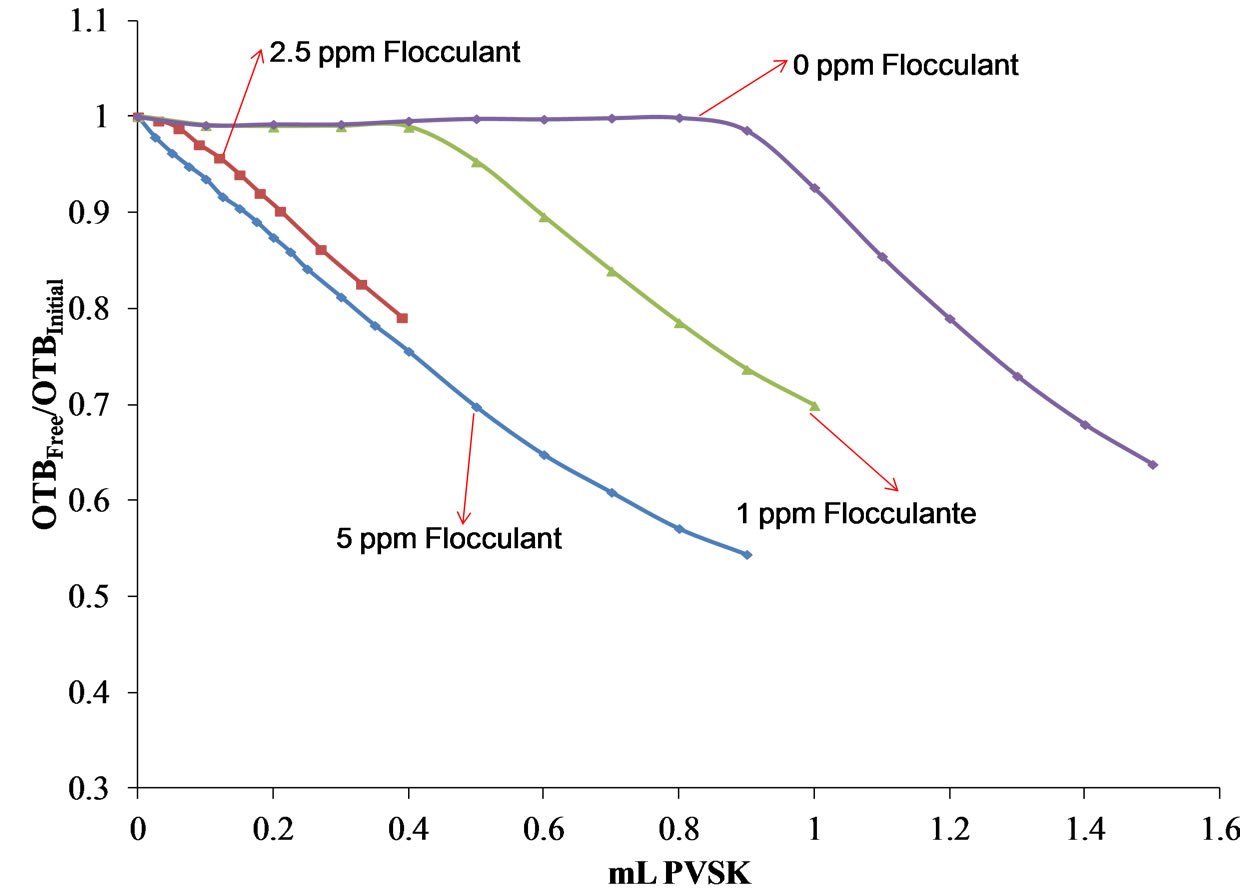
Figure 15. Curves of titration of 5 ppm polydadmac in the presence of different concentrations of flocculant (1, 2.5 and 5 ppm flocculant).
 (a)
(a)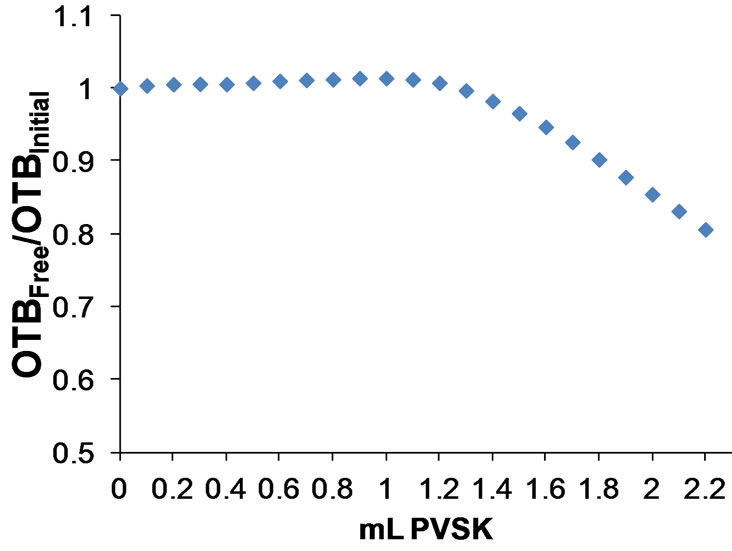 (b)
(b)
Figure 16. Titration 5 ppm polydadmac in the presence of 10 ppm Sn. (a) Absorbance spectra; (b) Titration curve.
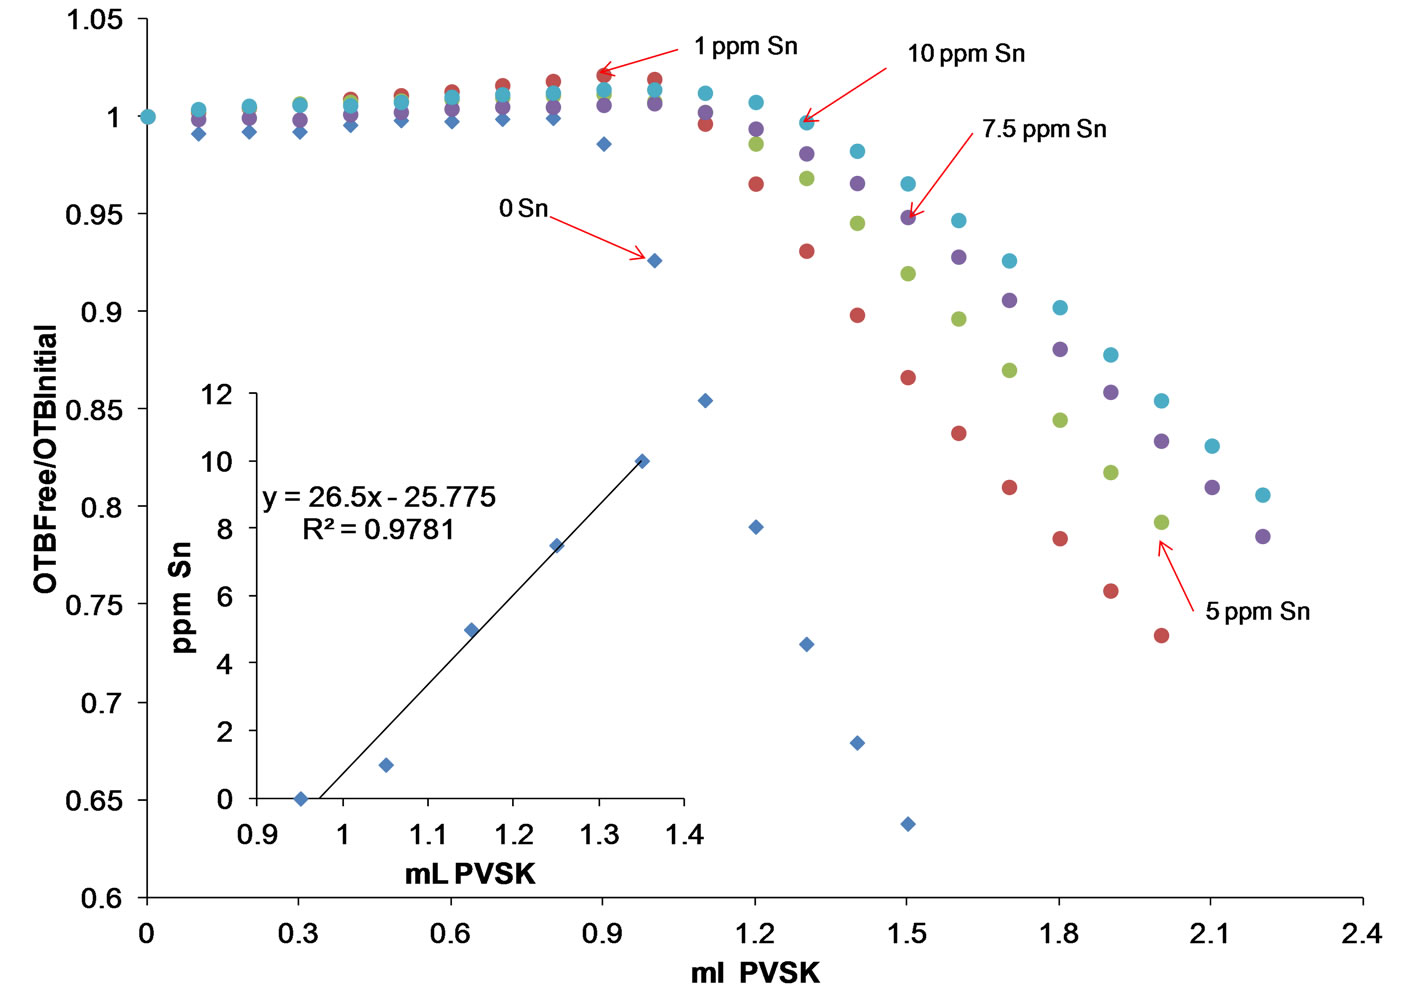
Figure 17. Titration curves 5 ppm Polydadmac in the presence of 1 to 10 ppm Sn, inset: shows a linear dependence exists between the amount of titrant required to reach the equivalence point and the concentration of metal present.
waste water treatment plants. The developed method allows the quantification of Polydadmac in a concentration range of 1 to 100 ppm. The graphical representation of the relationship OTBFree/OTBInitial respect to volume PVSK is inadequate to determine the equivalence point only in solutions of concentration greater than 5 ppm Polydadmac. However, the determination of the equivalence point in the titration of solutions of concentration greater than 5 ppm Polydadmac is more reliable through the plot of Absorbance at 628 nm vs PVSK volume.
The zeta potential method provides a sensitive way to detect changes in the charge density of PE. The detection of the equivalence point from measurements of zeta potential (pZ) turns out to be a suitable method to validate and also determine the coagulant remaining amount in treated water without metals.
Colloidal titration of the cationic polyelectrolyte by zeta potential measurements allows observing how the positive surface charge of the polyelectrolyte decreases as the concentration of titrant (anionic PE) increases as a result of adsorption of the anionic polyelectrolyte. Once it reaches the isoelectric point of the solution, the adsorption of an excess amount of anionic PE in the cationic PE causes a reversal in positive surface charge and re-stabilization of the complex PE(+)/PE(−).
The zeta potential value measured during the titration, which is closer to the isoelectric point (considering the turbid of the solution in analysis) to detect the equivalence points for synthetic solutions of Polydadmac enables the possibility to apply the method to evaluate the physicochemical performance of commercial PEs in the WWTPs.
5. Acknowledgements
Authors acknowledge the enterprise International Rectifiers, S. A., which through Manuel González, Eng., gave a confident vote to a research group situated in Tijuana, to develop a systematic and scientific work that helped for a better operation of their Waste Water Treatment Plant. Authors also thank the Autonomous University of Baja California, Mexico, UABC, that throughout Dr. José Manuel Cornejo-Bravo, provide all facilities to use the Zetasizer equipment for zeta potential measurements. E. A. López-Maldonado gives his gratitude to the National Council of Science and Technology (CONACYT) in Mexico, for the fellowship received in his Ph.D. studies.
REFERENCES
- A. E. Hatch, “Removal of Heavy Metals from Aqueous Solutions,” US Patent 3859210, 1975.
- X. Feng, M. Leduc and R. Pelton, “Polyelectrolyte Complex Characterization with Isothermal Titration Calorimetry and Colloid Titration,” Colloids and Surfaces A: Physicochemical Engineering Aspects, Vol. 317, No. 1-3, 2008, pp. 535-542. doi:10.1016/j.colsurfa.2007.11.053
- M. Fielding, J. Hutchison, et al., “Analytical Methods for Polymers and Their Oxidation By-Products,” American Water Works Association Research Foundation, 1999, p. 13.
- V. T. Wee, “Determination of Cationic Surfactants in Wasteand River Waters,” Water Research, Vol. 18, No. 2, 1984, pp. 223-225. doi:10.1016/0043-1354(84)90072-1
- S. V. Kozel, E. K Skosyrskaya and M. K. Beklemishev, “Kinetic Methods for Determining Water-Soluble Polymers,” Journal of Analytical Chemistry, Vol. 63, No. 7, 2008, pp. 693-699. doi:10.1134/S1061934808070162
- N. S. C. Becker, D. M Bennett, B. A. Bolto, et al., “Detection of Polyelectrolytes at Trace Levels in Water by Fluorescent Tagging,” Reactive & Functional Polymers, Vol. 60, 2004, pp. 183-193. doi:10.1016/j.reactfunctpolym.2004.02.022
- T. Hanasaki, H. Ohnishi, A. Nikaidoh, et al., “Determination of Trace Polymer in Waste Water,” Bulletin of Environmental Contamination and Toxicology, Vol. 35, No. 1, 1985, pp. 476-481. doi:10.1007/BF01636541
- M. Tsubouchi, H. Mitsushio and N. Yamasaki, “Determination of Cationic Surfactants by Two-Phase Titration,” Analytical Chemistry, Vol. 53, No. 12, 1981, pp. 1957-1959. doi:10.1021/ac00235a060
- D. P Parazak, C. W. Burkhardt and K. J. McCarthy, “Determination of Low Levels of Cationic Polyelectrolytes in Water,” Analytical Chemistry, Vol. 59, No. 10, 1987, pp. 1444-1445. doi:10.1021/ac00137a015
- V. P. Y. Gadzekpo, K. P. Xiao, H. Aoki, et al., “ Voltammetric Detection of the Polycation Protamine by the Use of Electrodes Modified with Self-Assembled Monolayers of Thioctic Acid,” Analytical Chemistry, Vol. 71, No. 22, 1999, pp. 5109-5115. doi:10.1021/ac990580m
- J. Kawase and M. Yamanaka, “Continuous Solvent-Extraction Method for the Spectrophotometric Determination of Cationic Surfactants,” Analyst, Vol. 104, No. 1241, 1979, pp. 750-755. doi:10.1039/an9790400750
- W. Weindel and H. Sontheimer, Chemical Abstract, Vol. 112, 1971, pp. 74.
- T. Masadome, “Flow Injection Spectrophotometric Determination of Anionic Polyelectrolytes Using the Cationic Dyes,” Analytical Letters, Vol. 34, No. 15, 2001, pp. 2711-2719. doi:10.1081/AL-100108417
- K. Tôei and T. Zaitsu, “Spectrophotometric Determination of Micro Amounts of Cationic Polymeric Flocculants by Flow Injection Analysis,” Analytical Chimica Acta, Vol. 174, 1985, pp. 369-373. doi:10.1016/S0003-2670(00)84402-5
- H. Terayama, “Method of Colloid Titration (A New Titration between Polymer Ions),” Journal of Polymer Science Part A: Polymer Chemistry, Vol. 8, No. 2, 1952, pp. 243-253. doi:10.1002/pol.1952.120080209
- T. Masadome and T. Imato, “Use of Marker Ion and Cationic Surfactant Plastic Membrane Electrode for Potentiometric Titration of Cationic Polyelectrolytes,” Talanta, Vol. 60, No. 4, 2003, pp. 663-668. doi:10.1016/S0039-9140(03)00140-1
- H. P. Cardwell, “Technique of Streaming Current Detection and Applications,” Environmental Science and Technology, Vol. 1, No. 6, 1967, pp. 482-487. doi:10.1021/es60006a002
- K. Tôei and T. Kohara, “A Conductometric Method for Colloid Titrations,” Analytica Chimica Acta, Vol. 83, 1976, pp. 59-65. doi:10.1016/S0003-2670(01)84631-6
- D. F. Hodgson and E. J. Amis, “Viscometric Titration of a Linear Polyelectrolyte,” Journal of Chemical Physics, Vol. 91, No. 4, 1989, p. 2635. doi:10.1063/1.456972
- K. Tôei and M. Sawada, “A Turbidimetric Method for Colloid Titrations,” Analytica Chimica Acta, Vol. 89, No. 2, 1977, pp. 383-389. doi:10.1016/S0003-2670(01)84736-X
- H. Tanaka and Y. Sakamoto, “Polyelectrolyte Titration Using Fluorescent Indicator. I. Direct Titration of Anionic and Cationic Polyelectrolytes with 10−4N Standard Solutions,” Journal of Polymer Science Part A: Polymer Chemistry, Vol. 31, No. 11, 1993, pp. 2687-2691.
- H. Tanaka and Y. Sakamoto, “Polyelectrolyte Titration Using Fluorescent Indicator. II. Analysis of Cationic Starches and Flocculants,” Journal of Polymer Science Part A: Polymer Chemistry, Vol. 31, No. 11, 1993, pp. 2693-2696.
- T. Masadome and T. Imato, “Potentiometric Titration of Anionic Polyelectrolytes Using a Cationic Surfactant Solution as a Titran and a Titrant-Sensitive Plasticized Poly(Vinyl Chloride) Membrane Electrode,” Journal of Analytical Chemistry, Vol. 358, No. 4, 1997, pp. 538-540.
- S. K. Kam and J. Gregory, “Charge Determination of Synthetic Cationic Polyelectrolyte by Colloid Titration,” Colloids and Surfaces A: Physicochemical and Engineering Aspects, Vol. 159, No. 1, 1999, pp. 165-179. doi:10.1016/S0927-7757(99)00172-7
- K. H. Wasmer, U. Schroeder and D. Horn, “Characterization and Detection of Polyanions by Direct Polyelectrolyte Titration,” Die Makromolekulare Chemie, Vol. 192, No. 3, 1991, pp. 553-565.
- Zetasizer Nano Series User Manual, Malvern Instruments, England, 2004.
- J. S. Fritz, J. P. Sickafoose and M. A. Schmitt, “Determination of Total Hardness in Water Employing Visual and Spectrophotometric Titration Procedures,” Analytical Chemistry, Vol. 41, No. 14, 1969, pp. 1954-1958. doi:10.1021/ac50159a028
- U. Sjödin and L. Ödberg, “The Influence of Metal Ions on Polyelectrolyte Titration,” Colloids and Surfaces A: Physicochemical and Engineering Aspects, Vol. 116, No. 3, 1996, pp. 269-275. doi:10.1016/0927-7757(96)03554-6
- M. Rice and J. Roeraade, “Continuous Filtration and Titration Apparatus for Real Time Monitoring of Polyelectrolyte Concentration and Cationic Demand of a Paper Furnish,” Nordic Pulp and Paper Research Journal, Vol. 18, No. 1, 2003, pp. 95-107.