Journal of Environmental Protection
Vol. 3 No. 8A (2012) , Article ID: 21775 , 7 pages DOI:10.4236/jep.2012.328106
Spatial and Temporal Variation in Water Quality of River Benue, Nigeria
![]()
1Department of Chemistry and Centre for Agrochemical Technology, University of Agriculture, Makurdi, Nigeria; 2Department of Mathematics/Statistics/Computer Science, University of Agriculture, Makurdi, Nigeria.
Email: #eneji3@yahoo.com
Received May 30th, 2012; revised June 26th, 2012; accepted July 25th, 2012
Keywords: River Benue; Water; Quality and Variation
ABSTRACT
The study investigates the spatial and temporal variation in water quality parameters at ten different locations along River Benue for twelve consecutive months. In order to explore the spatial variation among different stations and seasonal changes, multivariate analysis of variance (MANOVA) was used to group these on the basis of spatial similarities. MANOVA on season and station shows that there is no significant difference between the stations investigated while there is for the seasons. This could be viewed as a resulting from the narrow spatial sampling interval (12 km at 0.7% total length of River Benue). However, discriminate analysis identified all the parameters to discriminate between the three seasons with 99.2% correct assignations. Two discriminate functions were found and the total variance cumulative was 100% between seasons. The first function explained 64.8% of the total variance between the seasons while the second function explained 35.2%. Total solids (TS) were the highest contributor in discriminate functions 1 and 2. Therefore, discriminate function analysis would enable us to predict the likely season a water sample from metropolitan Makurdi was collected given the values of the water quality parameters. It also enables us to conclude that all the parameters were responsible for significant seasonal variations in River Benue water quality.
1. Introduction
The quality and quantity of river water is influenced by both natural processes and anthropogenic interferences; the latter constitutes one of the major causes of environmental problems that alter the hydrochemistry in our river systems. Rivers are highly heterogeneous at spatial as well as temporal scales. Variation in the quality and quantity of River water is widely studied across the globe. Riedel et al. [1] examined the spatio-temporal variation in trace elements in Patuxent River, Maryland, while Gupta and Chakrapani [2] studied temporal and spatial variations in water flow and sediment load in Narmada River Basin, India. Temporal and spatial variation of nutrient levels in the Nemunas River (Lithuania and Belarus) has been reported [3]. Multivariate statistical techniques for the evaluation of spatial and temporal water quality of the Mahanadi River—estuarine system, was reported in India [4]. Schaefers and Alber [5] studied temporal and spatial trends in nitrogen and phosphorus inputs to the watershed of the Altamaha River, Georgiawhile Quadir et al. [6] studied spatio-temporal variation in water quality of Nullah Aik, a tributary of the River Chenab, Pakistan. In a case study of the River Bagmati; Kannel et al. [7] examined spatial-temporal variation and comparative assessment of water qualities of urban river system. Najafpour et al. [8] reported evaluation of spatial and temporal variation in river water quality of Shiroud River that discharges to southern part of Caspian Sea, Iran. In their work, they used multivariate statistical techniques to evaluate spatial and temporal variations in water quality and found that discriminate analysis gave the best results for both spatial and temporal analysis. Nikhil and Azeez [9] in India examined the spatio-temporal variation in water quality and quantity of Bharathapuzha River basin using multivariate statistic analysis tools. They found that in basins that are more disturbed, monsoonal discharge was much higher than discharges in other seasons, while the slightly disturbed basin had consistent level of discharge throughout the season. They concluded that change in land use and the impact of dams are major reasons for the spatiotemporal variation in the surface water chemistry of the River.
The use of various statistical analysis techniques such as multivariate analysis of variance (MANOVA), factor analysis (FA), and discriminate analysis (DA) has been employed widely in recent years for analyzing environmental data and drawing meaningful information [10- 13]. In this work, a large data matrix was obtained for twelve consecutive months for River Benue in Central Nigeria to examine the influence of possible sources on the water quality, in order to explain the pollution status of the River. The relationship between the sampling sites, identification of water quality variable(s) responsible for the spatial and temporal variations in water quality was investigated.
2. Materials and Methods
River Benue arises from Adamawa Plateau in the Western Cameroons and flows west across Central Nigeria and joins River Niger 483 km from the Atlantic coast. Its width varies from about 488 to 976 m and its navigable length is more than 965 km during the wet (Raining) season and it is about 1370 km long. The annual total rainfall and diurnal temperature in Makurdi (latitude 7˚44' and longitude 8˚31'E) range from 1200 - 2000 mm (from April to October) and an average of 28˚C - 35˚C, respectively. The river within Makurdi metropolis receives discharges from the Mu and Ageba streams and effluents from Wurukum Abattoir, Wadata open market and the Coca-Cola Plc and Benue Breweries Plc plants. There were ten identified sampling stations: the River Mu and Ageba streams discharge points, University of Agriculture Makurdi Water Intake, Coca-Cola plant, Benue Breweries, River Ageba, Wildlife Park, Wurukum Abattoir, Saint Joseph’s, Nigerian Army School of Military Engineers (NASME) Water Intake, Wadata Open Market and Rice Mill with a total of twelve (12) kilometers distance covered along Makurdi axis of the River (Figure 1). The choice of these stations was informed by the various anthropogenic activities that have been going on, close to or along the river course.
At each station, three (3) sample points were collected along a North-South transect across the River. Samples were taken 30 cm below the water surface five (5) times with 500 mL white glass bottles that had been washed thoroughly with distilled deionized water and rinsed with acetone and dried at 105˚C for thirty minutes (30 min) before use, and transferred into 2.5 litre brown borosilicate glass bottles. Sampling was conducted every two weeks for 12 months (July 2008 and June 2009). Samples collected were stored in an improvised Ice Box (A 50—litre plastic bucket with cover packed with ice blocks), and transported to the laboratory for analysis.
Methods
The odour and taste were analyzed with sensory organs. A portable digital JENWAY model pH meter 3505 with glass electrode was used to determine the pH of the water samples in the laboratory. A general purpose JENWAY
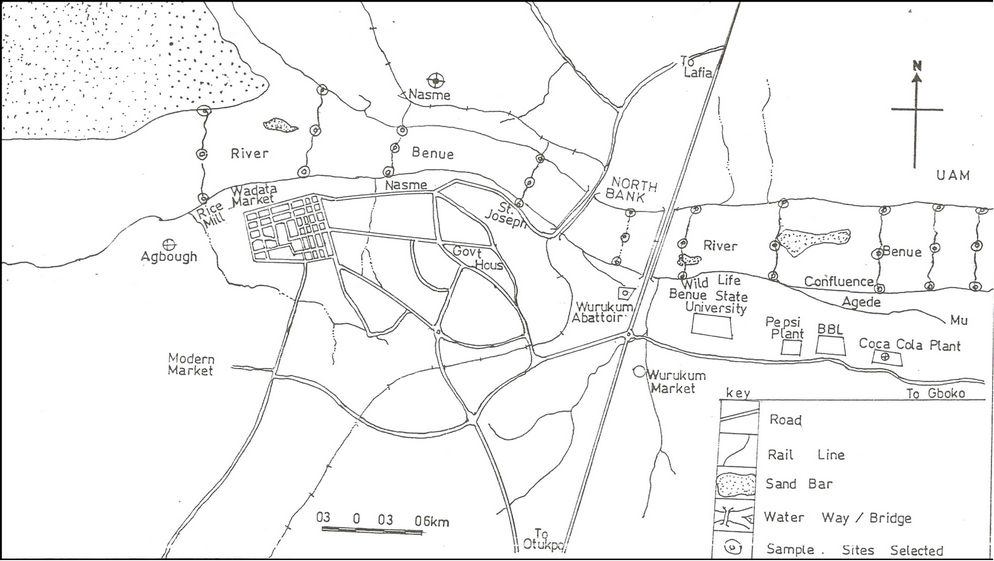
Figure 1. Map showing River Benue in the Makurdi Metropolitan Area (Sampling stations are indicated by transects marked ø across the River).
digital portable model conductivity meter/TDS 470 was used to determine the water surface temperature, total dissolved solids (TDS) and electrical conductivity (EC) on the field. Analysis of dissolved oxygen (DO), biochemical oxygen demand (BOD), chemical oxygen demand (COD), total solutes (TS), total suspended solids (TSS), alkalinity, chloride ion and phosphate ion were analyzed according to standard methods [14]. Total hardness was determined by using EDTA titrimetric method. Statistical analyses were performed using SYSTAT 16.0 (SPSS, USA). Results from the water analysis are expressed as mean values of replicate determinations with their standard errors. Multivariate statistical techniques were applied to examine the effect on spatial and temporal variations of parameters from each sampling stations and across the three seasons.
3. Results and Discussion
The summary of descriptive statistics of the results of the analysis is presented in Table 1, indicating the maximum, minimum, mean values of the parameters and standard error. TS recorded the highest value of 947 mg/L while the chloride ion concentration exhibited the least value of 2.41 mg/L. The standard error around the means is substantially high and random. This could be as result of spatial seasonal changes and also the different anthropogenic activities surrounding the study area [8].
The data obtained were grouped into three seasons as first rainy (S1), dry (S2) and second rainy (S3) as shown in Table 2. The COD exhibited the highest values across the seasons 159 mg/L, 181 mg/L and 193 mg/L for S1, S2 and S3, respectively. Similarly, chloride ion recorded the least values of 1.55 mg/L, 1.06 mg/L and 1.19 mg/L for S1, S2 and S3, respectively. The high TS value of 393 mg/L for the S3 could be due to sampling period (the beginning of the second rainy season).
In order to explore the spatial variation among different stations and seasonal changes, MANOVA was used to group these on the basis of spatial similarities (Table 3). Analyses between and within data stations showed that there were no significant differences at a significance level of α = 0.05. This result could be viewed that the spatial sampling interval (12 km at 0.7% total length of River Benue) is rather small even as the focus was only in the Makurdi metropolitan area (a 30 km stretch of the River). Obviously the River is impacted by the same or similar influences over the spatial sampling interval which could explain the lack of significant variation in the properties in the area. This could be useful in a monitoring protocol: within a year, not much change in properties is expected of the River, so any observed significant change could suggest a point source polluting event.
However, analysis shows that there were significant differences for the seasons (Table 3). The tests of equality of group means (Table 4) measure each parameter’s potential before the discriminate model is created. Each test displays the results of a one-way ANOVA for the parameters using season as the grouping variables. As shown by the p-values (sig.), all the parameters signifi-
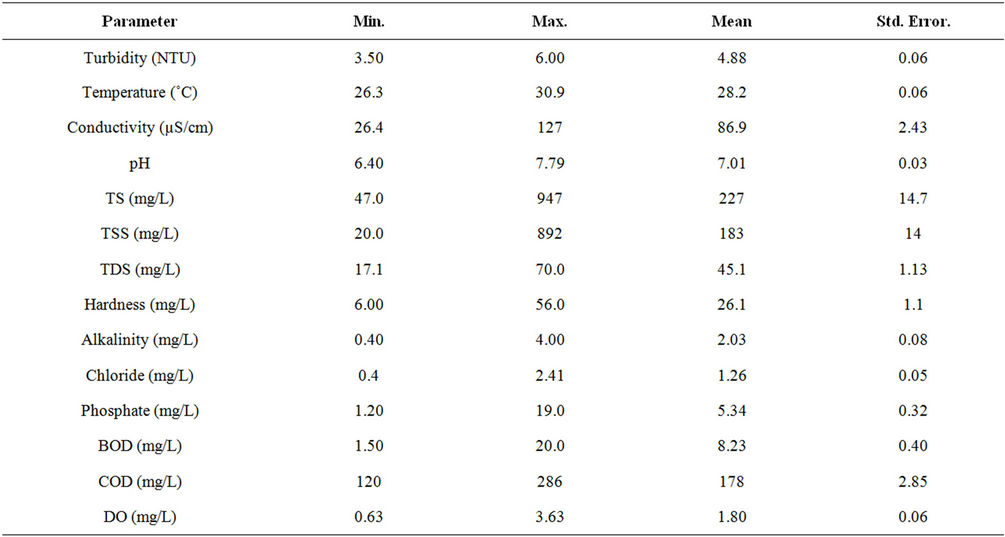
Table 1. Descriptive statistics of selected water quality parameters in River Benue.
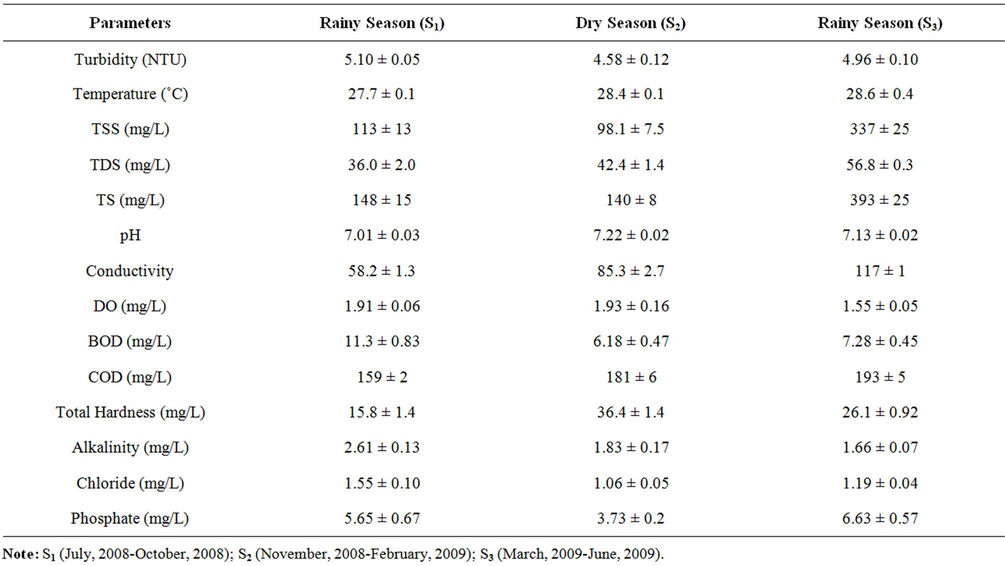
Table 2. Seasonal variation in physio-chemical parameters of the River Benue.
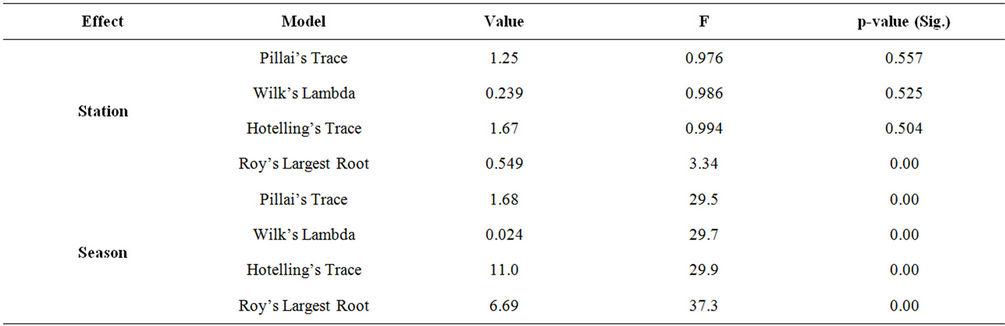
Table 3. Model for Multivariate tests for all sample stations and seasons of River Benue.
cantly contributed to the model. Wilk’s lambda is another measure of a parameter’s potential before the model is created; smaller values indicate the parameter is better at discriminating between groups. Table 4 suggests that the parameter’s discriminating ability be ranked from the highest to the lowest as listed: hardness, TS, TSS, TDS, temperature, BOD, pH, alkalinity, COD, Cl–, turbidity,  , EC and DO.
Tables 5 and 6 shows Fisher’s linear discriminate functions coefficient and Eigen-values for discriminate functions for the three seasons, respectively. Two discriminate functions were obtained and the total variance cumulative was 100% between seasons. The first function explained 64.8% of the total variance between seasons while the second function explained 35.2% (Table 6).
Wilk’s lambda is a measure of how well each function separates cases into groups. It is equal to the proportion of the total variance in the discriminate scores not explained by differences among the groups. Smaller values of Wilk’s lambda tests indicate greater discriminatory ability of the function. The small values of Wilk’s lambda of 0.043 and 0.264 for discriminate functions 1 and 2 respectively (Table 7), shows that very small portions of the discriminate scores were not explained by the differences among the seasons.
The associated chi-square statistic in Table 7, test the hypothesis that all the means of the functions listed (that
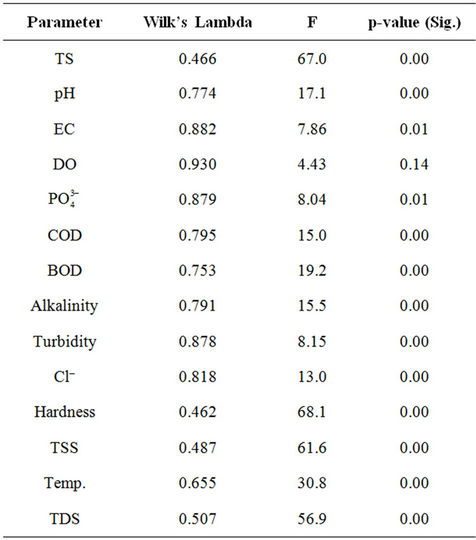
Table 4. Tests of equality of group means.
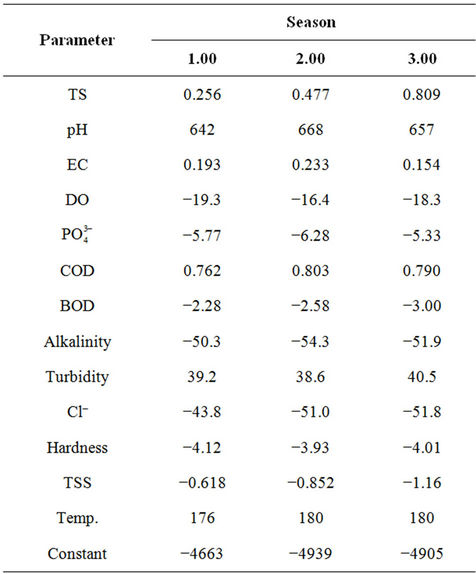
Table 5. Fisher’s linear discriminate function coefficients for the seasons.
is functions 1 and 2) are equal across groups (seasons 1 to 3). The small p-value (sig) of 0.00 for each function indicates that the discriminate functions do better than chance at separating the seasons. Table 5 shows the
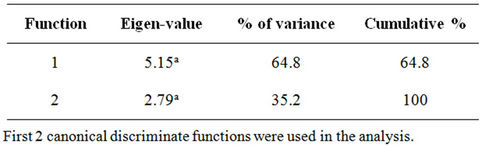
Table 6. Eigen-values for discriminate functions for three seasons.
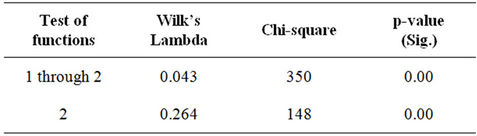
Table 7. Wilk’s Lambda test of discriminate function for temporal variation of the River.
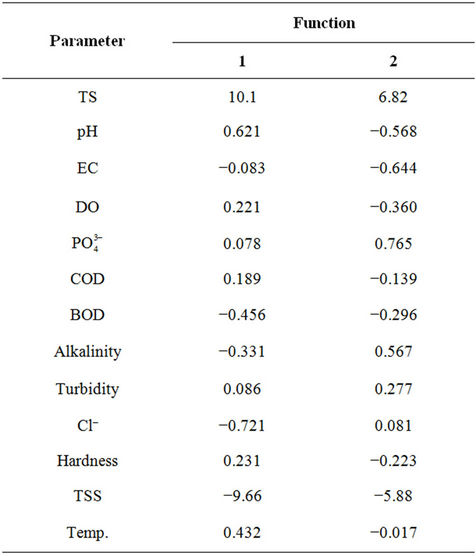
Table 8. Discriminate function coefficient of temporal variation of the River.
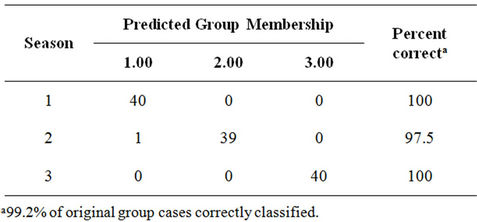
Table 9. Classification results for discriminate analysis of the seasons.
Fisher’s linear discriminate function coefficient which can be used for predicting the likely season a particular water sample was collected in the Makurdi metropolitan area given the concentration of the parameters. Temporal variation of the river Benue was also analysed using discriminate functions (Table 8).
The validity of using the discriminate functions for this prediction is certain, as 99.2% of original group cases were correctly classified or predicted (Table 9). The structure matrix (Table 10) shows the correlation of each parameter with the discriminate functions. The ordering of the discriminating ability of the parameters as indicated by the correlations is close to that indicated by using the Wilk’s lambda criteria in Table 4. This is because the structure matrix is unaffected by the co-linearity among the parameters (see Table 11). The discrepancies observed when using the table of standardized discriminate functions coefficient (Table 8) in ranking the discriminating ability of the parameters in the model when compared with those indicated by the Wilk’s lambda criteria in Table 4, is obviously due to the existing co-linearity among parameters which would have inflated the discriminating ability of some of these parameters. We therefore, recommend the use of the structure matrix of the two discriminate functions in ranking the discriminating ability of the River Benue water quality measuring parameters in the Makurdi metropolitan area. The ranking according the structure matrix from the highest to the lowest discriminating ability of the parameters is TS, TSS, hardness, TDS, temperature, BOD, alkalinity,  , COD, pH, Cl–, turbidity, EC and DO using both discriminant functions.
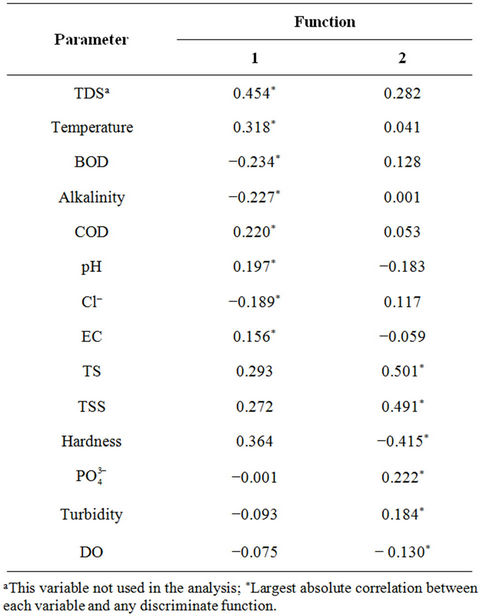
Table 10. Structure Matrix of each parameter with the discriminate functions.
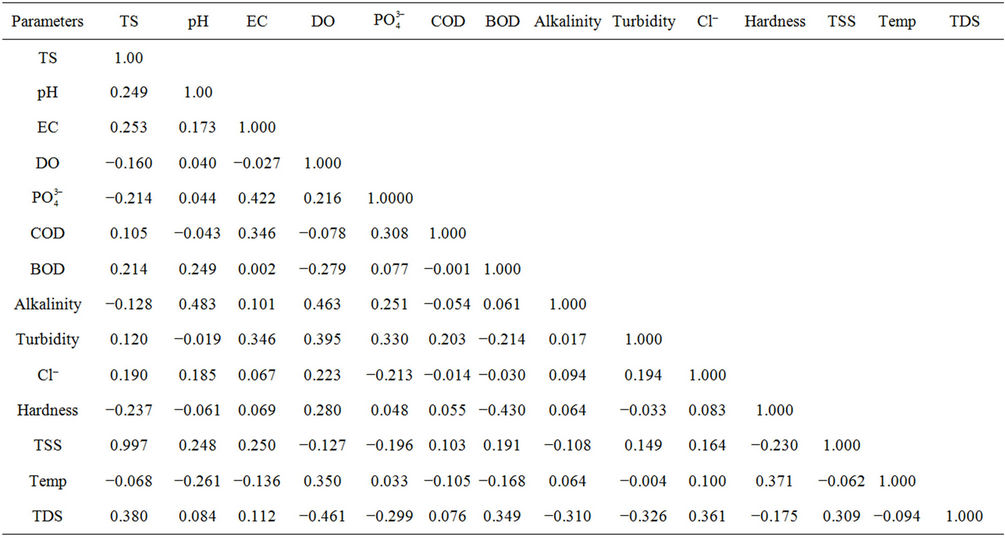
Table 11. Correlation coefficient matrix for water quality parameters.
4. Conclusion
Multivariate statistical techniques were used to examine spatial and temporal variations in water quality of River Benue in the Makurdi metropolitan area in Central Nigeria. Discriminate analysis on station shows that there is no significant difference between the stations investigated but there is on seasons. Fourteen parameters discriminate between the three seasons with 99.2% correct assignations. This suggests that the anthropogenic activities, mainly the discharge of effluents from industries, run-off from agricultural farm land and wastewater from residential areas into the river account for the observed variability in the water quality (especially with respect to TS, pH,  , and alkalinity).
5. Acknowledgements
The authors wish to thank Tsavkegh Benjamin Hilekaan and Nathaniel Yakubu for their assistance in sampling, Pastor I. Gundu (NARICT) for AAS analysis. Finally, we also appreciate the various comments/suggestions of the anonymous reviewers.
REFERENCES
- G. F. Riedel, S. A. Tvvilliams, G. S. Riedel, C. C. Oilmour and G. T. Sanders, “Temporal and Spatial Patterns of Trace Elements in the Patuxent River: A Whole Watershed Approach,” Estuaries, Vol. 23, No. 4, 2000, pp. 521-535. doi:10.2307/1353143
- H. Gupta and G. T. Chakrapani, “Temporal and Spatial Variations Is Water Flow and Sediment Load in Namada River Basin, India: Natural and Man-Made Factors,” Environmental Geology, Vol. 48, No. 4-5, 2005, pp. 579- 589. doi:10.1007/s00254-005-1314-2
- A. Sileika, P. Lnacke, S. Kutra, K. Gaigals and L. Beranjiene, “Temporal and Spatial Variation of Nutrient Levels in the Nemunas River (Lithuania and Belarus),” Environmental Monitoring Assessment, Vol. 122, No. 1-3, 2006, pp. 335-354. doi:10.1007/s10661-006-9186-9
- S. K. Sundaray, U. C. Panda, B. B. Nayak and D. Bhatta, “Multivariate Statistical Techniques for the Evaluation of Spatial and Temporal Variations in Water Quality of the Mahanadi River—Estuarine System (India) a Case Study,” Environmental Geochemistry Health, Vol. 28, No. 4, 2006, pp. 317-330. doi:10.1007/s10653-005-9001-5
- S. C. Schaefers and M. Alber, “Temporal and Spatial Trends in Nitrogen and Phosphorus Inputs to the Watershed of the Altamaha River, Georgia, USA,” Biogeochemistry, Vol. 86, No. 3, 2007, pp. 231-249. doi:10.1007/s10533-007-9155-6
- A. Quadir, R. N. Malik and S. Z. Hussain, “Spatio-Temporal Variations in Water Quality of Nullah Aik-Tributary of the River Chenab, Pakistan,” Environmental Monitoring Assessment, Vol. 140, 2007, pp. 1-3.
- P. R. Kannel, S. Lee, S. R. Kanel, S. P. Khan and Y. Lee, “Spatial-Temporal Variation and Comparative Assessment of Water Qualities of Urban River System: A Case Study of the River Bagmati (Nepal),” Environmental Monitoring Assessment, Vol. 129, No. 1-3, 2007, pp. 433- 459. doi:10.1007/s10661-006-9375-6
- Sh. Najafpour, A. F. M. Alkarkhi, M. O. A. Kadir and Gh. D. Najafpour, “Evaluation of Spatial and Temporal Variation in River Water Quality,” International Journal of Environmental Research, Vol. 2, No. 4, 2008, pp. 349- 358.
- R. Nikhil and P. A. Azeez, “Spatial and Temporal Variation in Surface Water Chemistry of a Tropical River, the River Bharathapuzha, India,” Current Science, Vol. 96, No. 2, 2009, pp. 245-250.
- M. Vegal, R. Pardo, E. Barrado and L. Deban, “Assessment of Seasonal and Polluting Effects on the Quality of River Water by Exploratory Data Analysis,” Water Research, Vol. 32, No. 12, 1998, pp. 3581-3592. doi:10.1016/S0043-1354(98)00138-9
- J. Y. Lee, J. Y. Cheon, K. K. Lee, S. Y. Lee and M. H. Lee, “Statistical Evaluation of Geochemical Parameter Distribution in a Ground Water System Contaminated with Petroleum Hydrocarbons,” Journal of Environmental Science Technology, Vol. 2, No. 1, 2001, pp. 41-47.
- R. Reghunath, T. R. S. Murthy and B. R. Raghavan, “The Utility of Multivariate Statistical Techniques in HydrogeoChemical Studies: An Example from Karanataka, India,” Water Research, Vol. 36, No. 10, 2002, pp. 2437-2442. doi:10.1016/S0043-1354(01)00490-0
- V. Simeonov, P. Simeonova and R. Tisitouridou, “Chemometric Quality Assessment of Surface Water: Two Case Studies,” Chemical Engineering Ecology, Vol. 11, No. 6, 2004, pp. 449-469.
- American Public Health Association, American Water Works Association and Water Pollution Control Federation, “Standard Method for Examination of Water and Waste Water,” 18th Edition, Washington DC, 1992, pp. 3-100.
NOTES
*Part 4 in the series of chemicals in River Benue.
#Corresponding author.