Smart Grid and Renewable Energy
Vol.2 No.3(2011), Article ID:6595,7 pages DOI:10.4236/sgre.2011.23033
Notice on a Case Study on the Utilization of Wind Energy Potential on a Remote and Isolated Small Wastewater Treatment Plant
![]()
1Ddepartment Engª Química, Instituto Superior de Engenharia de Lisboa, Lisboa, Portugal; 2Ddepartment Engª Química e Biológica, Instituto Superior Técnico, Lisboa, Portugal; 3Sustainable Development, Instituto de Soldadura e Qualidade, Porto-Salvo, Portugal.
Email: jgomes@deq.isel.ipl.pt
Received December 13, 2010; revised May 23, 2011; accepted May 30, 2011.
Keywords: Wind Energy, Wastewater Treatment Plants
ABSTRACT
Small wastewater treatment plants (WWTP) are frequently located, by necessity, in remote and isolated sites, which increases the difficulty of its energy supply. Some of them are located near the seaside, in environmental sensible zones, and due to tourism activity of these sites, seasonal effects related with population size fluctuation can occur, which can originate certain inefficiencies concerning WWTP design and energy supply. The objective of this paper is to describe a step by step procedure for evaluation of the wind potential of sites that are dependent of in-situ energy generation, as well as, a case study on the utilization of the potential wind energy in Magoito WWTP (5000 p.e.). The employed methodology comprised the collection of one year of in-situ wind data and its validation by comparison with historical data of about 10 years of a nearby anemometric station. The data provided by the two anemometric stations was statistically treated. It allowed the analysis of the results from the two stations are promissory in terms of wind availability and velocity. Finally, it comprised the simulation of the local wind conditions for a considerable larger area in order to find the best site for locating a wind turbine.
1. Characterisation of Magoito WWTP Anemometric Station
Small wastewater treatment plants (WWTP) are frequently located, by necessity, in remote and isolated sites, which increases the difficulty of its energy supply. Some of them are located near the seaside, in environmental sensible zones, and due to tourism activity of these sites, seasonal effects related with population size fluctuation can occur, which can originate certain inefficiencies concerning WWTP design and energy supply [1].
The studied WWTP is located in Magoito, Sintra, district of Lisbon, Western Portugal, near the seaside, as shown in Figure 1. This WWTP has an anemometric station with 1 anemometer to measure the wind speed and one sensor for direction, which are installed in a stand at a height of 2.5 meters from the ground, in the highest terrain inside this WWTP perimeter.
In the field, the anemometric station is situated in a small valley, bordered by hills at North and South. The respective geographic coordinates are UTM (ED50 and 29S) 461411.64 and 4301908.35 at 20 meters above sea level. The terrain roughness is considerable small, the main vegetation is low and only by North some small dispersed trees exist, without the occurrence of any significant nearby obstacle which could be sheltering the anemometric station, as shown in Figures 2 and 3.
The data collected by the equipment was obtained from June 2006 to June 2007. The obtained measurement were the daily average wind speed and the direction sensor output according to sixteen directions (N, NEW, NE, ENE, etc.) [2].
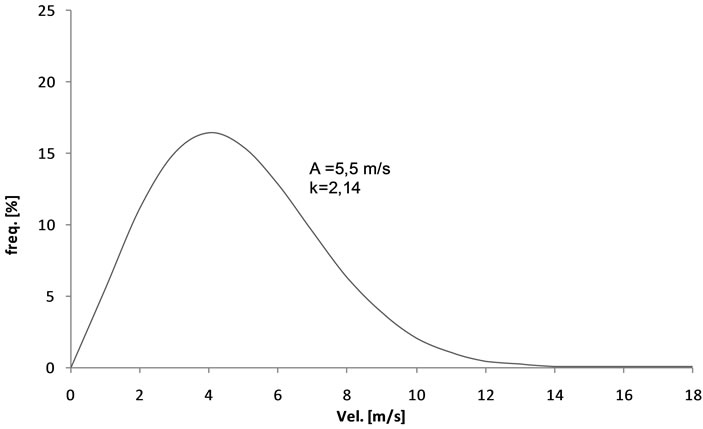
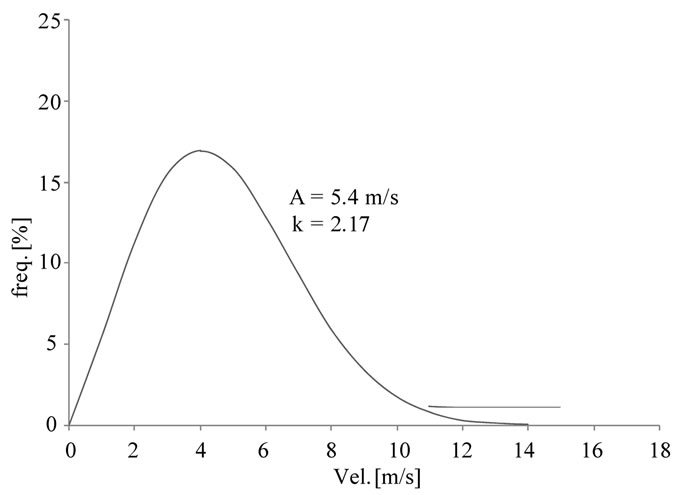
The global results of the statistic data calculations are shown in Figures 4 and 5. Figure 4 shows the wind roses and Figure 5 shows the wind speed data, the wind class histogram and the corresponding Weibull distribution function of the reference anemometric station. The majority of wind speed lies in the range 2.1 - 8.8 m/s with an average value of 4.9 m/s.
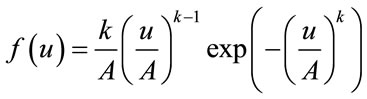
Normally, the presentation data of wind speed classes is made by a Weibull distribution, which is a function representing the wind speed histograms in a compact
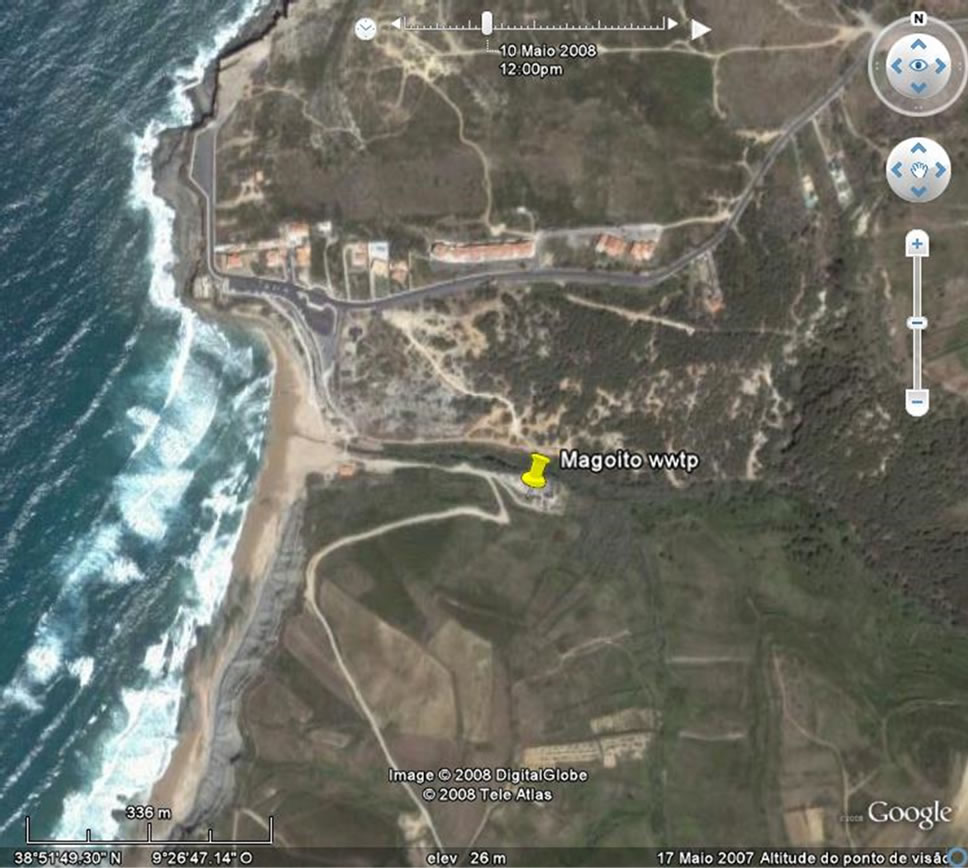
Figure 1. Satellite view of Magoito WWTP where the anemometric station is located (source: Google Earth).
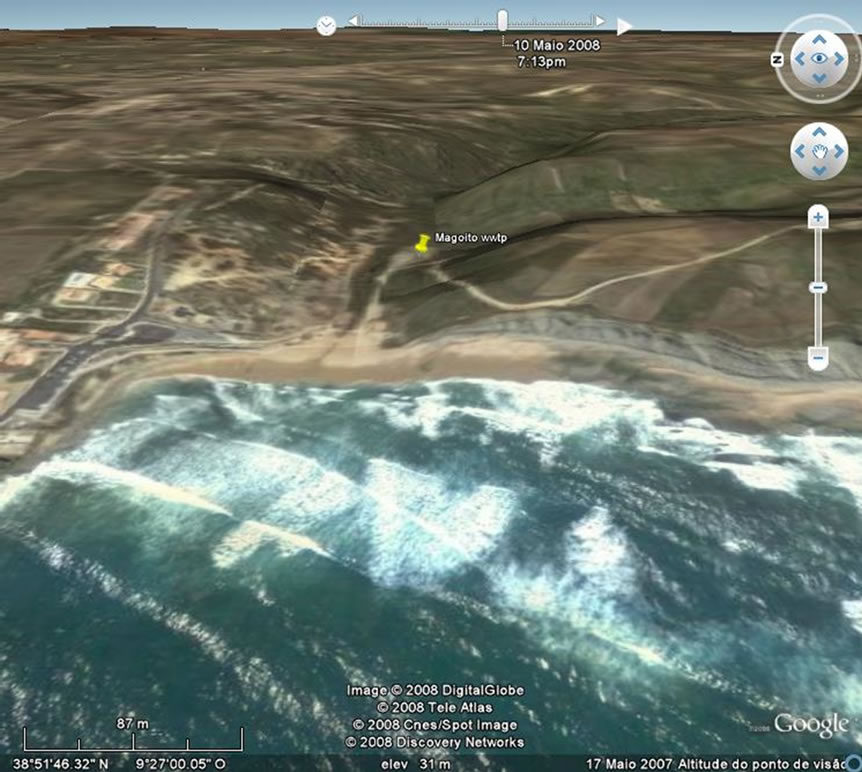
Figure 2. 3D view of the site (facing East), (source: Google Earth).
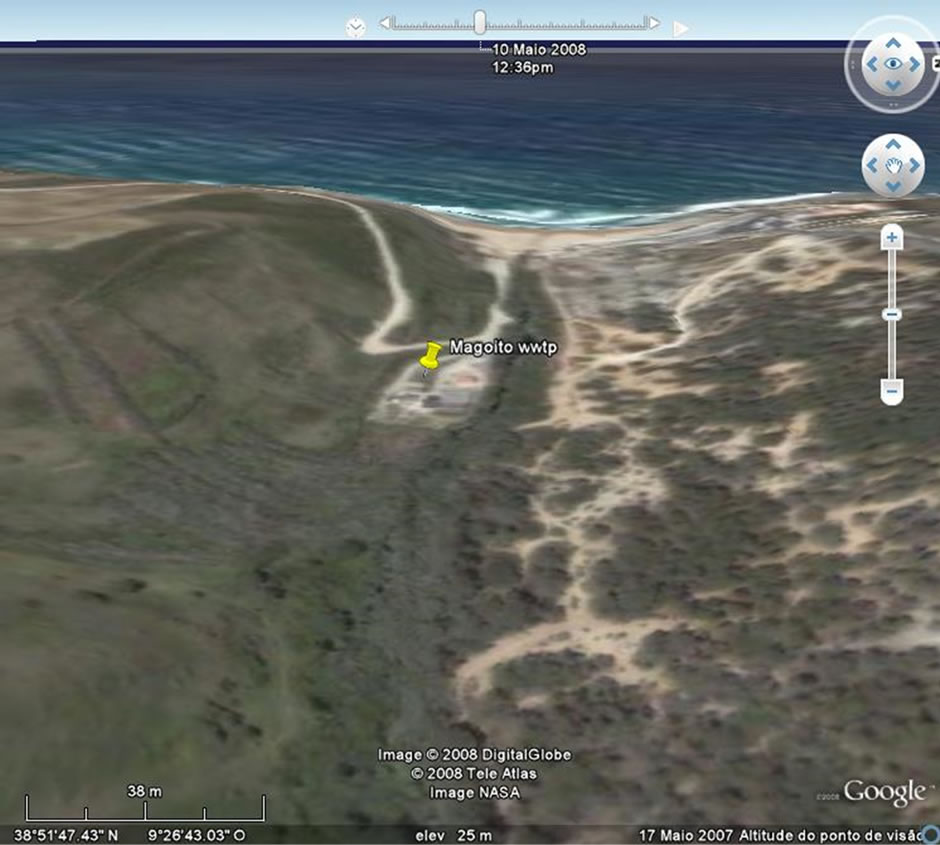
Figure 3. 3D view of the site (facing West), (source: Google Earth).
form. The two-parameter Weibull distribution function is expressed mathematically as:
 Equation (1)
where f(u) is the frequency of occurrence of wind speed (u), (A) is a scale parameter which is related to the mean value of the wind speed and (k) is a shape parameter which determines the shape of the Weibull curve (the higher (k) values more narrow is the curve).
As previously mentioned, the anemometric station is located in a valley and the data is considerably influenced by this fact, as shown in Figure 4. Due to its geographic orientation, almost all wind direction shown in the wind rose is coincident along the valley. Additionally, it only has daily average values available for a period of a year and the height of the anemometer is 2.5 meters above the ground. This anemometric station is not suitable to be used for extrapolating results of the wind speed in the nearby sites, but is valid in what concerns the local situation.
This station should not be used as reference because of the above mentioned reasons. Nevertheless, the results from this analysis are quite promising since the values of wind speed obtained by the anemometer, at such small height above the ground, reveals that this site could be suitable for wind power production.
2. Characterization of the Reference Anemometric Station
There is another anemometric station nearby Magoito WWTP, about 5 km in East direction, currently working for more than 10 years that will be used as the reference station for this study. The available data is composed by 10 minutes average of wind speed and wind direction at 10 meters height above the ground. It is situated in a very small hill, the vegetation around have reduced high, with disperse small trees and farm houses nearby. In addition, there are no significant obstacles, and the terrain does not has a complex topography. The data of the reference station is shown, after statistic calculations, in Figures 6 and 7 was used to extrapolate the wind speed for the map previous presented.
The wind rose indicates that the main directions of the wind are from Northwest which is typical of Portugal West coast, as can be seen in Figure 6. Figure 7 shows the wind speed data, the wind class histogram and the corresponding Weibull distribution function of the reference anemometric station. The majority of wind speeds
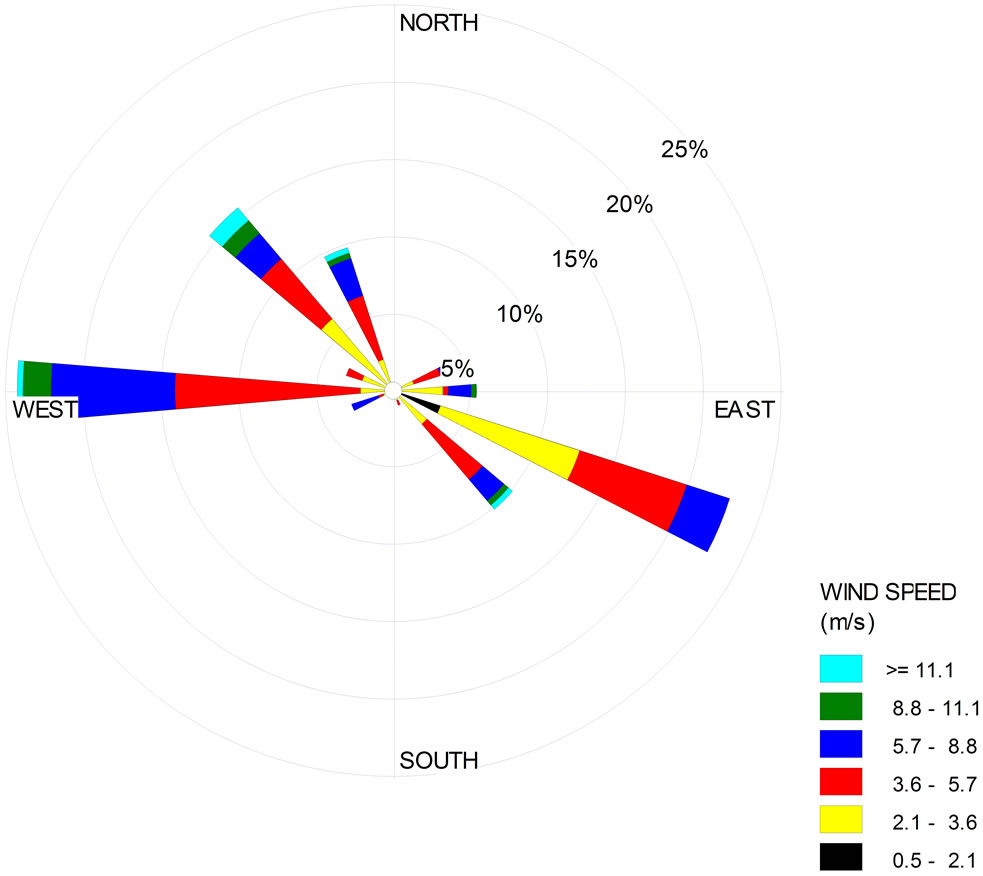
Figure 4. Wind rose of the Magoito WWTP anemometric station.
 (a)
(a)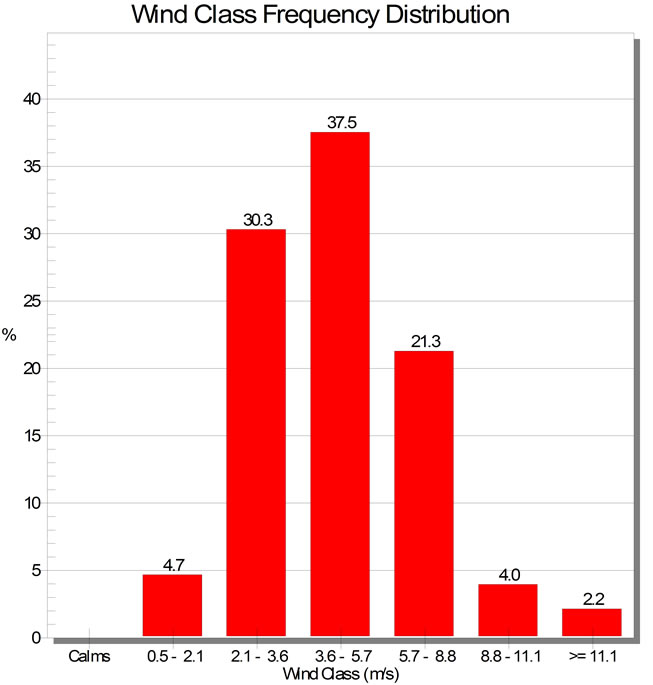 (b)
(b)
Figure 5. Wind speed data of Magoito WWTP anemometric station. (a) wind class histogram; (b) Weibull distribution function.
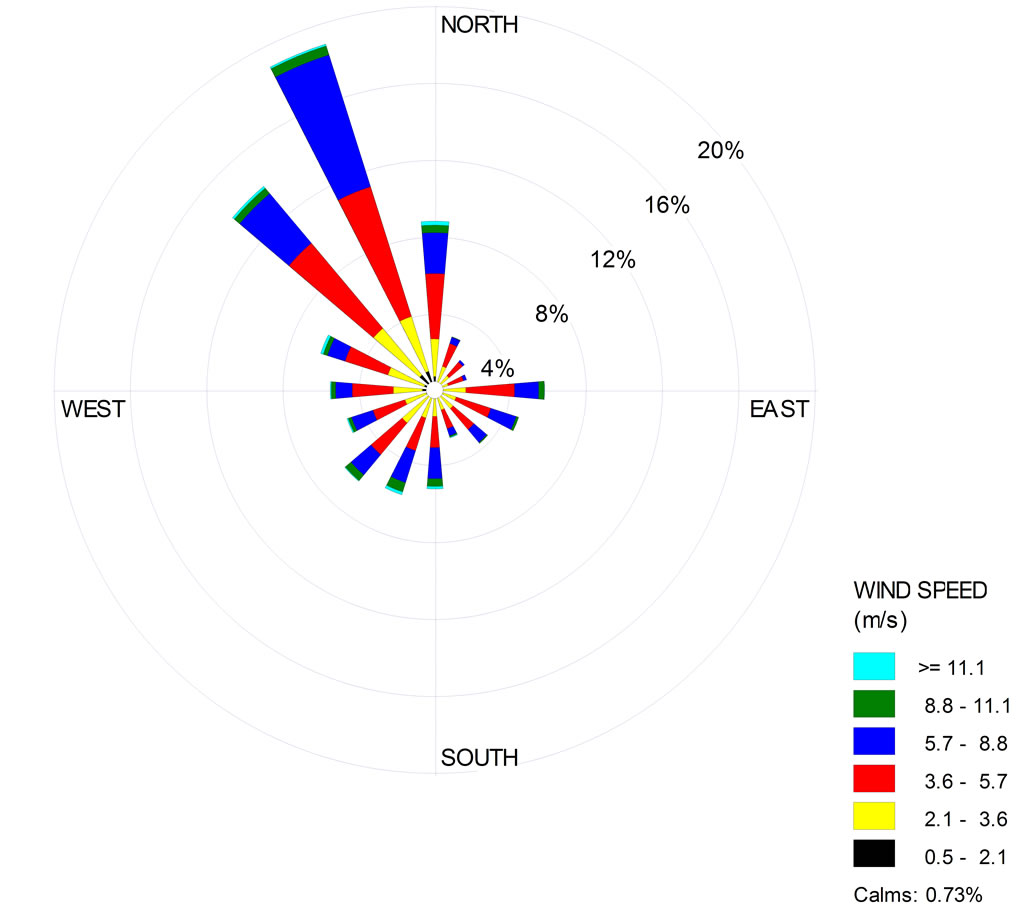
Figure 6. Wind rose of the reference anemometric station.
 (a)
(a)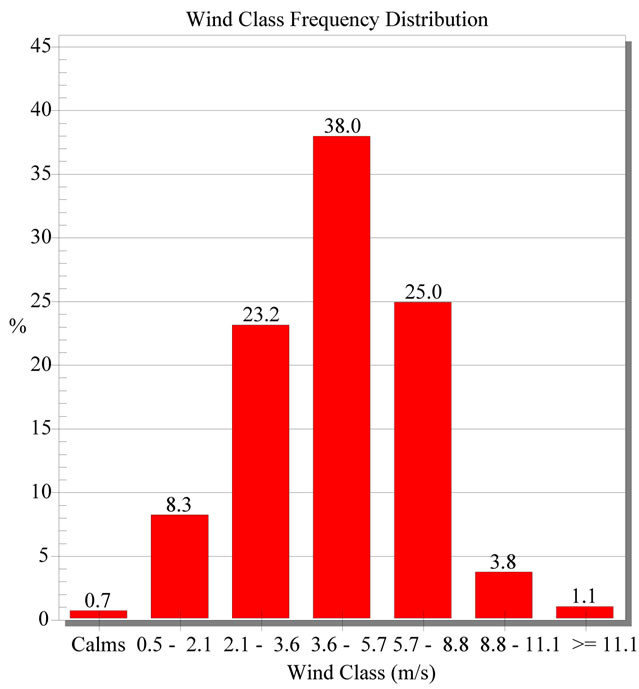 (b)
(b)
Figure 7. Wind speed data of the reference anemometric station. (a) wind class histogram; (b) Weibull distribution function.
are ranging 2.1 to 8.8 m/s with an average value of 4.7 m/s.
3. Results and Discussion
The wind speed map for Magoito beach was obtained using the commercial simulation software Wasp for a 10 meters space grid in each direction and at a height of 50 meters above the ground, as shown in Figure 8. The data used to obtain the local Wind Atlas was obtained from the reference anemometric station characterized previously, and the digital map was obtained from the Army Geographic Institute [3] with an area of 7 × 11 km2, and with 10 meters levels of altimetry lines.
Figure 8 shows a region with a very high average wind speed for production of electrical energy with wind turbines, especially in the top of the small hill. These results are, in fact, not surprising, since this region is known for its strong winds for long and, normally, comes from the Northwest direction.
For a wind turbine site, which could be a source of
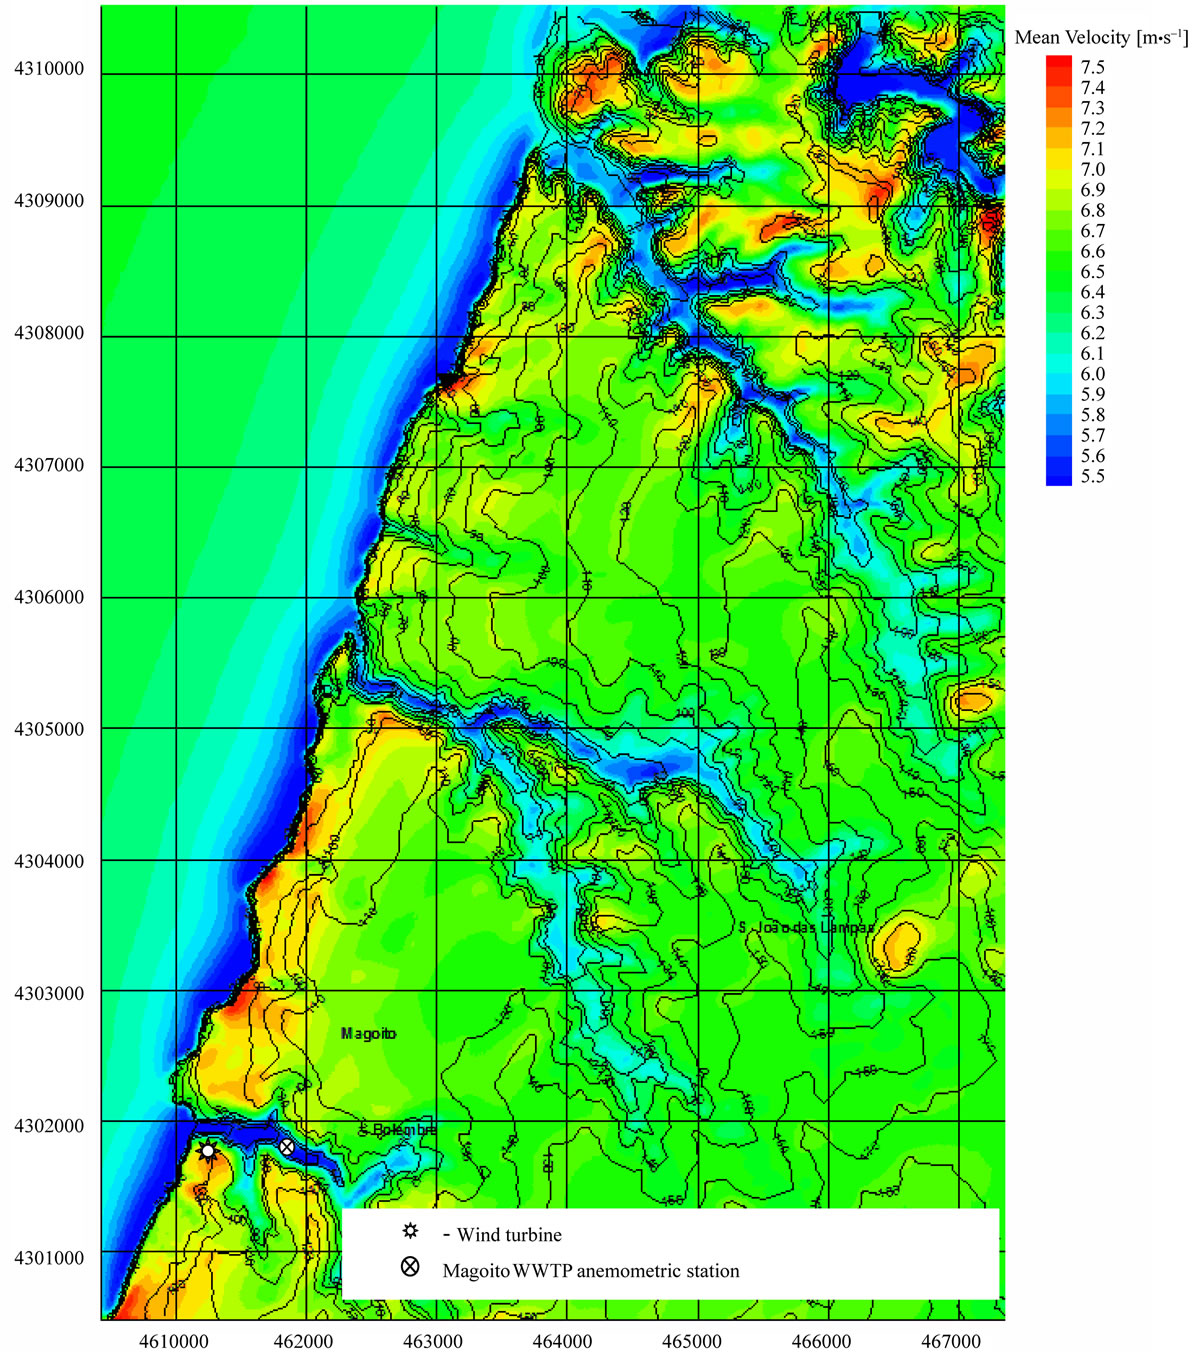
Figure 8. Wind velocities map at a height of 50 meters above the ground (UTM ED50 S29 coordinates) (source Wasp).
electric energy to supply not only Magoito WWTP (0.15 GWh per year) but also to nearby infrastructures, the small hill in South direction, located close to the WWTP with the UTM (ED 50 29S) coordinates 461374.01 and 4301619.38, is a very strong possibility. A wind turbine with a rated power output of 330 kW and has 50 meters tower and 33.4 meters of rotor diameter, is appropriate for the studied case. This site, where the wind turbine is located in the map, has an average wind speed of 7.2 m/s. Having this configuration the wind turbine output is, a gross production of electrical energy of 1.069 GWh per year, which is equivalent to 3240 hours of production per year, accordingly to Wasp software simulation.
4. Conclusions on the Wind Potential
The obtained results are very encouraging as to explore the wind power energy locally. However, it should be noted that the obtained results are mainly guideline values and could have some uncertainty because of the errors associated with the extrapolation concerning the reference station data extrapolation. As previously described, the anemometric station is located at 5 km distance of the wind turbine site and the height is not the same, 10 meters for station anemometer above the ground and wind turbine rotor is at 50 meters above the ground. Nevertheless, there is no doubt that the region is quite good for wind energy applications.
For a similar project to be implemented, it is recommended to install a 50 meters height above the ground anemometric station (preferably at the same height of the wind turbine rotor) in the same location of the future wind turbine, at least for 6 months. This data is essential to validate the preceding results for development of the project also for financial base analyses.
REFERENCES
- P. Cardoso, “Waste Water Treatment State-of-Art and Innovation in Partner States,” Waste Water Treatment Improvement and Efficiency in Small Communities, Report: LIFE04 ENV/PT/000687, Oeiras, Portugal, ISQ, 2005.
- P. Cardoso, “Wind Potential Availability at Magoito WWTP,” Waste Water Treatment Improvement and Efficiency in Small Communities, Report: LIFE04 ENV/PT/ 000687, Oeiras, Portugal, ISQ, 2007.
- Digital Map of Portugal, IGeoE, Lisboa, Portugal, 2005.