Energy and Power Engineering
Vol.4 No.6(2012), Article ID:25084,10 pages DOI:10.4236/epe.2012.46063
Power Analysis for Piezoelectric Energy Harvester
Electrical Engineering Department, King Saud University, Riyadh, KSA
Email: wahied@ksu.edu.sa, suibrahim@ksu.edu.sa
Received September 24, 2012; revised October 29, 2012; accepted November 7, 2012
Keywords: Vibration; Energy Harvesting; Piezoelectric Materials; Power Analysis; Resonant Frequency
ABSTRACT
Piezoelectric energy harvesting technology is used to design battery less microelectronic devices such as wireless sensor nodes. This paper investigates the necessary conditions to enhance the extracted AC electrical power from exciting vibrations energy using piezoelectric materials. The effect of tip masses and their mounting positions are investigated to enhance the system performance. The optimal resistive load is estimated to maximize the power output. Different capacitive loads are tested to store the output energy. The experimental results validated the theoretical analysis and highlighted remarks in the paper.
1. Introduction
Energy harvesting technology is used to generate electrical power from natural (green) energy sources. The concept of energy harvesting generally relates to the process of using ambient energy, which is converted into electrical energy. Research on energy harvesting technology became progressively larger over the last decade to design self-powered microelectronic devices. With the advances being made in wireless technology and low power microelectronics, wireless sensors are being developed and can be placed almost anywhere. Wireless sensor networks are progressively used in many applications such as: structure health monitoring, automation, robotics swarm, and military applications. However, these wireless sensors require their own power supply which in most cases is the conventional electrochemical battery. Once these finite power supplies are discharged, the sensor battery has to be replaced. The task of replacing the battery is tedious and can be very expensive when the sensor is placed in a remote location. These issues can be potentially alleviated through the use of power harvesting devices.
One of typical wasted energy is an ambient vibration that presents around most of machines and biological systems. This source of energy is ideal for the use of piezoelectric materials, which have the ability to convert mechanical strain energy into electrical energy and vice versa [1]. In general, there are three techniques to harvest the energy from the vibration: electrostatic, electromagnetic, and piezoelectric. Piezoelectric materials have a superior performance to be used for energy harvesting from ambient vibrations, because they can efficiently convert mechanical strain to an electric charge without any additional power and have a simple structure for real time applications [2,3].
In general, a piezoelectric energy harvesting can be represented as shown in Figure 1. The mechanical energy (e.g., applied external force or acceleration) is converted into mechanical energy in the host structure. Then, this energy is converted into electrical energy by the use of piezoelectric material, and is finally transferred into electrical form to a load and/or a storage stage [4]. Therefore, three basic processes are performed: conversion of the input energy (vibration) into mechanical energy (strain) using a cantilever structure, electromechanical conversion using piezoelectric material, and electrical
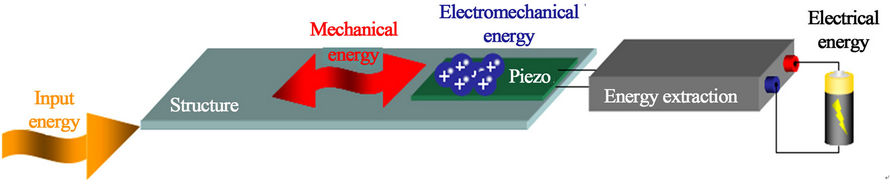
Figure 1. Schematic diagram of piezoelectric energy harvester [4].
energy transfer. In the literature, several books are recently published in this research domain [5-8]. Several review papers are also published in all different aspects concerning energy harvesting technologies [9-15].
This paper investigates the necessary conditions to enhance the extracted AC electrical power from the exciting vibration energy using piezoelectric material. This paper is organized as follows: the next section presents theoretical background to maximize the generated electrical power. Section 3 describes the experimental setup to carry out the real time measurements. Section 4 discusses the experimental results; while the last section concludes the paper and highlights the future research directions in this field.
2. Theoretical Background
The piezoelectric effect is a direct transformation of mechanical energy into electrical energy. Piezoelectricity was discovered by Jacques Curie and Pierre Curie in 1880 [16-18]. They observed that certain crystals respond to pressure by separating electrical charges on opposing faces and named the phenomenon as piezoelectricity. In the literature, several design parameters have been investigated to maximize the generated power from mechanical vibrations to electrical output using piezoelectric material. These parameters are summarized as follows [1,3]:
Material type as PZT, PVFD, Quick-Pack, and PVFD. Material with high quality factor (Q-factor) produces more energy and recently piezoelectric micro fiber composite (MFC) has more efficiency to generate electrical power up to 65% of the input mechanical energy.
Geometry, tapered form produces more energy while the strip form is commercially available.
Thickness, thin layers produce more energy.
Structure, bimorph structure doubles the output than unimorph structure.
Loading mode, d31 produces large strain and more energy for small applied forces.
Resonant frequency has to be matched with the fundamental vibration frequency.
Electrical connection, parallel (to increase the output current) and series (to increase the output voltage source).
Fixation, cantilever produces more strain than simple beam.
Load impedance, it has to be matched with the piezoelectric impedance at the operating frequency.
In this paper, the development is focused on the necessary conditions to maximize the AC power output from the piezoelectric harvester using MFC material with fixed dimensions. The piezoelectric harvester is a cantilever with an effective length (Lb) extends from the clamped end to the free end with tip mass (m) as shown in Figure 2. Electrodes must be plated onto the piezoelectric material to collect the generated charges as the beam flexes.
Williams and Yates developed a generic model based on inertial kinetic energy [19]. The model is a lumpedparameter second order dynamic system which relates the input vibration  to the output relative displacement
  (see Figure 3). By applying D’Almbert’s law, the dynamic equation for this system is given as:
 (1)
(1)
where  is the input vibration,
  is the input acceleration,
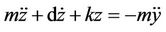
  is the relative displacement of the mass with respect to the vibrating cantilever, k is the spring constant (device stiffness), d is the total damping (parasitic damping and electrical damping), and m is the effective mass of cantilever. The transfer function
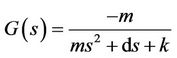
  for this system is given as:
 (2)
(2)
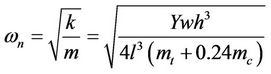
Thus natural frequency  is given by
 (3)
(3)
where Y is the young’s modulus, w, h, and l are the width,
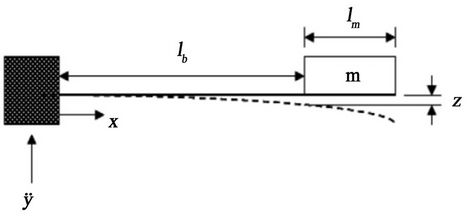
Figure 2. Piezoelectric cantilsever [3].
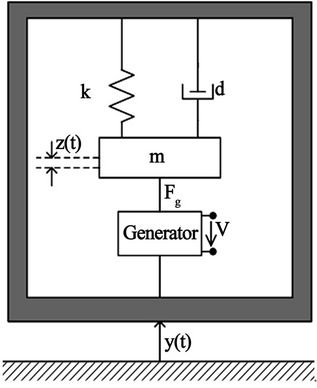
Figure 3. Dynamic model of vibration harvester [19].
the thickness, and the length of the cantilever respectively, mt is the tip mass, and mc is the cantilever’s mass. The total damping factor  (mechanical and electrical) is given by
 (4)
(4)
The total quality factor is given by [3,6]
 (5)
(5)
The quality factor is inversely proportional to the damping factor and can be computed as the ratio between the resonant frequency (fn) and the frequency bandwidth (fbw). For a sinusoidal vibration signal ( ) the instantaneous dissipated power (P) within the damper equals the product of the velocity and the damping force. This power is computed using the following formula [6]:
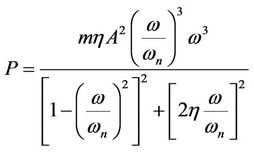 (6)
(6)
where; A is the amplitude of vibration. The maximum power dissipated in the damper occurs at the natural frequency and can be calculated by the following formula:
 (7)
(7)
where; the peak of input acceleration (a) is given by A . Maximum power conversion to electrical domain occurs when the mechanical damping equals the electrical damping. Therefore, the maximum electrical output power is equal to half the value in the Equation (7).
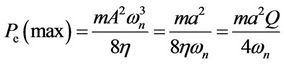 (8)
(8)
The above equation indicates that the maximum power is directly proportional to the effective mass, the input acceleration and the quality factor. Whatever, it is inversely proportional with the natural frequency and the total damping. The piezoelectric cantilever itself can generate output voltage due to the (mechanical strain) relative displacement . The strain effect utilizes the deformation of the piezoelectric material to generate positive and negative charges on both sides. The equivalent electrical circuit can be considered as shown in Figure 4. The piezoelectric harvester has high resistive impedance in mega Ohm and capacitive value in nano Farad. At resonance, the current source is
  equal to
 .
.
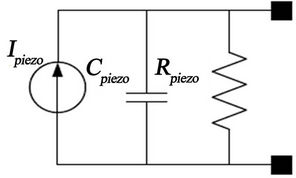
Figure 4. Equivalent circuit at resonance [6].
The harvester’s resistive value could be ignored due to its too high value in mega Ohm, therefore its effective impedance is a capacitive type. This impedance Zi can be computed using the following equation
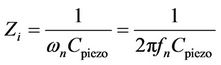 (9)
(9)
The maximum power transfer to the external load occurs when the value of this load is close to the harvester’s internal impedance. To store the energy in a capacitive load, the extracted AC power has to be rectified using a 4 bridge rectifier. The stored energy in the capacitor is given as:
 (10)
(10)
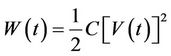
where  is the stored energy in Joule at instant time t, C is the capacitive value in Farad, and
  is the measured voltage across the capacitor at instant time t. The accumulated energy has to be enough to run the load for a pre-defined time. The application run time depends on the consumed current, the output voltage to the load, and the stored energy in the capacitor. The run time of a certain application can be computed by
 (11)
(11)
where W is the stored energy in Joule, V the voltage across the capacitor to the load, and  is the consumed current by application.
3. Experimental Setup
The experimental set-up consists of (see Figure 5):
• Amplifier module to generate the vibration signal at different levels and different frequencies ranged from 5 Hz to 60 Hz with incremental step of 1 Hz;
• Desktop shaker to generate mechanical vibrations;
• Harvester module using a Micro Fiber Composite (MFC) material (M-8528-P2, Smart Material) with dimensions of 8.5 cm × 2.8 cm;
• Variable impedance module (VIM, Smart Material);
• Different capacitors, 22 µF, 470 µF, and 0.1 F;
• NI-PXIe system with DAQ (Data Acquisition) card as a hardware platform;
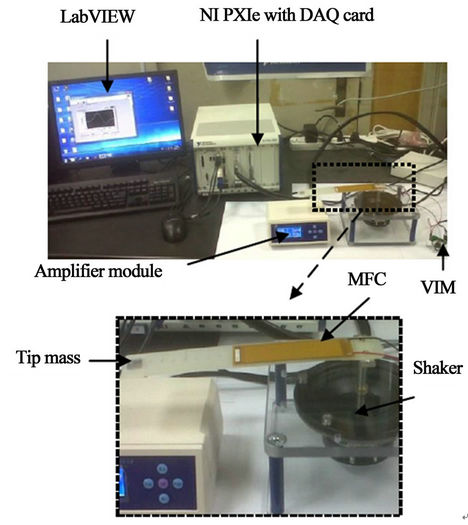
Figure 5. Experimental set-up.
• NI-LabVIEW software for monitoring and analyzing the acquired signals.
The MFC is glued on a flex cantilever substrate that is mounted on a shaker. The dimension of the cantilever is 22 cm × 3.5 cm × 0.1 cm. The shaker is excited by an amplifier module to generate vibrations. Under exciting vibration, the piezoelectric harvester produces AC electrical output. Then, the output signal from the harvester is connected to a variable resistive load or a bridge rectifier with a capacitive load. NI-PXIe with DAQ card is used to perform real time measurements.
The vibration frequency and its excitation level (amplitude) are varied to test the performance of the harvester. The peak-to-peak voltage or maximum power is used to evaluate the system performance. The real time monitoring and analysis for the harvested electrical signal is performed using LabVIEW software. The harvesting cantilever has to be selected with high Q-factor to increase the power output. Higher Q-factor indicates a lower rate of energy loss relative to the stored energy. However, high Q-factor also means narrow operational frequency bandwidth. The harvester produces significant power when it works under excitation frequency that closing to its resonant frequency. The resonant frequency of the harvesting cantilever under a given set conditions is identified experimentally by monitoring the peak of power output. The resonant frequency is changed by adding or removing tip masses. Different tip masses are used to investigate their effect to the resonant frequency. The effect of different mounting positions for this tip mass is also investigated.
The maximum power transfer happens when the load impedance is closely matched with the harvester’s internal impedance. The harvester’s internal impedance is a capacitor type and consequently not only depends on MFC characteristics but also the excitation frequency. The harvester resonant frequency will be investigated firstly to achieve optimal frequency for excitation. Such experiment using maximum power point tracking (MPPT) method will be performed to determine maximum power transfer and its corresponding optimal load. A variable impedance module (VIM) is used as variable resistive load (potentiometer) to change the electrical load easily.
4. Results and Discussion
4.1. Resonant Frequency without Tip Mass
The generated AC electrical power from the piezoelectric harvester has been monitored in real time using LabVIEW software as shown in Figure 6.
The resonant frequency under fixed excitation level (level 2) is identified by monitoring the maximum output power as a function of excitation frequency. The excitation frequency from the amplifier module is varied from 11 to 30 Hz. In this experiment, no tip mass is mounted on the cantilever and the load is fixed to be 50 kΩ. Figure 7 shows the generated power from the harvesting system without tip mass.
It is observed that the resonant frequency of the harvester is 18 Hz (maximum peak of the extracted power). Under this excitation frequency; the power output reached to its maximum value equal to 250 µW. Another local peak is also observed at 23 Hz with lower power output. This phenomenon is commonly known for physical systems, in which such systems have multiple resonant frequency modes due to its flexible structure.
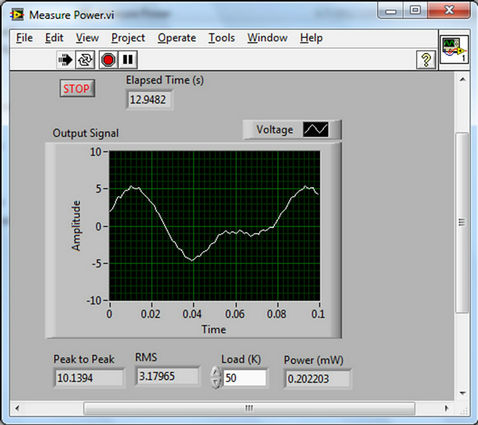
Figure 6. LabVIEW front panel.
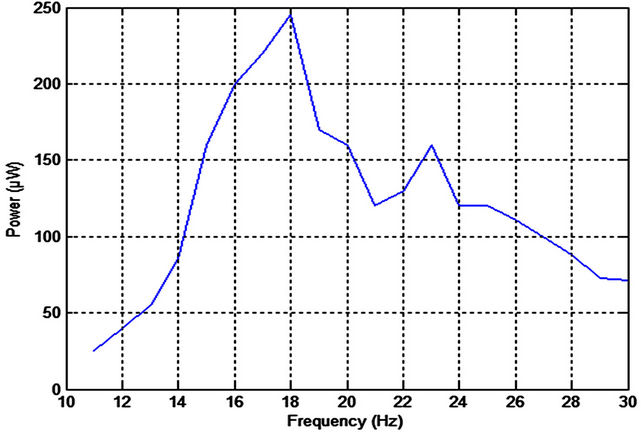
Figure 7. Generated power without tip mass.
4.2. Effect of Tip Masses
From Equation (3), the resonant frequency is inversely proportional to square root of effective mass. Theoretically, increasing cantilever mass will decrease the resonant frequency (nonlinear characteristics). This theoretical result has been validated by experimental work as shown in Figure 8.
The additional masses are varied from 1 to 5 grams were mounted at fixed position 1 cm from the free end of the cantilever with vibration excitation level 2. The resonant frequency is shifted to 17 Hz, 15 Hz, 14 Hz, 13 Hz, and 13 Hz respectively for 1, 2, 3, 4 and 5 gram additional tip mass. In real time applications, this method could be used effectively to tune the resonant frequency if the fundamental frequency of vibration source is pre-determined. It is observed also that the power output increases as the value of tip mass increases that means; the Q-factor is also increased. This result was expected from Equation (8). The generated power is equal to 380 µW by adding 5 grams tip masses (increasing factor by 60%). While, without adding tip masses; the generated power is equal to 245 µW.
High Q-factor also means narrow operational frequency bandwidth. Although, with 5 gram additional tip mass; the harvester is able to produce maximum power, its frequency bandwidth is too narrow. With resonant frequency at 13 Hz, a slightly deviation from this frequency causes significant degradation in performance of the harvester. Another secondary peak is also observed at 27 Hz with lower power output. As noted earlier, this phenomenon is commonly known for physical systems, in which such systems have multiple resonant frequency modes due to its flexible structure. Table 1 summarizes the complete results for these experiments.
4.3. Effect of Mounting Positions for Tip Mass
Resonant frequency of a cantilever depends on its effective mass rather than its total mass. Two cantilevers with similar material and mass but with different shape or mass density distribution will have distinct resonant frequency. The closer the center of gravity to the free end of the cantilever, the greater the effective mass is achieved, and hence the lower resonant frequency. Figure 9 shows the experiment results using 3 grams tip masses at different mounting positions on the cantilever with vibration excitation level 2.
The mounting position of tip mass is varied from 1 to 7 cm from the free end of the cantilever. The resonant frequencies are 14, 15, 15, and 16.5 Hz respectively for 1, 3, 5, and 7 cm mounting positions. Table 2 summarizes the complete results for these experiments.
4.4. Optimal Resistive Load
As noted earlier, the maximum power transfer can be extracted when the load impedance is closed to the harvester’s internal impedance. Due to high resistive value for piezoelectric material, the internal impedance could be simplified as capacitive type. From the datasheet, the internal capacitance for the MFC is equal to 172 nF; this value has been also checked using a high sensitivity capacitance meter. To investigate optimal load for the harvester, no mass is mounted on the cantilever and the harvester is excited at its resonant frequency (18 Hz). By using Equation (9), the internal impedance (Zi) is computed as follows:
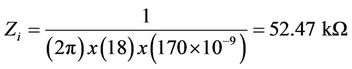
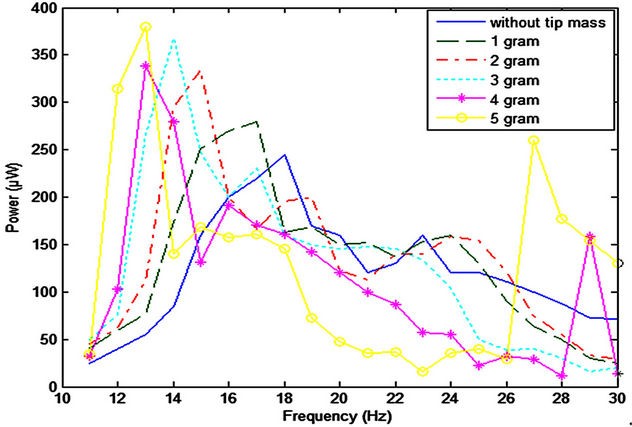
Figure 8. Generated power with different tip masses.
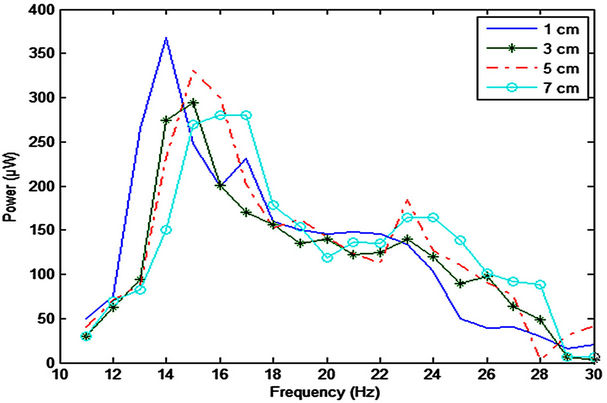
Figure 9. Generated power with different mounting positions.
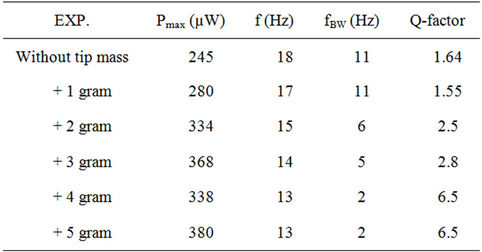
Table 1. Experiment for different tip masses.
The harvester is predicted to generate maximum output power when the (external) load is closed to the above value. The variable impedance module (VIM) is varied from 0 Ω to 500 kΩ, the extracted power output is shown
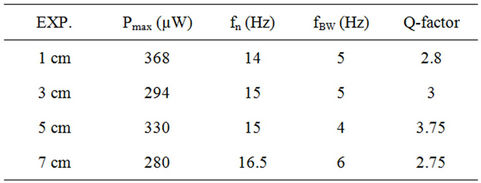
Table 2. Experiment results for mounting positions.
in Figure 10. The maximum power is obtained at 50 kΩ, which is close to the harvester’s internal impedance.
The upper curve in Figure 10 represents the AC power from the piezoelectric material; while the lower curve represents the rectified power using diode-bridge. The difference between the two curves is due to the power loss in the rectifier circuit. The maximum power for the both curves is obtained at the same value of the resistive load.
4.5. Capacitive Load to Store the Energy
After rectifying the AC voltage, the extracted power is stored in a capacitor. Three different capacitors are tested for charging characteristics: 22 µF (10 V maximum voltage), 470 µF (25 V maximum voltage), and 0.1F (5.5 V maximum voltage). Figures 11-16 show the measured output voltage and the corresponding stored energy for each capacitor.
The charging process for small capacitors (22 µF and 470 µF) was very fast. The output voltage was increased to more than 3.3 V which is a practical value for low power microcontroller applications. The third capacitor is too large (0.1 Farad), it takes long time for charging process but it can store more energy which is more practical to run the real time application. The chattering effect in Figures 15 and 16 is due to the large time constant with respect to the periodic variations in the bridge circuit. It can be easily eliminated by stabilizing the output voltage from the bridge circuit.
5. Conclusions and Future Directions
Piezoelectric energy harvesting is a promising avenue of research to develop self powered microelectronic devices. Wireless remote monitoring of mechanical structures, low power wireless sensors, and biomedical sensors are strongly candidates for piezoelectric energy harvesting applications. The piezoelectric energy harvester has a limited power and the optimization to extract maximum power in the whole stages is needed to enhance the device performance. The maximum (mechanical/electrical) power transfer depends on piezoelectric material properties and other matching operating conditions. In this paper, the experimental results validated the theoretical analysis to enhance the system. The experimental results highlighted the following points:
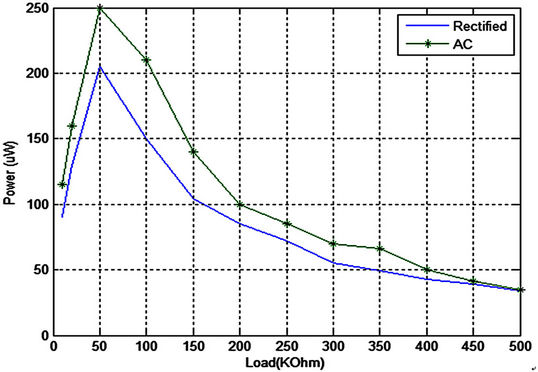
Figure 10. Output power with different external load.
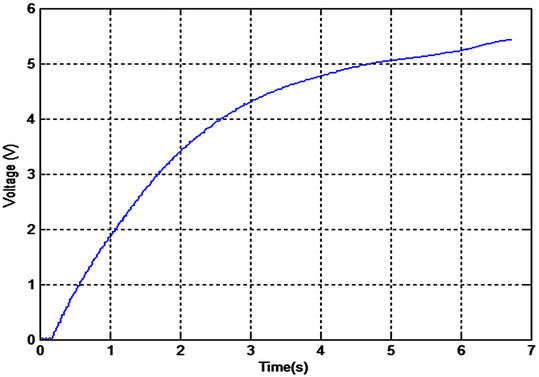
Figure 11. Output voltage using 22 µF capacitor.
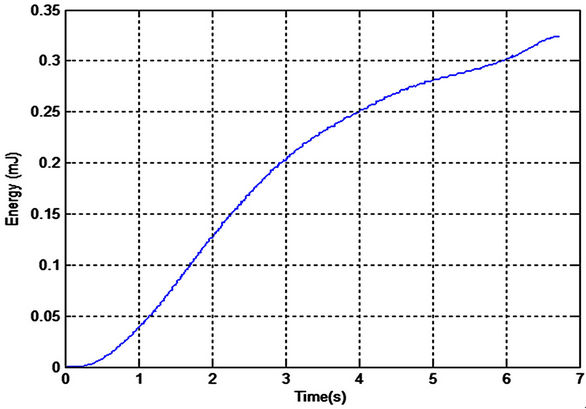
Figure 12. Stored energy using 22 µF capacitor.
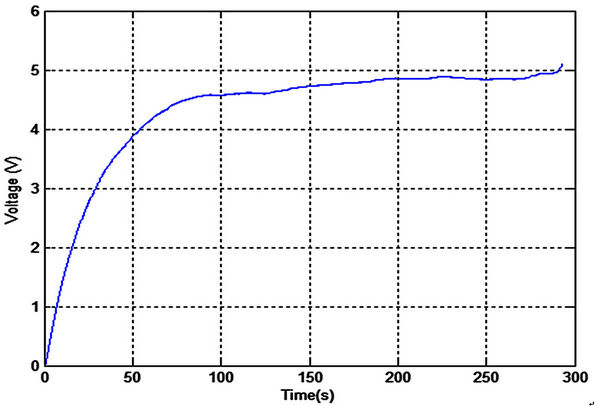
Figure 13. Output voltage using 470 µF capacitor.
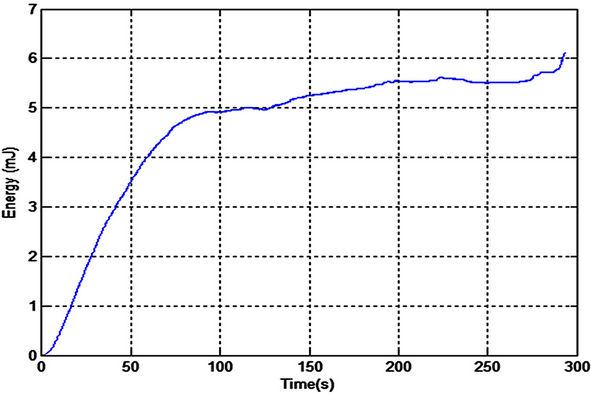
Figure 14. Stored energy using 470 µF capacitor.
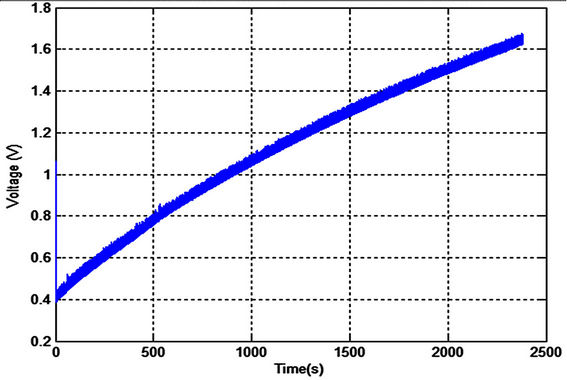
Figure 15. Output voltage using 0.1 F capacitor.
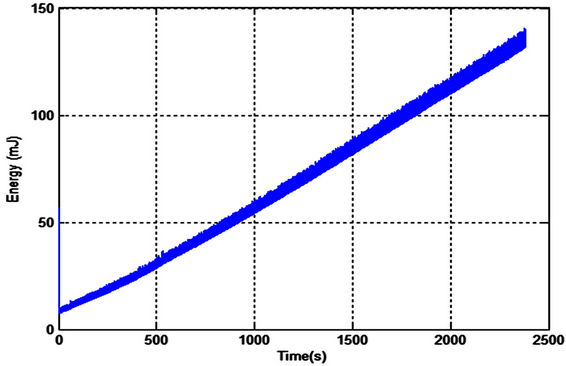
Figure 16. Stored energy using 0.1 F capacitor.
• Resonant frequency of the harvester can be identified experimentally by tracking the maximum extracted electrical power.
• Increasing tip mass decreases the resonant frequency.
• Output power increases as the value of tip mass increases that means; the Q-factor is also increased.
• After certain limit; increasing tip mass decreases the Q-factor due to the increasing of the damping effect.
• The position of tip mass has a great effect on the effective mass of the harvesting cantilever and also its resonant frequency.
• Piezoelectric harvester has an effective internal impedance as capacitive type which depends on the operating frequency.
• Maximum power transfer occurs when harvester’s internal impedance matches the resistive load.
• For a fixed level of excitation, the output power is inversely proportional to the natural frequency of a harvesting structure and hence it is preferable to operate at the first harmonic or the fundamental frequency of the vibrating structure.
In the future, the design of autonomous frequency tuning will be investigated using these parameters to enhance the system performance. In this case, the piezoelectric harvester will be smarter to autonomously adapt its resonant frequency according to the fundamental frequency in the exciting vibration signal. Super-capacitors will be studied to store the generated energy.
6. Acknowledgements
This work is supported by NPST program by King Saud University, Project Number 10-NAN1036-02.
REFERENCES
- H. A. Sodano and D. J. Inman, “Comparison of Piezoelectric Energy Harvesting Devices for Recharging Batteries,” Journal of Intelligent Material Systems and Structures, Vol. 16, No. 10, 2005, pp. 799-807. doi:10.1177/1045389X05056681
- C. Lee, “Hybrid Energy Harvesters Could Power Handheld Electronics,” SPIE Digital Library, Newsroom 18, October 2010. http://spie.org/x42029.xml?ArticleID=x42029
- K. A. Cook-Chennault, N. Thambi and A. M. Sastry, “Powering MEMS Portable Devices—A Review of Non-Regenerative and Regenerative Power Supply Systems with Special Emphasis on Piezoelectric Energy Harvesting Systems,” Smart Materials and Structures, Vol. 17, No. 4, 2008. doi:10.1088/0964-1726/17/4/043001
- D. Guyomar and M. Lallart, “Recent Progress in Piezoelectric Conversion and Energy Harvesting Using NonLinear Electronic Interfaces and Issues in Small Scale Implementation,” Micromachines, Vol. 2, No. 2, 2011, pp. 274-294. doi:10.3390/mi2020274
- A. Erturk and D. J. Inman, “Piezoelectric Energy Harvesting,” John Wiley & Sons, Hoboken, 2011. doi:10.1002/9781119991151
- T. J. Kazmierski and S. Beeby, “Energy Harvesting Systems: Principles, Modeling and Applications,” Springer Science, Berlin, Heidelberg, 2011.
- S. Priya and D. J. Inman, “Energy Harvesting Technologies,” Springer Science, Berlin, Heidelberg, 2010.
- S. Beeby and N. White, “Energy Harvesting for Autonomous Systems,” Artech House, London, 2010.
- A. Harb, “Energy Harvesting: State-of-the-Art,” Renewable Energy 36 (Elsevier), Vol. 36, No. 10, 2011, pp. 2641- 2654.
- S. Saadon and O. Sidek, “A Review of Vibration-Based MEMS Piezoelectric Energy Harvesters,” Energy Conversion and Management, Vol. 52, No. 1, 2011, pp. 500- 504. doi:10.1016/j.enconman.2010.07.024
- J. Paulo and P. D. Gaspar, “Review and Future Trend of Energy Harvesting Methods for Portable Medical Devices,” Proceedings of the World Congress on Engineering WCE 2010, London, 30 June-2 July 2010, pp. 909- 914.
- A. Khaligh, P. Zeng and C. Zheng, “Kinetic Energy Harvesting Using Piezoelectric and Electromagnetic Technologies—State of the Art,” IEEE Transactions on Industrial Electronics, Vol. 57, No. 3, 2010, pp. 850-860. doi:10.1109/TIE.2009.2024652
- D. Jia and J. Liu, “Human Power-Based Energy Harvesting Strategies for Mobile Electronic Devices,” Energy Power Engineering in China, Vol. 3, No. 1, 2009, pp. 27- 46. doi:10.1007/s11708-009-0002-4
- R. Bogue, “Energy Harvesting and Wireless Sensors: A Review of Recent Developments,” Sensor Review, Vol. 29, No. 3, 2009, pp. 194-199. doi:10.1108/02602280910967594
- S. Chalasani and J. M. Conrad, “A Survey of Energy Harvesting Sources for Embedded Systems,” 2008 Southeast Conference, Huntsville, 3-6 April 2008, pp. 442-447.
- A. Safari and A. E. Korary, “Piezoelectric and Acoustic Materials for Transducer Applications,” Springer, Berlin, Heidelberg, 2010.
- W. Heywang, K. Lubitz and W. Wersing, “Piezoelectricity Evolution and Future of a Technology,” Springer, Berlin, Heidelberg, 2008.
- A. Arnau, “Piezoelectric Transducers and Applications,” Springer, Berlin, Heidelberg, 2008.
- C. B. Williams and R. B. Yates, “Analysis of MicroElectric Generator for Microsystems,” Sensors and Actuators A: Physical, Vol. 52, No. 1-3, 1996, pp. 8-11. doi:10.1016/0924-4247(96)80118-X