Journal of Transportation Technologies
Vol.4 No.1(2014), Article ID:42489,14 pages DOI:10.4236/jtts.2014.41013
Test a Queue Detection System for Special Events in Nevada
1Department of Civil and Environmental Engineering and Construction, University of Nevada, Las Vegas, USA
2School of Civil Engineering and Mechanics, Huazhong University of Science and Technology, Wuhan, China
3Department of Electrical and Computer Engineering, University of Nevada, Las Vegas, USA
4Department of Civil and Environmental Engineering, University of Nevada, Reno, USA
Email: hualiang.teng@unlv.edu, xuecai_xu@hust.edu.cn, venkatesan.muthukumar@unlv.edu, arg1941@gmail.com
Received August 8, 2013; revised September 19; 2013; accepted October 11, 2013
ABSTRACT
Queue detection systems have been used in traffic management in work zones and have also been recommended for traffic control for special events like sports and conventions. However, they have not been tested in the field. This paper presents the results of tests for a queue detection system at two special events in Las Vegas, Nevada. The system consisted of two vision detectors, radio frequency communications and one changeable message sign. Two aspects of the system were evaluated: the effectiveness of the system in reducing speeds and the cost and effectiveness of its deployment. In the tests, traffic data such as queue length and vehicle operating speeds were collected and analyzed to see whether motorists respond congestion related message on the changeable message sign when they did not perceive the congestion. By this approach, the motorists’ true responses to the system were identified. The results indicated that motorists did make positive responses to the messages provided by the system. However, it was found that the system may not be cost-effective because significant costs would be incurred in purchasing, installation and maintenance of the system. Recommendations were provided to utilize existing message signs and detectors to provide the same information to motorists as a queue detection system does.
Keywords:ITS Technology; Special Events
1. Introduction
It is very common in peak periods that queues back up from some freeways to connected arterials, or vice versus at some locations in Nevada so that queues interface with through lane traffic. One phenomenon is that there are many entertainment facilities in Las Vegas that organize major events (e.g., conventions) which tend to cause short term surges in traffic, and the resulting queues often become hazardous. Note that these situations pose even greater dangers during non-peak periods. It is because drivers in these non-peak periods may not be from the local areas and thus may not be as familiar to roadways as the drivers in peak periods (during which most of the drivers are commuters). To prevent crashes in this situation, an effective approach is to install queue detectors at the potential locations and alert the upstream motorists of the queues using technologies such as changeable message signs. With the messages displayed on a changeable message sign, motorists can take due precautions. By doing so, the number of crashes in this situation can be reduced.
Basically, a queue detection system can be applied to the following four conditions:
● Congestion related to recurring traffic conditions [1-4]● Congestion related to work zones [5]● Congestion related to incidents [6], and
● Congestion related to special events such as sporting events and conventions.
The time and place for recurring congestion, work zones and special events can be known in advance and thus the queue detection system can be installed based on the evaluation of anticipated traffic congestion conditions. However, it is difficult to anticipate in advance the time and place for incidents in advance, and thus incident response vehicles typically carry portable queue detection systems (primarily consisting of a CMS) to incident scenes to alert motorists of incidents downstream. So far, most of the applications of queue detection systems have been for recurring congestion, work zone and incidents. Applications of the queue detections to special events have been recommended in a guidebook for managing traffic for special events, and the queue detection system has not be tested for a special event. This study was the first attempt to test the queue detection system in selected locations for special events.
A typical queue detection system consists of detectors, radio frequency communication and variable message signs. Detectors are to collect data of traffic variables such as volume, speed and presence from which queue length can be estimated. If a queue is detected, the messages on variable message signs installed upstream will be adjusted correspondingly to alerting the motorists of the queue downstream. The radio frequency communication transmits the information of queue detection from the detectors to the display controllers attached to changeable message signs. Detectors can be different types including tube, loop, radar and camera.
The evaluation of the queue detection system in this study was not on the system reliability or maintenance issue. It was focused on whether motorists made response to the message displayed on the changeable message sign. There have been studies on evaluating the effectiveness of message sign. It has been not clear whether the responses by motorists were to the perceived congestions or the displayed message. This study particularly made this distinction in the evaluation.
The deployments of the queue detection system have shown significant effectiveness in reducing the number of crashes. For instance, INDOT installed a special warning system at an exit on I-65 in 1999. The number of crashes was decreased from twenty-eight occurred between May and December 1998 to sixteen during the same period in 1999. Like many technologies in the Intelligent Transportation Systems, queue detection systems for special events involve the installation of the system in an area associated with special events. The deployment of such a system was not as easy as deploying a speed trailer in a work zone. The installation and maintenance of the system in the field may be very timeconsuming. Particularly, the time period during which the queue detection system can be effective for a typical deployment is usually short and thus may not be able to justify its applications for special events. Thus, cost and benefit analysis was conducted for this system in this study. Note that there are traffic control plans developed for every special event. However, these plans only cover the area close to the places where the activities of special events occur. The impacted traffic usually located far beyond the area covered by typical traffic control plans.
To achieve the objective of the study, a literature review was performed primarily on the application of queue detection systems in work zones because queue detection has been mostly applied in work zones. Based on the literature review, it was identified that queue detection system has been tested in several states that showed positive results in reducing speeds. Different from most of the queue detection system where microwave non-intrusive detectors were used in queue detection system, this study developed a system that used vision detection technologies for monitoring traffic conditions at identified location. The developed system was tested in Sam Boyd Stadium and in the Thomas & Mack Center for a football game and Bull Rider competition, respectively. Vision technology was also used to collect traffic data for observing the performance of the system in term of the motorists’ compliance to the messages displayed on changeable message signs. The data derived from using the vision detection technology were analyzed based on the measurements of effectiveness: speed, queue length and volume. It was found that vehicle speeds can be reduced significantly even when motorists did not see the actual queues. Benefits and cost analyses were performed for both test sites. It was found that deploying such a queue detection system may not be costeffective due to the high cost of the system that cannot be balanced by the saving for avoiding the occurrence of some crashes at the identified locations for a special event. Thus, the study recommended to use technologies such as changeable message signs and traffic sensors that have been in place to reduce system costs. That way, the cost of deploying the queue detection system can be decreased, for which the development of queue detection system can be justified.
In the following part of the paper, the second section covers the literature review. The third section details the methodology for conducting the tests. The fourth and fifth sections present the tests at two locations, respectively. In Section 6, the cost and benefit for adopting the queue detection system for special events are covered. Conclusions and recommendations were provided in the last section.
2. Literature Review
Queue detection system is perceived effective in improving safety at recurrently congested location, work zone, incidents and special event. There have been many applications of the queue detection system to work zones. Thus, the literature review in this section focuses on the literature on work zone related application only.
The queue detection system deployed in work zones is also called automatic work zone information system (AWIS). It can include different system components, dependent upon whether the system intends to disseminate congestion information to the vicinity of deployed changeable message signs or to a larger area beyond the work zone area. The typical components of the systems are traffic data collection, communications, and dissemination system. The data collection systems are located in work zones where road and traffic conditions are different from regular conditions. The collected data are distributed to motorist in different ways, depending on the spatial location of the motorists the system intends to serve.
So far, the following systems manufactured by different companies have been tested in previous studies: TIPS (Traffic Information and Prediction System), ADAPTIR (Automated Data Acquisition and Processing of Traffic Information in Real-time), CHIPS (Computerized Highway Information Processing System, and IntelliZone. Each of them has been tested in more than one state. In addition to these major systems, there were other systems that were developed for research or tested less extensively. They were also reviewed in this study.
TIPS was developed by Dr. Prahlad D. Pant of the University of Cincinnati. It was jointly evaluated in [7] and [8]. Basically, the system was designed to collect speed data and disseminate travel time information to motorists traveling immediately upstream of work zone. Through changeable message signs, every motorist passing the signs can be informed of travel time through work zone downstream. Relatively short range communications were employed for passing information between where the information was collected and where the information was accessed. TIPS have been tested in other studies [9-11]. Horowitz et al. [9] evaluated the TIPS from the perspective of its impact on traffic diversion. It was found that the diversion was not significant. Pigman and Agent [10] evaluated the TIPS in the following aspects: 1) performance and reliability, 2) travel time estimation, 3) diversion, 4) crash data, and 5) driver opinion.
ADAPTIR was developed by Scientex Corporation. McCoy and Pesti [12] evaluated the ADAPTIR in Nebraska. The system collected speed data using RTMS which were mounted on the top of portable CMS. The collected speed data were processed to determine the messages to be displayed on each CMS, which were located at different places before a work zone. The messages displayed on CMSs were speed advisory in nature. The system in McCoy and Pesti [12] was evaluated primarily on whether it can reduce vehicle speed. It was found that motorists reduced their speed during congestion when they were aware of the presence of work zone. It was not known whether the reduction of speed was caused by the presence of congestion or the messages on portable CMSs.
In [13], the ADAPTIR was evaluated in Arkansas. The system used RTMS to collect speed data, which were then transmitted to CMS for display. In addition, the speed data and relevant information was transmitted to two highway advisor radio stations for broadcasting. Furthermore, the speed and traffic information were sent to selected group of staff via pager. In their study, Tudor et al. (2003) focused on operation and safety issues.
CHIPS was a product from the ASTI Transportation Systems. The system tested in [14] used Remote Traffic Microwave Sensors (RTMS) to detect whether there was congestion at several places before a work zone. The congestion information was transmitted to portable CMSs on sites or a system at a central location. That way motorists both on site and off site can receive the messages and made response correspondingly. Trailer mounted CCTV cameras were also installed at some places, and live videos were transmitted to a remote central location from which motorists off the work zone can obtain traffic information in the work zone. In the test, traffic information was also sent to motorists through email and paging. In [14], the effectiveness of the CHIP was evaluated based on the travel time of traffic running through work zone, diversion rate at off ramp before the tested work zone, and some surrogate measures of crashes.
The CHIPS evaluated in [13] had similar system components as the ADAPTIR jointly tested in their study. Instead of using landline to transmit information to HAR in ADAPTIR, it used cell phone. In addition, it also included an email service to disseminate the traffic information (traffic condition, delay, and diversion advisories) to a selected group of staff. Like their evaluation for the ADAPTIR, Tudor et al. [13] evaluated CHIP with the focus on operation and safety issues.
IntelliZone was an AWIS that was manufactured by Quixote Transportation Safety [15]. In this system, magnetic detectors were installed in each lane to measure traffic variables such as speed and volume. A mobile command center located on site received the collected traffic data through wireless communications and decided on the messages (primarily related to speed) to be shown on the portable CMS. The system was evaluated for its impact on speed and speed variance. This system was also evaluated in [16]. Instead of using magnetic detectors, this system integrated microwave detectors for measuring speed in their study.
The D-25 Speed Advisory Sign System from MPH Industries was tested in [17]. It is a system that was similar to the one tested in [12], except the speed sign on the speed trailer. When the downstream speed differentials was less than 15 mph, two strobes, each on one side of the speed trailer would flash, and the measured speeds would also be displayed. When the downstream speed differential was greater than 15 mph, the slowest speed measured or the speed limit would be displayed with flashing. The purpose of the study was to evaluate the effectiveness of the speed trailer in reducing speed and speed differential upstream a work zone. Note that the effect of the sign with flashing was not separately evaluated. It was evaluated as part of a whole operation scenario.
Research Build System: There were systems that were developed by research teams for their evaluation. An example was the system developed in [18]. Video detection technology was used to collect traffic data such as speed and vehicle classification. These traffic data were transmitted to a controller where they were analyzed to determine the messages to display on CMSs that were deployed in advance of a work zone. Additionally, a website was developed for broadcasting traffic information in work zone to a wider area. In this study, Pesti et al. [18] focused their effort on the diversion issue, with an extensive review on previous studies related to evaluating the diversion impact of the AWIS.
It can be seen from the literature review that there have been several manufacturers providing AWIS: TIPS, ADAPTIR, CHIPS, and IntelliZone. AWIS consists of some basic system components: traffic data collection, data transmission, controller, message presentation. A simple AWIS consists of detectors, wireless communications, a controller, and CMSs, all on site. The purposes of such an AWIS could be speed advisory, travel time and delay information provision, and incident alerts. The popular traffic data collection technologies are portable non-intrusive detectors such as RTMS. Magnetic sensors which were used in a study are intrusive in nature, and may not be easy to install in a work zone. Video detection may be a choice, but may suffer from the data reliability problem. Speed was the most basic information that can be produced from the system. Other information such as queue, congestion, travel time, travel delay, and incidents have to involve transforming the speed data collected at several places within or upstream a work zone. The transformation of the data may bring in the reliability issue to the derived information. In most of cases, all the detectors were placed upstream a work zone. The number of detectors and portable changeable message signs could be varying, depending upon the accuracy of the information the system intends to provide. The major aspects that the system was evaluated were speed control, traffic diversion, crashes, operation reliability, and information accuracy.
A more complicated AWIS involved disseminating traffic information to a large area beyond work zones. Such information would be helpful in trip planning such as route choice or departure time choice. The popular ways to disseminate the information were highway advisory radio, web site, fax, email, and paging. The population of the motorists being able to access the information varies from some chosen staff to travelers in a large area. The evaluation of such a system is very challenging. The system evaluated in this study was a simple system that only allows dissemination of queue related information in the vicinity of the CMS in the system.
3. Methodology
3.1. System Development
The system developed in this study included a vision detection system that was installed at places where queues usually formed. This vision detection system consisted of two cameras, each covering a number of traveling lanes, depending up the locations where the tests were conducted. The image data from the cameras were transmitted via Radio Frequency to Autoscope that was collocated with a changeable message sign upstream of queues that were supposed to occur. The image data were then processed and analyzed to monitor the traffic at the camera locations. A computer program was developed to make decision on whether the traffic was in congested or non-congested conditions. This program was also able to determine the messages to be presented on the message board. A connection was also made between the program and the message board, which allowed the recommended messages to be displayed appropriately. The program was written such that the messages on the message board can be changed manually.
3.2. Choice of Test Sites
In this study, four facilities have been considered as test sites: Las Vegas Speedway, Las Vegas Convention Center, Thomas & Mack, and Sam Boyd. The basic criteria used to choose a facility to conduct the test are:
1) There are queues formed during a special event that are frequently occur and be stabilized at relatively a predictable location on a roadway segment for a noticeable time period;
2) There are utilities such as light poles, sign cranes and traffic control poles near the location that allow to mount the components of the queue detection system such as cameras and RF antennas.
It is required to have a queue that fluctuates at a fixed location because the queue detection system tested in this study works only at a predetermined location. If the queue progresses quickly in a vicinity of a location such as a ramp or an intersection, the queue detection system can exhibit its function only for a short period of time, for which the effectiveness of the system for a sustainable period cannot be evaluated.
Several visits to each candidate facilities were made. Before the visits to a facility, meeting with the traffic control personnel of the facilities were held for information on the location where queues frequently appear. The background information on the traffic control plan for special events held in a facility can also be obtained which would help determine the situation of congestion in special events. Visits to the identified sites were made later on to observe the progression of queues and the availability of utilities to install the system components. Usually, a sketch of the identified location was developed. This sketch was used to determine the location of system components. In particularly, the following considerations were given: 1) Location of the CMS, 2) Location of detectors, and 3) Communications between CMS and the detectors. Finally, it was Thomas & Mack Center and Sam Boyd Stadium were chosen as the test sites, one on the freeway and the other on street arterial.
3.3. Field Data Collection and Data Analysis
Vision detection technology was used to collect traffic data for system evaluation. Cameras were installed on light poles before and after the changeable message sign. The videos recorded were processed in-house for outputting the traffic data. The evaluation of the queue system for special events was focused on testing whether the system can truly be effective in reducing speeds. To evaluate whether motorists slowed down for the messages on the message board, the time period showing the message “Congestion Downstream” was split into at least two parts – one with queue that cannot be seen by the drivers, and the second with queue that appear in eyes of the drivers. The differences between traffic variables such as queue length during these time phases were used to demonstrate the effectiveness of the queue detection systems on slowing down traffic. Whether the differences between the traffic variables were significant statistically was tested using hypothesis testing method.
3.4. Cost and Benefit Analysis
The objective of the benefit and cost analysis was to determine the characteristics (duration and length of impact area) of the special events that can result in more benefits than the cost incurred for installing such a queue detection system. Thus, the benefits and costs were calculated for individual special events.
The benefit that can be realized due to the reduction of speeds of vehicles at special events and thus the corresponding reduction of accidents can be estimated based on costs that would be saved for not having these accidents happening. According to [19], “a 1 km/h change in speed can expect to result in a 3% change in the number of crashes”. Thus, if the total change in speed is expressed as  (mph), the change in the number of crashes can be estimated as:
 (1)
(1)
where  denotes the total number of crashes estimated to happen in a special event. In this study,
  was the speed reduction caused by deploying the queue detection system. In addition, only two categories of crashes were considered: fatal and non-fatal. If needed, more categories of crashes can be adopted. With the total number of crashes estimated for these two categories of crashes, the number of crashes that can be avoided due to the speed reduction can be calculated using the equation below:
 (2)
(2)
 (3)
(3)
Since crash rate is known (at least on a national level) for different categories of crashes, the total number of crashes in these categories can be derived for a road segment on which traffic travel for a special event as follows:
 (4)
(4)
 (5)
(5)
 (6)
(6)
where  and
and  are crash rates for fatal and non-fatal crashes, respectively;
  and
and  denotes the crash rates for these two categories of crashes, and VMT represents the vehicle miles traveled by the vehicles through the location where congestion occur during special events.
For a road segment carrying special event traffic, the VMT can be estimated as:
![]() (7)
(7)
where ![]() denotes the distance over which vehicles keep their reduced speeds. The term
denotes the distance over which vehicles keep their reduced speeds. The term ![]() represents the duration during which speeds were reduced. It is usually short (about half hour in this study) and can be represented as a percentage of 24 hours.
represents the duration during which speeds were reduced. It is usually short (about half hour in this study) and can be represented as a percentage of 24 hours.
If the unit costs for these two categories of crashes are available, the total cost saving (denoted as B for benefit) due to avoiding the occurrence of these crashes can be estimated as:
 (8)
(8)
where  and
and  represent the unit costs for these two categories of crashes, respectively. From [20], it can be found that the unit costs for the crashes with severity level of K, A, B, Code, O, are $3,654,299, $181,276, $46,643, $22,201, and $2116, respectively. The unit cost for the fatality is $3,654,299, while that for the non-fatality crashes was derived as the average of the other four unit costs, which gives $63,059.
The total cost is the sum of the following four categories of costs: capital (C), installation, operation, and maintenance. The capital cost C can be annualized as:
 (9)
(9)
where i represents the interest rate and n is the life cycle. In the calculation in this study, the interest rate was assumed to be 8% for all the system components, and the life cycles of different system components were assumed the same as 10 years. Because a special event would be held for a week at most, the annualized capital cost was converted to a daily based value:
 (10)
(10)
Then, the capital cost for a special event last several days can be derived as:
 (11)
(11)
The system components included in the calculation were: CMS, cameras, video detection processor, and radio frequency. One CMS and two RF were counted, while two video detection processors and two cameras were included. The unit costs for CMS, camera, video detection processor and RF were $50,000, $400, $4000, and $300, respectively. The present value of the capital cost was calculated as $59,100. Since their life cycles were assumed the same and be equal to 10 years, the annualized cost can be calculated as $8808 at 8% interest rate. This annualized cost can be used to derive the daily based capital cost![]() .
.
Installation cost was the cost to set up the system for a special event . The installation included mounting and dismounting cameras and RF, and system integration in the field. Mounting the cameras and RF would take about three hours with the involvement of one ITS related technician and one maintenance crew consisting of one supervisor and three workers. Dismounting these cameras and RF would take approximately another one hour. Integrating the system making sure the system works as expected would take two more hours in the field. The annual salaries for both the ITS technician and the supervisor of the maintenance crew were calculated at $60,000, and the salary for the three maintenance workers was estimated at $40,000. The fringe benefit rate was assumed to be 30%. Then, the cost for setting up and dismounting the system
  was calculated at $1503.
It was also assumed that the ITS technician should be available for operating the system during about half of the duration of a special event. The cost for this part of work comprised the operation cost , where
  is the technician’s hourly rate.
The maintenance cost was estimated as the half of the capital cost, which can be written as:
 (12)
(12)
The total cost for having such a system in a special event can be derived as:
 (13)
(13)
It can be seen from the equation that only the installation cost is not a function of the impact time period of special events. Given the benefit (B) and cost  estimated above, the benefit and cost ratio can be derived as
![]() .
.
4. Test on Sam Boyd Stadium
Figure 1 displays several access routes to Sam Boyd Silver Bowl. The formal address for this facility posted on its website was: 7000 E Russell Rd, Las Vegas, Nevada 89122-8338. Thus, this facility was mostly accessed from Tropicana Avenue and Russell Road. Since Russell Road exit was suggested as the best candidate for testing the technology, the system was set up over there. Another condition making this site feasible for testing the system was that there were facilities on which the cameras and antennas can be mounted.
It was indicated by the Manager of Special Events in the Thomas & Mack Center that congestion usually backed up to freeway I-515 from the off ramp at Russell Road during events such as football games. Traffic controls for such event were usually set up at locations close to Sam Boyd Stadium, not to the area around the freeway. Thus, motorists either attending the special events or passing the off ramp always ran into the congestion with no warning.
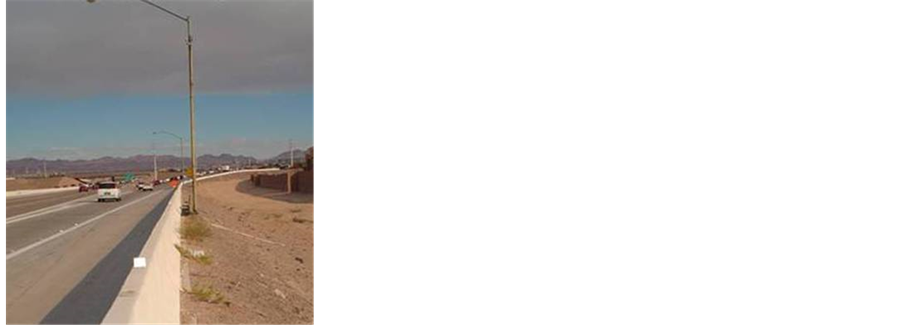
Figure 2 displays the configuration of the system at the site. Cameras 2 and 3 were part of the vision detection system. Two Autoscope image processors were connected to these two cameras (one for each of Cameras 2 and 3, respectively) to collect traffic data such as speed, occupancy, and volume. Figure 3 shows utility pole where Camera 2 was mounted. One antenna was also installed jointly with the camera and the image processor at each of these two locations. These antennas were used to transmit the traffic data to a RF at the location where a CMS was deployed. Figure 3 also presents the plastic pole carrying the RF that was attached to the CMS. The RF was connected to a computer as a controller. A program was written in the controller to determine the ap-
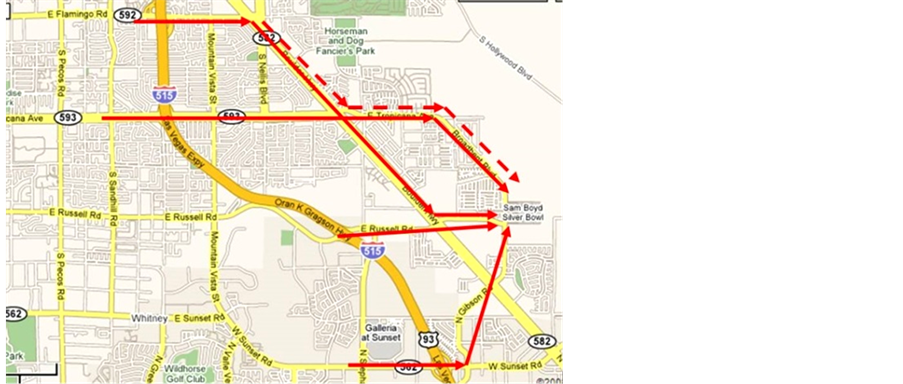
Figure 1. Access to Sam Boyd Silver Bowl (Google map).
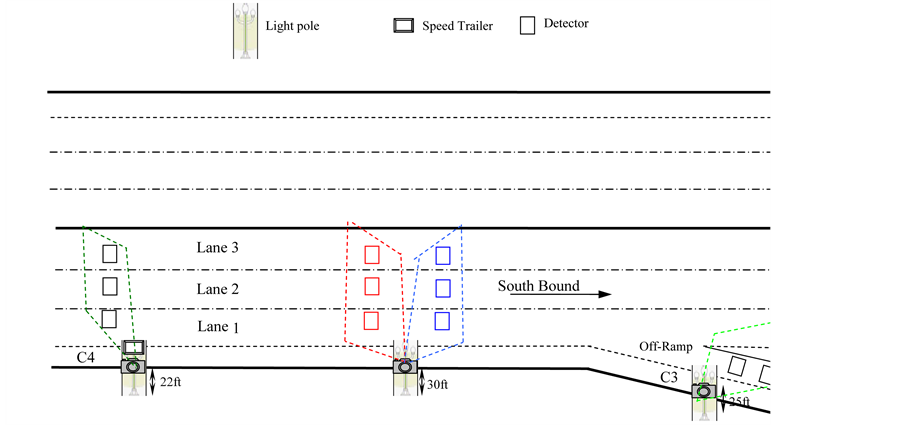
Figure 2. System layouts and evaluation equipment at Russell Rd. off-ramp.
 (a)
(a)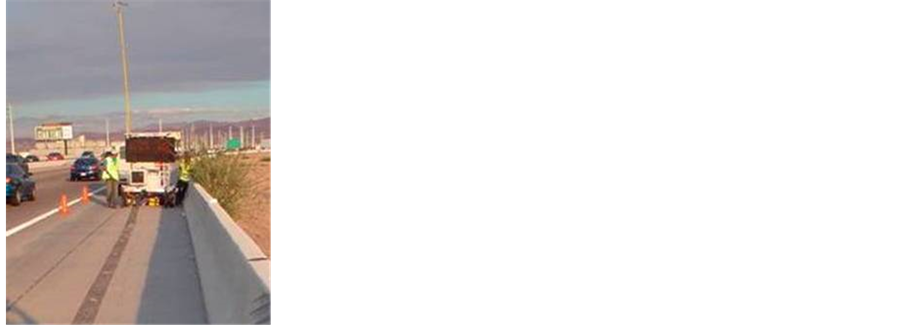 (b)
(b)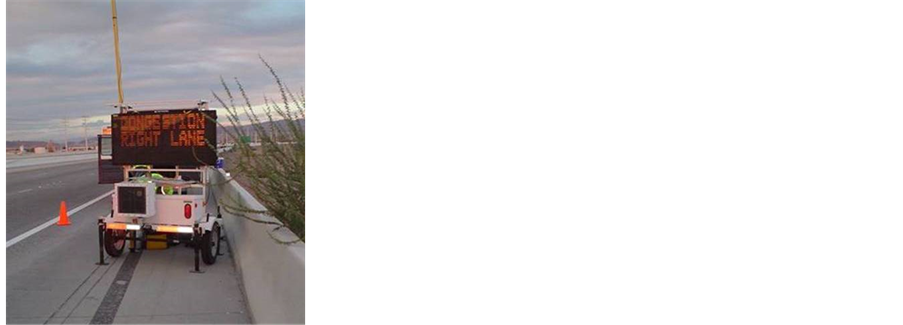 (c)
(c)
Figure 3. Components of the queue detection systems in the field. (a) Plastic pole attached to a utility pole carried Cameras 1 and 2 and a RF. (b) Camera mounted on a plastic pole attached to the CMS trailer. (c) CMS displaying “congestion right lane”.
propriate messages to be displayed based on analyzing the traffic data received from the RF transmissions. The space between the RF at CMS and the RFs at the other two locations were clear and an eye sight between them was available for communications. There are two more cameras at the site: Camera 4 at CMS and Camera 1 at the location where Camera 2 was mounted. They were used to record traffic, which was then processed to derive the performance measures for evaluating the performance of the queue detection system.
Field Tests—September 15, 2007
The football game on September 15, 2007 started on 6:30 pm. The system was set up at 4:45 pm. From 4:45 pm to 5:10 pm, no congestion was observed on the off ramp. During this time period, no message was displayed on the CMS. From 5:10 pm to 5:30 pm, the message “Drive Safely” was displayed because no congestion was observed on the off ramp. Starting from 5:30 pm, congestion was observed on the off ramp, but did not back up to the mainline freeway. Thus, the message “Congestion Right Lane” was displayed since then. At 5:40 pm, it was seen that the congestion spilled to mainline freeway and motorists can see the congestion from upstream of the CMS. The congestion recessed back to the off ramp at 6:10 pm. The congestion stayed on the off ramp until 6:30 pm. From 5:30 pm to 6:30 pm, the message “Congestion Right Lane” was displayed for the entire time period. The congestion was first not perceivable from the mainline, then perceivable, later not be seen again.
Figure 4 presents the patterns of speeds over the three lanes at the location where Cameras 1 and 4 were installed. From the upper chart in Figure 4 it can be seen that the speeds when the message was “Drive Safely” was smaller than those when the CMS showed no message. When congestion started showing on the off ramp, the message turned to “Congestion Right Lane”. The speeds were reduced further down. After the congestion was presented on the mainline freeway, the speeds were reduced additionally, which is the speeds shown at the bottom in the upper chart in Figure 4. When the congestion shrank back to the off ramp, the speeds went up to a level similar to the case when there was congestion at the beginning or the case when there was no congestion.
From the chart (for Camera 1) in the lower part of Figure 4 it can be seen that the similar pattern of speed changes can be observed over these different time periods with different levels of congestion and messages shown on the CMS, One difference was that the speeds in these time periods at this location were lower than those at the upstream Camera 4. These results from Cameras 1 and 4 have been tested using the hypothesis test method. The test results in Table 1 confirm the results observed from Figure 4.
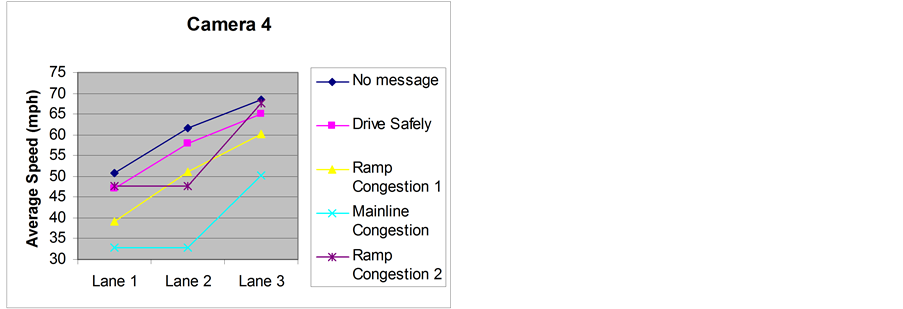
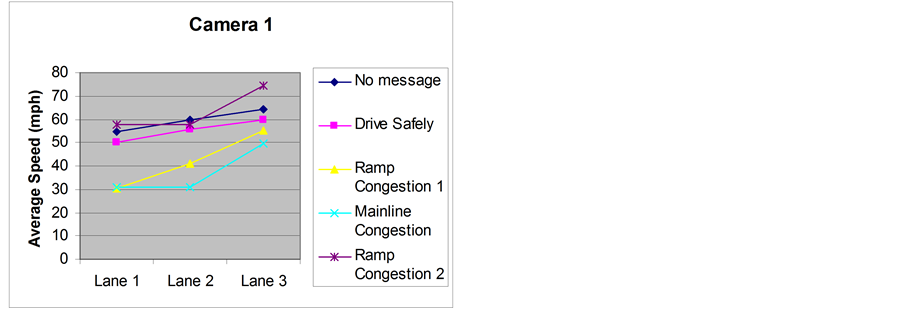
Figure 4. Speed data from Cameras 1 and 4 on December 15, 2007.

Table 1. Hypothesis test results for the speeds of traffic responding to different messages on September 15, 2007.
Note: Ramp Congestion 1 and Ramp Congestion 2 represent congestions happened on the off ramp before and after the congestion spilled to freeway, respectively. “<” indicates that the speed in the time period shown on the left most column is the same as the time period indicated on the corresponding heading. This definition is the same for “>” and “=”.
5. Test at the Site for the Thomas & Mack Center
Visits were made to two special events held at Thomas & Mack for observing the traffic congestion on Tropicana Avenue (see Figure 5). Queue was seen fluctuating around the Pacific Terminal, very close to the Koval Ln. Intersection. This observation was briefed to the Thomas & Mack and was confirmed. It was also confirmed at the site that there were tall light poles that Clark County allowed to install cameras and antennas.
The site at the Thomas & Mack Center was chosen on Tropicana Avenue from Las Vegas Blvd to Paradise Road (see Figure 5). During special events such as Professional Bull Rider, queues were observed to form at the intersection of Paradise Road and Tropicana Avenue and backed up to the intersection at Koval Ln.
To detect the queue backed up from Paradise Rd. and monitor the progression of the queue to Koval Ln, two cameras (Cameras 1 and 2 in Figure 6) were mounted on street light poles. The CMS was deployed on the median shoulder at the intersection of Island Way, facing the parking garage of MGM Casino and Hotel on Tropicana Avenue (see Figure 7). From Figure 5, it can be seen that the road segment on Tropicana Avenue from Las Vegas Blvd to Paradise Road was straight, between which there was no object blocking the eye sight for the communications between the RFs that were installed at Cameras 1 and 2 and the CMS.
To collect data for evaluating the performance of the queue detection system, Cameras 3 and 4 (see Figure 8) were mounted on two light poles, one before and one after Island Way. In the test on I-515, one camera was mounted on a plastic pole that was attached to the trailer that carried the CMS. In the test at this site, however, a camera was mounted on street light which provided the stability for the camera to collect stable images of videos.
Field Test on November 3, 2007
The tests at this site were conducted on November 3, 2007 for the special event Professional Bull Rider. That day, the event started on 6:00 pm. The system was ready by 3:20 pm for collecting data before traffic started entering the game. From 3:20 pm to 3:30 pm, no message was displayed on the CMS. By the time 3:30 pm, the message changed to “Drive Safely”. From 4:45 pm to 6:00 pm, the message “Congestion Left Lane” was exhibited. During this one hour and fifteen minutes, congestion conditions were changing dramatically. From 4:45 pm to 5:20 pm, queues fluctuated before the Koval Ln Intersection. From 5:20 pm to 6:00 pm, the queues backed to the location close to where the CMS was located.
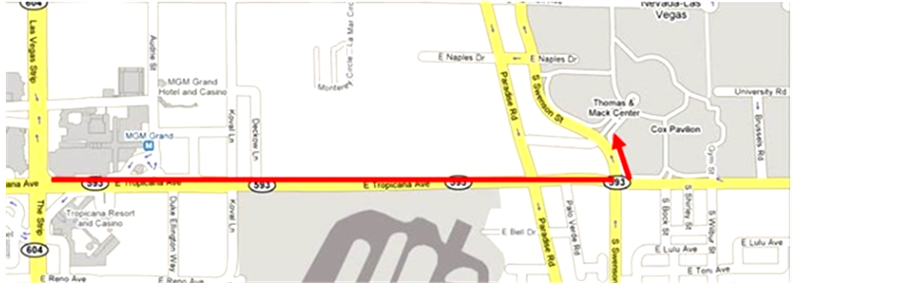
Figure 5. Direction of traffic to Thomas & Mack.
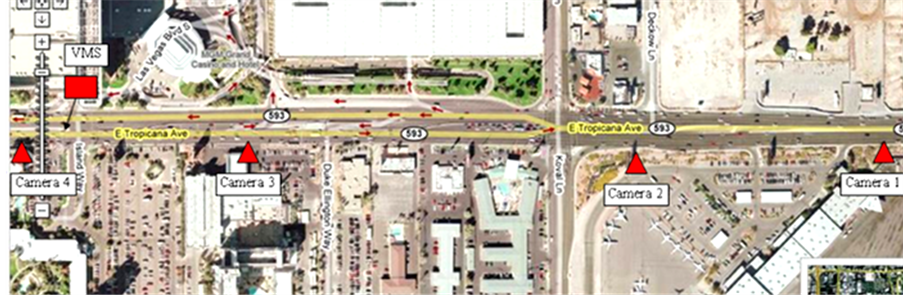
Figure 6. System layouts in the field on Tropicana Avenue.
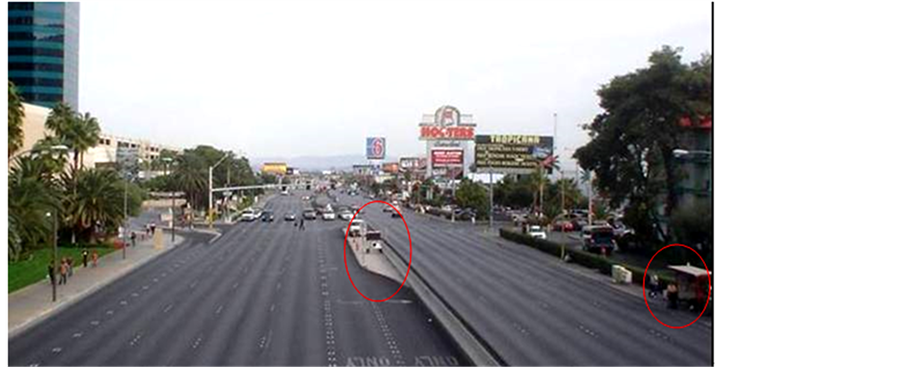
Figure 7. Locations of a CMS and a bus stop.
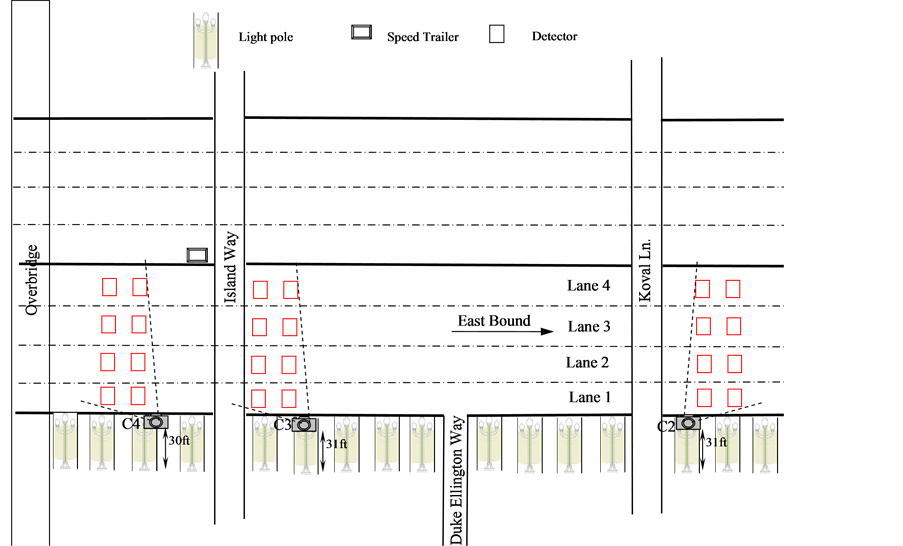
Figure 8. Cameras for collecting observational data for system evaluation.
The videos collected from Cameras 3 and 4 were processed to derive the measures of effectiveness: queue length and speed, for different time periods, each corresponding to different messages displayed on the CMS and the level of congestion condition. From Figure 5, it can be seen that traffic had to make left turn at Swenson Avenue to enter Thomas and Mack. Thus, queue was formed on the left lane. The message “Congestion Left Lane” was expected to direct traffic not attending the special event to use the right lanes. Thus, the traffic before the intersection at Island Way on Tropicana Avenue may distribute differently over the three lanes comparing with the case with no message displayed. Thus, the queue lengths before the start of the green light on the three lanes on the eastbound approach at the Island Way intersection were manually counted through replaying the recorded videos on computer. In addition, the speeds of vehicles on these three lanes during the green phase of signal were derived using the video image processor included in Autoscope. With the traffic data-queue length and speed, collected, the mobility of traffic and the resultant safety impact were evaluated. From Figure 7, it can be seen that a bus stop was located very close to the area where motorists were expected to make response to the CMS. It was observed in the field that vehicles had to wait behind a bus if there was no gap on the next lane for them to change lane. Vehicles could fully utilize the space occupied by a bus only when buses left the stop. Thus, these two performance measures were collected with the distinction whether there were buses presenting at the scene. According to the messages shown on the CMS, there are distinct three time periods: no message, “Drive Safety”, and “Congestion Left Lane”. To show whether a visible queue had more impact on motorists’ responses to a message, two time periods were distinguished for the time period when the message “Congestion Left Lane” was displayed. The first time period was corresponding to the duration when a queue did not pass the Koval Ln intersection. The second was when the queue reached to the area close the CMS and thus motorists can see the queue clearly.
From Camera 3, the speed and traffic volume data were collected for the green light time periods because this camera is at the downstream location of the Island Way intersection. Queue length data that can be collected from Camera 4 cannot be observed from this camera. Traffic volumes among these three lanes can be more revealing to the impact of the CMS. The speeds measured at this location can be viewed as the continuation from the location at Camera 4.
Figure 9 presents the queue length collected from Camera 4. The upper chart for no bus at the bus stop indicates that there were longer queues in left lanes and right lanes. The queue lengths during the congestion time period were significantly longer than the other two time periods. The queue lengths during the two time periods corresponding to congestion visible (close) and invisible (far) were very close. A tendency that more traffic shifted to right lanes can be observed when the message showed “Congestion Left Lane”, which implies that motorists spread out over the lanes even they did not see the congestion ahead.
From the lower part of Figure 9, which displays the speed data from Camera 4, it can be seen that the speeds on the right lanes were higher than the left lanes, which is consistent with our intuitive. In addition, the speeds during the congestion period were lower than those in non-congestion periods. This observation reflected the impact of congestion on speeds. The speeds during the congestion period when congestion was far from the CMS were lower than those when congestion was close to the CMS. Note that these differences in speeds in these two conditions are on the magnitude of 2 to 3 mph, which is small.
Figure 10 exhibits the speeds and traffic flow measured at Camera 3, downstream of Camera 4. It can be seen from the upper chart that the speeds during the time period when no message was displayed on the CMS were higher than those when there were message displayed. The speeds when congestion was visible to the motorists
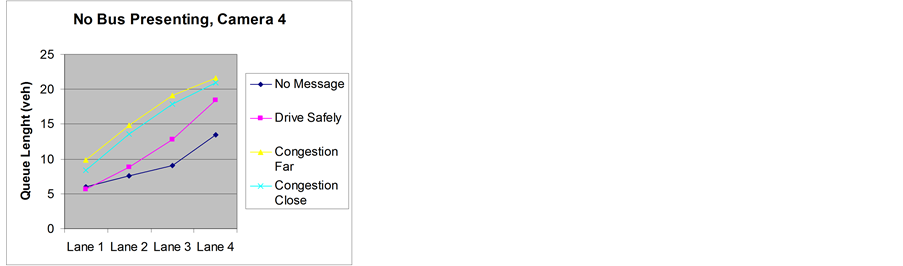
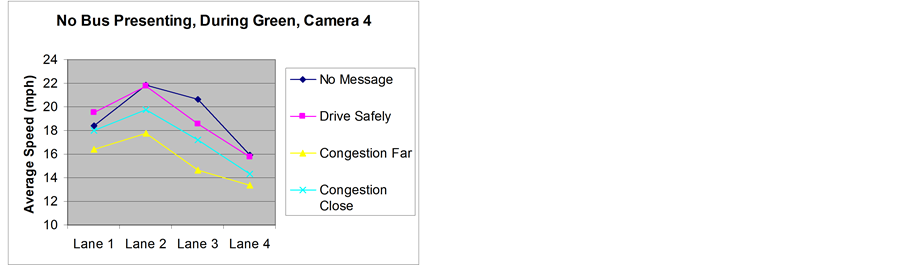
Figure 9. Queue length and speeds from Camera 4 on November 3, 2007.
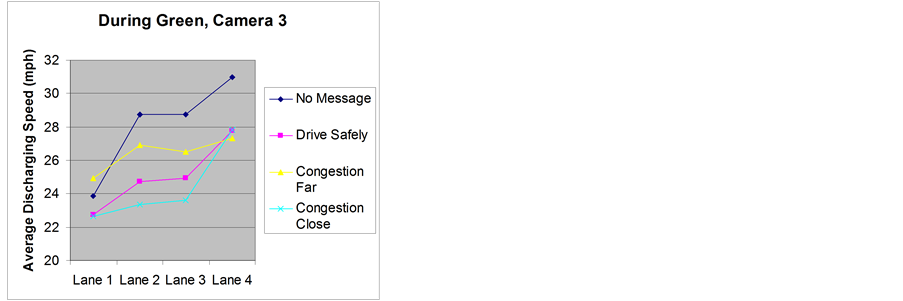
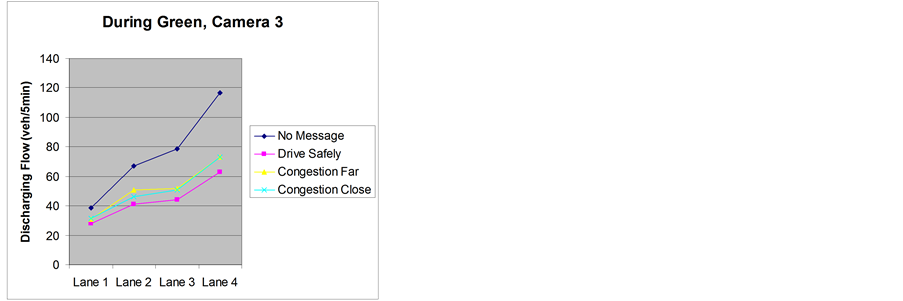
Figure 10. Speeds and flows at Camera 3 on November 3, 2007.
close to the CMS were lowest. The speeds in the other two time periods were in between of these two cases, which implies that any message, either “Drive Safely” or “Congestion Left Lane”, was effective in slowing down vehicles’ speeds. It can also be observed from the chart that the speeds when the congestion was not visible at the CMS were higher than that during the “Drive Safely” was shown. This indicates that the message “Congestion Left Lane” was effective in spreading vehicles over the traveling lanes and thus increased vehicles’ speeds. From the chart at the bottom of Figure 10 it can be seen that flows during the time periods when no message was shown and “Congestion Left Lane” was shown for visible congestion were either on the top or at the bottom levels. Those flows for the other two conditions were in between. This observation is an additional indication that support the findings based on the speeds at this location.
6. Cost and Benefit Analysis
In calculating the benefit for the site at Sam Body, the AADT was taken as 124,667. The speed reduction was 10 mph for each of the three lanes. From Sinha and Labi (2007), it was found that the fatality and non-fatality rates for interstate are 0.56 and 46.56 per 100 million VMT, respectively. It was assumed that the queue detection system demonstrated its unique contribution in reducing speeds only during the time period when there were congestions on the off ramp. Speeds were also reduced during the congestion presented on mainline. However, the speed reduction during this time period when there was no such a queue detection was installed can be viewed as the same as that period when there was such a queue detection system in place. It was assumed that the time period with the unique contribution by the system was 2 hours (the actual duration was 20 minutes). The traffic would sustain the reduced speeds up to 1500 ft. The B/C was calculated as 0.02. Note that the case assumed for the calculation was developed based on the test on I-515. To conduct a sensitive study on the B/C versus the total time period when the queue detection is the most effective, the B/C’s was calculated for the special event that lasted up to five days. B/C varies from 0.02 to 0.09. This result indicates that the queue detection system at the test site was not cost-effective.
It can be found that the reason for the system being not cost-effective is the high costs incurred in planning, designing, operating and maintaining the system. To see the condition of a queue detection system with varying level of complexity, the queue detection system was simplified by including only a CMS and two operators in the field. The system works by manually changing the messages on the CMS with the traffic report from the other operators close to the site where congestion usually appears. The B/C was calculated as 0.35, still less than 1.
For the test site at Thomas & Mack, the same method as used for Sam Boyd was adopted. Since this site was on arterial, the crash rates for fatal and non-fatal crashes were assumed to be 1.3 and 124.69, respectively. The range on which vehicles could sustain their lowered speed was 1500 ft. The time period during which the queue detection system can be really effective was two hours. The benefit and cost ratio was calculated as 0.02, far less than 1, making the cost and benefit even. Considering the queue detection system being deployed for 100 times in a year, the benefit and cost ratio is still almost the same as 0.02.
Basically, there are several variables that are critical in determining whether the queue detection system is costeffective: the scale of the impacted area, the traffic volume which influenced the duration during which the queue detection system was effective and the crash rate. Compared to the work zones for which the queue detection system can be applied, the major difference is the duration during which the system is effective. In the calculation above, two-hour was used, which was longer than the actual duration time. It was noted that a work zone could last for days and months. During this extended time period, the traffic running through a work zone reduced their speed. Thus, the VMT used to calculate the number of crashes would be significantly high. Relatively, the VMT used to derive the number of crashes for special events would be small. Thus, the benefit generated due to avoiding the crashes would be small. This makes the benefit and cost ratio to be smaller than one. Based on this analysis, it can be proposed that a good strategy for improving safety in special events is to use the technologies that are in place already to alert the motorists of the emerging congestions.
7. Conclusions and Recommendations
In this study, the effectiveness of queue detection system in reducing speed was evaluated by focusing on the performance of the system during the time period when motorists can only see the message, but not the congestion. In addition, a cost and benefit study was conducted to evaluate the conditions that such a queue detection system can be beneficial. The following findings can be concluded. First, motorists responded to congestion message by reducing speeds in some traveling lanes. This finding can be found in other studies in evaluating the effectiveness of queue detection system. It seems not beneficial economically to deploy the queue detection system for controlling speed at locations on the approaches to special events. The reason is that the duration of traffic experiencing speed reduction was short which made it difficult to generate enough benefits that would be produced by avoiding occurring crashes at the location approaching to special events.
It was recommended that the technologies existing on the current roadway system be better used to alert traffic queue and congestion. By using the existing technologies, the costs for alerting motorists of upcoming congestion can be reduced significantly. Two important components in a queue detection system are changeable message sign for disseminating traffic information and detectors for monitoring traffic condition. If a changeable message sign exists at a location very close to the location where queue would back up during special events, this message sign can then be used to display congestion related warning message. Less expensive detectors can be deployed at identified location to monitoring traffic. If available, existing detectors can also be used for monitoring traffic condition. Usually, changeable message signs and sensors comprise a significant portion of the total cost of the system. With using the existing changeable message sign and traffic sensors, the total capital cost of the whole system can be reduced substantially.
It should be aware that some parameters used in the calculation may have certain variation. For example, the crash rates used in the calculation may be on the lower side. They may be very high at the location close to special events. There might be other saving caused by diverting traffic to different routes. The task including this in the calculation is challenging and thus not presented in this study.
Acknowledgements
This study cannot be completed without the supports from many agencies and individuals. The research team would like to give their thanks to the following individuals for their assistance during the project: NDOT District 1 and Clark County, David Stetzer of Las Vegas Speedway, Michael Thompson of Traffic Control Service, Inc., Steve Patterson of the Las Vegas Visits and Convention Authority, and Kenny Sasaki, and Xin Li of UNLV.
REFERENCES
- S. C. Tignor, et al., “Innovative Traffic Control Technology and Practice in Europe,” 1999. http://www.international.fhwa.dot.gov/Pdfs/Innovtce.pdf
- Indiana Department of Transportation Press Release, “Clark County I-65 Exit 4 Solution Proves Successful,” 2000. http://www.state.in.us/dot/motoristinfo/trafficwise/wnew_otherindiana_news_04.html
- King County Department of Transportation Press Release, “New Traffic Warning System Improves Safety Near Elementary School,” 2002. http://www.metrokc.gov/kcdot/news/2002/nr020207_208th.htm
- P. B.Wiles, S. A. Cooner, C. H. Walters and E. J. Pultorak, “Advance Warning of Stopped Traffic on Freeways: Current Practices and Field Studies of Queue Propagation Speeds,” FHWA/TX-03/4413-1, 2002.
- FOCUS, Federal Highway Administration, “Queue Length Detector Reduces Risk of Rear-End Accidents in Work Zones,” 1998. http://www.tfhrc.gov/focus/archives/Fcs498/048chips.htm
- A. MacCarley, “Evaluation of Caltrans District 10 Automated Warning System: Year Two Progress Report,” California PATH Research Report No. UCB-ITS-PRR- 99-28, 1999.
- P. D. Pant, “Implementation and Testing of the Travel Time Prediction System (TIPS),” Final Report Prepared in Cooperation with the Ohio Department of Transportation and The US Department of Transportation, Federal Highway Administration, 2001.
- H. T. Zwahlen, “Evaluation of a Real-Time Travel Time Prediction System in a Freeway Construction Work Zone,” Final Report prepared for the Ohio Department of Transportation, 2001.
- A. J. Horowitz, I. Weisser and T. Notbohm, “Diversion from a Rural Work Zone Owing to a Traffic-Responsive Variable Message Signage System,” TRB 2003 Annual Meeting CD-ROM, Washington DC, 2003.
- J. G. Pigman and K. R. Agent. “Evaluation of Traffic Information and Prediction System as Work Zone Traffic Control,” Research Report to Kentucky Transportation Research Center, 2004.
- K. K. Dixon, “Evaluating Speed Reduction Strategies for Highway Work Zones (Smart Work Zones),” Final Report, Prepared for Georgia Department of Transportation Prepared by Georgia Transportation Institute Georgia Institute of Technology, 2005.
- P. T. McCoy and G. Pesti, “Effectiveness of ConditionResponsive Advisory Speed Messages in Rural Freeway Work Zones,” Transportation Research Record, Vol. 1794, 2002, pp. 11-18.
- L. H. Tudor, A. Meadors and R. Plant II, “Deployment of Smart Work Zone Technology in Arkansas,” Transportation Research Record, Vol. 1824, 2003, pp. 3-14.
- L. Chu, H.-K. Kim, Y. Chung and W. Recker, “Evaluation of Effectiveness of Automated Workzone Information Systems,” Transportation Research Record, Vol. 1911, 2005, pp. 73-81.
- T. King, C. Sun and M. Virkler, “Intellizone, Report to Widwest Smart Work Zone Initiative,” FHWA Pool Fund Study, 2003.
- A. J. Horowitz and T. Notbohm, “Evaluation of Intellizone: A System for Providing Speed Advisories to Drivers Entering Work Zones,” Report to Widwest Smart Work Zone Initiative, FHWA Pool Fund Study, 2003.
- G. Pesti, “D-25 Speed Advisory System,” Report to Widwest Smart Work Zone Initiative, FHWA Pool Fund Study, 2002.
- G. Pesti, P. T. McCoy, M. D. Meisinger and V. Kannan, “Work Zone Speed Advisory System, Report to Widwest Smart Work Zone Initiative,” FHWA Pool Fund Study, 2002.
- J. Stuster, Z. Coffman and D. Warren, “Synthesis of Safety Research Related to Speed and Speed Management,” Publication No. FHWA-RD-98-154, 1998.
- K. C. Sinha and S. Labi, “Transportation Decision Making: Principles of Project Evaluation and Programming,” John Wiley & Sons Inc., Hoboken, 2007. http://dx.doi.org/10.1002/9780470168073