Food and Nutrition Sciences
Vol.5 No.4(2014), Article ID:42786,13 pages DOI:10.4236/fns.2014.54048
Extraction of Total Phenolic Compounds, Flavonoids, Anthocyanins and Tannins from Grape Byproducts by Response Surface Methodology. Influence of Solid-Liquid Ratio, Particle Size, Time, Temperature and Solvent Mixtures on the Optimization Process
1Centre d’Analyses et de Recherche, UR TVA, Faculté des Sciences, Université Saint-Joseph de Beyrouth, Lebanon; 2UTC/ESCOM, EA 4297 TIMR, Département de Génie des Procédés Industriels, Laboratoire Transformations Intégrées de la Matière Renouvelable, Université de Technologie de Compiègne, Centre de Recherche de Royallieu, Compiègne, France.
Email: *richard.maroun@usj.edu.lb
Copyright © 2014 Hiba N. Rajha et al. This is an open access article distributed under the Creative Commons Attribution License, which permits unrestricted use, distribution, and reproduction in any medium, provided the original work is properly cited. In accordance of the Creative Commons Attribution License all Copyrights © 2014 are reserved for SCIRP and the owner of the intellectual property Hiba N. Rajha et al. All Copyright © 2014 are guarded by law and by SCIRP as a guardian.
Received November 19th, 2013; revised December 19th, 2013; accepted December 27th, 2013
KEYWORDS: Phenolic Compounds; Grape Byproducts; Extraction Optimization; Response Surface Methodology; Antioxidant
ABSTRACT
The current work concerns the optimization process of phenolic compounds solid liquid extraction from grape byproducts at high temperatures and short incubation times. The effect of five experimental parameters (solidliquid ratio, particle size, time, temperature and solvent mixture) mostly believed to affect the extraction process was undertaken. A first response surface methodology experimental design was used to optimize the solid-liquid ratio and milling time parameters. A second design was used for the optimization of the quantitative and qualitative parameters. The quantitative parameters studied are: total phenolic compounds, flavonoid content, total monomeric anthocyanin composition and tannin concentration. The qualitative parameters analyzed are: antiradical activity and antioxidant capacity. The second design was based on the use of time, temperature and solvent mixture as optimization parameters. The assays were first conducted separately revealing the best experimental conditions for the maximization of each response variable alone. A simultaneous response surface methodology of all the responses taken together was then conducted, showing the optimal extraction conditions to be: 93 minutes at 94˚C and in 66% ethanol/water solvent. The maximal response values obtained for each parameter are: Total Phenolic Compounds yield (5.5 g GAE/100g DM), Flavonoid Content (5.4 g GAE/100g DM), Total Monomeric Anthocyanin yield (70.3 mg/100g DM), Tannin Concentration (12.3 g/L), Antiradical Activity (67.3%) and Total Antioxidant Capacity (393 mgAAE/L). All of the optimal values were acquired at 3 mL/g solid-liquid ratio and 6.8 min milling time. The obtained extracts could be used as natural bioactive compounds in several industrial applications.
1. Introduction
The annual production of large waste quantities by the food processing industry creates serious environmental problems as a consequence of the absence of efficient policies regarding their disposal. Many processes are being established, targeting the conversion of waste materials into bio-fuels, food ingredients and other added value bio-products [1]. Wine wastes, consisting mainly of skins, seeds and stems and representing 20% of the processed grapes weight, are considered as valuable coproducts due to their important phenolic compounds content [2]. Many studies have been conducted on phenolic compounds extraction and purification from grape pomace. Pinelo et al. [3] examined the influence of many extraction parameters on the phenolic content and antiradical activity of grape pomace extracts. As for novel electrotechnologies, Bousetta [4] used high pulsed electric field treatment for phenolic compounds extraction from grape pomace. Rajha et al. [5] used accelerated solvent extraction to maximize phenolics extraction from grape pomace varying the extraction temperature and solvent mixture. Divided into two major groups (nonflavonoids and flavonoids), phenolic compounds show antioxidant and radical scavenging activities possibly responsible for many health benefit effects [6]. They also appeared to have promising applications in food industries, pharmaceuticals and cosmetics. The extraction process is commonly used in the food industry, mainly for the production of several compounds found in different food matrixes [4,7]. In general, the optimization of the quantity and quality of a certain compound is undoubtedly the major target of an extraction process [8]. Besides the time consuming procedure of the one-factorat-a-time optimization method, the interactions between the extraction parameters might be unnoticed. Hence, it is improbable to approximate the true optimal experimental condition [9]. Response surface methodology (RSM), firstly described by Box and Wilson [10], permits to overcome the drawback of this design optimization. RSM was demonstrated to be a potent tool in optimizing experimental parameters maximizing numerous responses [11]. Central composite design, which is one of the most common designs, has been widely used to optimize phenolic compounds extraction from grapes [12] and grape pomace [13]. In classical extraction methods, the major parameters believed to affect the effectiveness of the procedure and the quality of the extracts are: temperature, contact time, extraction solvent, solid-liquid ratio, and particle size [14]. In this study, two experimental designs were proposed to study the effects of the five major parameters on the extraction process. The optimal particle size and solid-liquid ratio were firstly determined and then applied in the second experimental design, which was conducted to analyze the effect of time, temperature and solvent mixture on the quality and quantity of the extracts. The final target of this study was to optimize the experimental parameters capable of reducing the energy cost of phenolic compounds extraction from grape pomace, taking into consideration the conservation of the diversity as well as the quantity and the bioactivity of the obtained extracts. A simultaneous optimization of the total phenolic compounds, the flavonoids content, the anthocyanins composition, the tannin concentration, the free radical scavenging activity and the total antioxidant capacity was realized in order to produce highly bioactive compounds which could be used in several industrial application.
2. Materials and Methods
2.1. Reagents
All reagents were of analytical grade. The Folin’s phenol reagent (SCOTT SCIENCE UK) and sodium carbonate (Fluka, Buchs, Switzerland) were utilized to measure the total phenolic compounds concentrations using the FolinCiocalteu method; the calibration curve was built with gallic acid (Sigma Chemical Co., St. Louis, MO, USA).
2.2. Sample Preparation
The Cabernet Sauvignon grape byproducts were provided by château KSARA (Beqaa Valley, Lebanon). On arrival the raw material was stored at −20˚C. Defrosted at room temperature, the grape byproducts were milled to fit the required particle size. After the solid-liquid extraction process with the heated solvent and under agitation, solids were separated by filtration [3]. The dry matter content in the grape pomace was 67 ± 0.9%.
2.3. Total Phenolic Compounds Determination (TPC)
According to the Folin-Ciocalteu method previously described by Slinkard and Singleton [15], an aliquot of 10 μL of the sample solution was mixed with 100 μL of commercial Folin-Ciocalteu reagent and 1580 μL of water. After a brief incubation at room temperature (5 min), 300 μL of saturated sodium carbonate was added. The color generated was read after 2 h at room temperature at 760 nm using a UV-Vis spectrophotometer (UV-9200, BioTECH Engineering Management, UK). The correlation between the absorbance and gallic acid concentrations creates a calibration standard curve. The phenolic compounds concentration of the samples was expressed as gallic acid equivalents in mg/L, then the Total Phenolic Compounds yields (TPC) were calculated by transforming milligrams of Gallic Acid Equivalent (GAE) per liter (mg GAE/L) into grams of GAE per 100 g of grape dry matter (g GAE/100g DM).
2.4. Flavonoid Content (FC)
The indirect method of flavonoid determination was performed as described by Ough and Amerine [16], through the precipitation of those compounds by formaldehyde. Five milliliters of aqueous solution of hydrochloric acid 1:4, and 5 mL of formaldehyde 37% were added to 10 mL of the sample. The sample was filtered after a 24 hour standstill period, and used for the non-flavonoid content determination by Folin-Ciocalteu method. The difference between the total phenolic and the non-flavonoid contents results in the calculation of the flavonoid content expressed as gallic acid equivalents (mg/L). Then, the Flavonoid Content yield (FC) was calculated by transforming milligrams of Gallic Acid Equivalent (GAE) per liter (mg GAE/L) into grams of GAE per 100 g of grape dry matter (g GAE/100g DM).
2.5. Total Monomeric Anthocyanin Determination (TMA)
Monomeric anthocyanins were measured by the pH-differential method, which relies on the structural transformation of the anthocyanin chromophore as a function of pH, which can be measured using optical spectroscopy [17]. The appropriate dilutions of each sample were prepared, once with potassium chloride buffer at 0.025 M (pH 1.0) and the other with sodium acetate buffer at 0.4 M (pH 4.5). The dilutions were equilibrated for 15 min. The absorbance of each dilution was measured at the λvis-max and at 700 nm against a blank cell filled with distilled water. The absorbance (A) of the diluted sample was calculated as follows:
A = (Aλvis-max − A700)pH1 − (Aλvis-max − A700)pH4.5(1)
The monomeric anthocyanin pigment (MAP) concentration in the original sample was calculated using the following formula:
MAP(mg/L) = (A × MW × DF × 1000)/(molA × L)(2)
MW and molA are the molecular weight and the molar absorptivity, respectively of the pigment cyanidin-3-glucoside used as reference; MW = 449.2 g/mole, molA = 26,900 mg−1·L−1·cm−1 and DF is the dilution factor. Milligrams of Monomeric Anthocyanin per liter of extract (mg/L) were then transformed into Total Monomeric Anthocyanin yield (TMA) which is milligrams per 100 grams of grape dry matter (mg/100g DM).
2.6. Determination of Tannin Concentration (TC)
Total tannin content (g/L) was determined according to Ribérau-Gayon et al. [18]. 2 mL of 1:50 diluted sample and 6 mL of 12 N HCl were mixed and heated in a water bath for 30 min. Following the rapid cooling, 1 mL of ethanol was added to the mixture, and the resulting absorbance at 550 nm was measured.
2.7. Antioxidant and Antiradical Assays
2.7.1. Total Antioxidant Capacity (AC)
The total antioxidant activity of the extracts was determined by the phosphomolybdenum reduction assay [19]. The basic principle of the method is the formation of a green phosphate Mo (V) complex at acidic pH. The extracts reduce Mo (VI) to Mo (V). Diluted extracts (500 mg/L) were mixed with the reagent solution (0.6 M sulfuric acid, 28 mM sodium phosphate and 4 mM ammonium molybdate). The samples were incubated at 90˚C for 90 minutes and the absorbance of the solution was measured at 695 nm. The antioxidant activity is expressed as mg of Ascorbic Acid Equivalent per Liter (mgAAE/L).
2.7.2. Antiradical Activity (AA)
According to Kallithraka et al. [20], the free radical scavenging activity was measured by the capacity of the phenolic compounds contained in the samples to reduce DPPH (2,2-diphenyl-picrylhydrazyl), a stable free radical. The antiradical activity of extracts was examined by comparing to those of known antioxidants such as butylhydroxytoluene (BHT) (a synthetic antioxidant) and resveratrol (a natural antioxidant) by DPPH. 50 mL of diluted extracts or positive control (BHT and resveratrol) (50 mg/mL) were added to 450 mL of Tris-HCl buffer solution (50 mM, pH 7.4). 1.5 mL of DPPH solution (0.1 mM) was added to the mixture. Absorbance at 517 nm was measured after 30 min of incubation at room temperature using pure Methanol as a blank. The inhibition percentage of the DPPH free radical is calculated as follows: Inhibition Percentage = [(absorbance of negative control − absorbance of sample)/absorbance of negative control] × 100. The free radical scavenging activity of Cabernet Sauvignon grape byproducts extracts was evaluated by the decrease in the peak area of the DPPH radical which exhibits a deep purple color with maximum absorption at 517 nm. Antioxidant molecules can quench DPPH free radicals, resulting in the discoloration of the DPPH because of their conversion into a colorless product.
2.8. Experimental Design
The quantity and quality of the phenolic compounds extracts are affected by several factors. Regarding the incapacity of identifying all parameters effects at the same time, it was necessary to group the parameters into two experimental designs.
2.9. Optimization of Particle Size and Solid-Liquid Ratio (L/S)
A central composite design (22 + star) was established to assess the main effect of two factors in 12 runs. The influence of particle size and solid-liquid ratio on the phenolic compounds extraction from grape pomace was studied. Particle size was estimated by the duration of the milling process going from 2 to 6 minutes. Solid-liquid ratio (L/S) varied from 2.31 mL/g to 8.69 mL/g. Time, temperature and solvent mixture were fixed to 24 hours, room temperature, and 70% ethanol/water solvent. The two independent variables were coded at five levels (−α1, −1, 0, 1, α1) resulting in an experimental design of twelve experimental points including four repetitions at the central points. The optimization process by response surface methodology, took into consideration particle size and solid-liquid ratio as two independent variables. Considering two parameters and a response, experimental data were fitted to obtain a second-degree regression equation of the form:
Y = β0 + β1T + β2R + β12T·R + β11T2 + β22R2(3)
where Y is the predicted response parameter, T is the time of the milling process representing the particle size, R is the solid-liquid ratio, β0 is the mean value of response at the central point of the experiment; β1 and β2 are the linear coefficients, β11 and β22 the quadratic coefficients and β12 the interaction coefficient. The values of independent variables where the response TPC is the highest enables the identification of the optimal extraction conditions for the maximization of the response. Experimental design and statistical treatment of the results were performed using STATGRAPHICS Plus 4.0 for Windows.
2.10. Optimization of Temperature, Time and Solvent Mixture
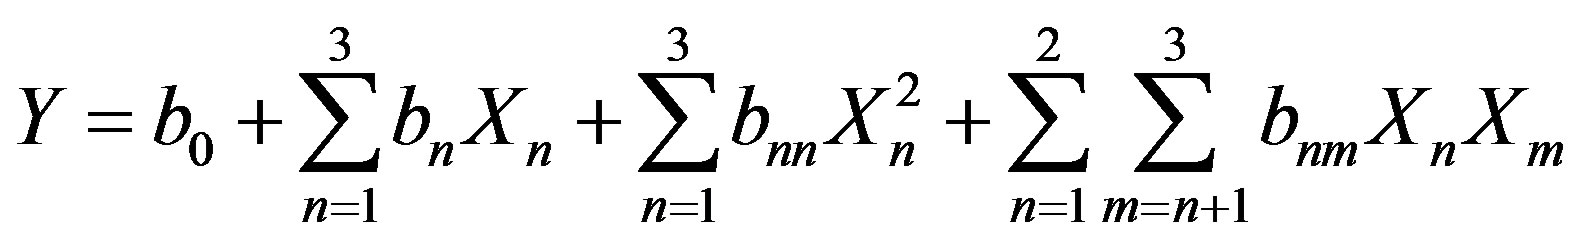
The choice of the time and temperature intervals was the result of a preliminary study in which phenolic compounds extraction from milled grape pomace was conducted at high temperatures and short periods of time. The total phenolic content and the free radical scavenging activity were determined after 30, 60, and 90 minutes. Based on the results, the lower and upper levels of both variables were chosen for the Response Surface Methodology. For the optimization process of time, temperature and solvent mixture, a Central composite design (23 + star) was created to study the effects of 3 factors in 20 runs. Time varied from 40 to 99 minutes, temperature from 40˚C to 80˚C and solvent mixture from 30% to 80% ethanol/water (v/v). The three independent variables were coded at five levels (−α2, −1, 0, 1, α2) resulting in an experimental design of twenty experimental points including six central points. Six responses where studied: Total phenolic compounds yield (TPC), flavonoid content (FC), total monomeric anthocyanin content (TMA), tannin concentration (TC), antiradical activity (AA), and total antioxidant capacity (AC). The values of independent variables where the response variables are the highest enables the identification of the optimal extraction conditions for the maximization of the responses. Considering two parameters and six responses, experimental data were fitted to obtain a second-degree regression equation of the form:
 (4)
(4)
where Y is the predicted response Xn and Xm are the coded values for the factors, b0 is the mean value of the responses at the central point of the experiment; bn, bnn, and bnm are respectively the linear, quadratic, and interaction coefficients. A multi-response surface optimization was effected to maximize all the responses at the same time. Experimental design and statistical treatment of the results were performed using STATGRAPHICS Plus 4.0 for Windows.
3. Results and Discussion
3.1. Experimental Design for Solid-Liquid Ratio and Particle Size
A first response surface methodology study was conducted in the aim of determining the adequate solid-liquid ratio and particle size for the optimization of phenolic compounds extraction from grape pomace. The response values (TPC) at different variable combinations and statistical analyses showed that all response values fitted best the second order polynomial model, which the correspondent equation is shown as follows:
 (5)
(5)
where T is the milling time and R the solid-liquid ratio.
The model had a satisfactory level of adequacy (R2 = 84%), indicating a reasonable agreement of the corresponding model with the experimental results. Statistically considered as significant, the solid-liquid ratio has a negative linear and quadratic effect on the PCY. Pinelo et al. [3] obtained the highest phenolic concentration and antiradical activity by lowering the solvent-to-solid ratio. On an industrial scale, the solid-liquid ratio of phenolic compounds extraction from the winemaking wastes was shown to be 5 mL/g [4], while in this work it was shown to be 3 mL/g. From an economic perspective, our optimization process leads to the reduction of solvent volume, consequently diminishing the overall cost of the process. As can be seen in Figure 1, TPC values increase when the milling time increases, while they decrease when the solid-liquid ratio increases. Particle size reduction is expected to increase the extraction yield, since it enhances the accessible superficial area for mass transfer [21].
Meyer [22] improved phenolic extraction efficiency by reducing the particle size. The extraction rate is increased since the diffusion distance of the solute within the solid is decreased when particle size is smaller; therefore a shorter time is required for the solute to reach the surface [23]. The optimal parameters found in this study were a solid-liquid ratio of 3 mL/g and a 6.8 minutes milling time. These parameters gave a maximal TPC of 0.966 g GAE/100g DM.
3.2. Experimental Design for Time, Temperature and Solvent Mixture
In the purpose of determining the experimental conditions for the optimization of TPC, FC, TMA and TC so as for the maximization of the bioactivity represented by the Antiradical Activity (AA) and the Antioxidant Capacity (AC), a response surface methodology study was performed using a rotatable central composite design. Using ethanol/water mixtures, the TPC ranged from 2.1 to 5.8 g GAE/100g DM, the FC from 2.1 to 5.8 g GAE/100g DM, the TMA from 28.6 to 72.5 mg/100g DM, the TC from 4.8 to 13.7 g/L, the AA from 47.9 to 67.3%, and the AC from 310.7 to 404.5 mg AAE/L. Considering the variability of the extraction parameters (time, temperature, solvent mixture), the starting material (seeds, skins, pomace) and its pre-treatment, a comparison of our study with all other published results could not be entirely done. Nevertheless a general evaluation with
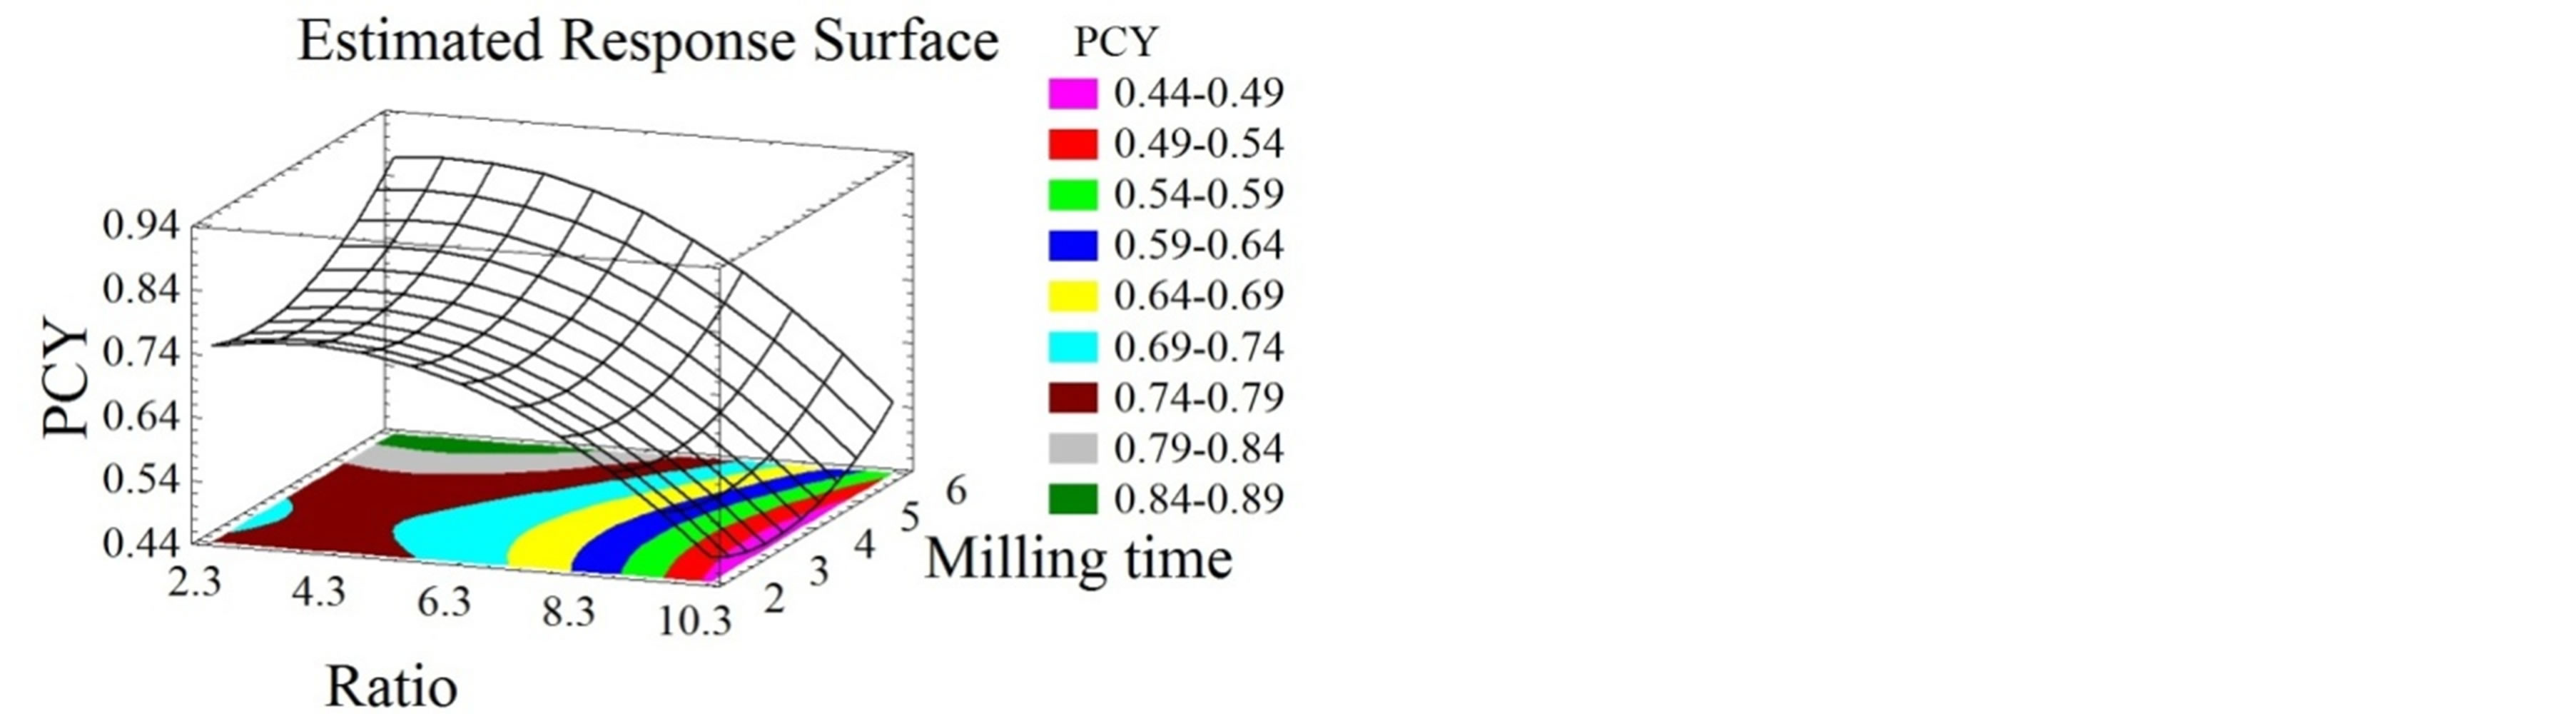
Figure 1. Phenolic compounds concentration surface plots. Three-dimensional expressions by surface plots of Phenolic Compounds Yield. The three-dimensional graphs were plotted between two independent variables (particle size and solid liquid ratio).
other extraction processes from grapes, grape parts and byproducts could give a clear idea about the extraction efficiency. Concerning the TPC extracted from grape pomace, Spigno and De Faveri [8] obtained 0.27% GAE, Lapornik et al. [24] 0.035% - 1.36% GAE, and Rajha et al. [13] 0.2% - 0.7% GAE. Antolovich [25] reported that the upper total phenolic compounds limit could reach 6 g GAE/100g DM in aqueous methanol extraction. In this study phenolic compounds extraction from grape pomace using aqueous ethanol mixtures had higher yields than the majority of the reported studies and seems to be very close to the upper limit [25]. TC of the extracts was higher than that obtained by El Darra et al. [26] for extracts obtained from Cabernet Franc grapes following pulsed ohmic heating. The TMA range was close to the one obtained by El Hajj et al. [12] (69.16 mg/100g from fresh weight) but lower than Revilla et al. [27] who obtained 111 mg/100g from entire fresh grapes. The TMA quantity obtained in this study is acceptable especially that the optimization of this individual class was not the main goal of our work and no specific solvent, such as acidified methanol [28] or water + sulfur dioxide [4], was used for favoring their extraction process. The highest AA found in this study (67.3%) was higher than that obtained by El Darra et al. [29] on some grape varieties extracts (Syrah (65%) and Cabernet Franc (52%)) while it was lower than some others (Merlot (71%) and Cabernet Sauvignon (75%)) [29]. The maximal AC found in this study was similar to that obtained by Ghafoor et al. [30] when applying Supercritical Fluid extraction at 37˚C, 140 kg·cm−2 and 5% ethanol as modifier, for the extraction of phenolic compounds from grape (Vitis labrusca B.) peel. Thus, our results taken all together were found to be in agreement with several previous published works.
3.3. Experimental Modeling and Statistics
All response values were demonstrated by statistical analyses to fit best the second order polynomial equations expressing the relation between the experimental parameters and the response variables (Data not shown). The regression models permitted the calculation of the predicted values, analyzed for the calculation of the coefficients of determination (R2). The models had high and satisfactory levels of adequacy shown by the closeness to 1 of the (R2) values (0.918, 0.92, 0.813, 0.863, 0.86 and 0.866 for TPC, FC, TMA, TC, AA and AC, respectively), indicating a high degree of correlation between all observed and predicted values. This means that a reasonable agreement of the corresponding model with the experimental results was found.
3.4. Effect of Extraction Parameters on TPC
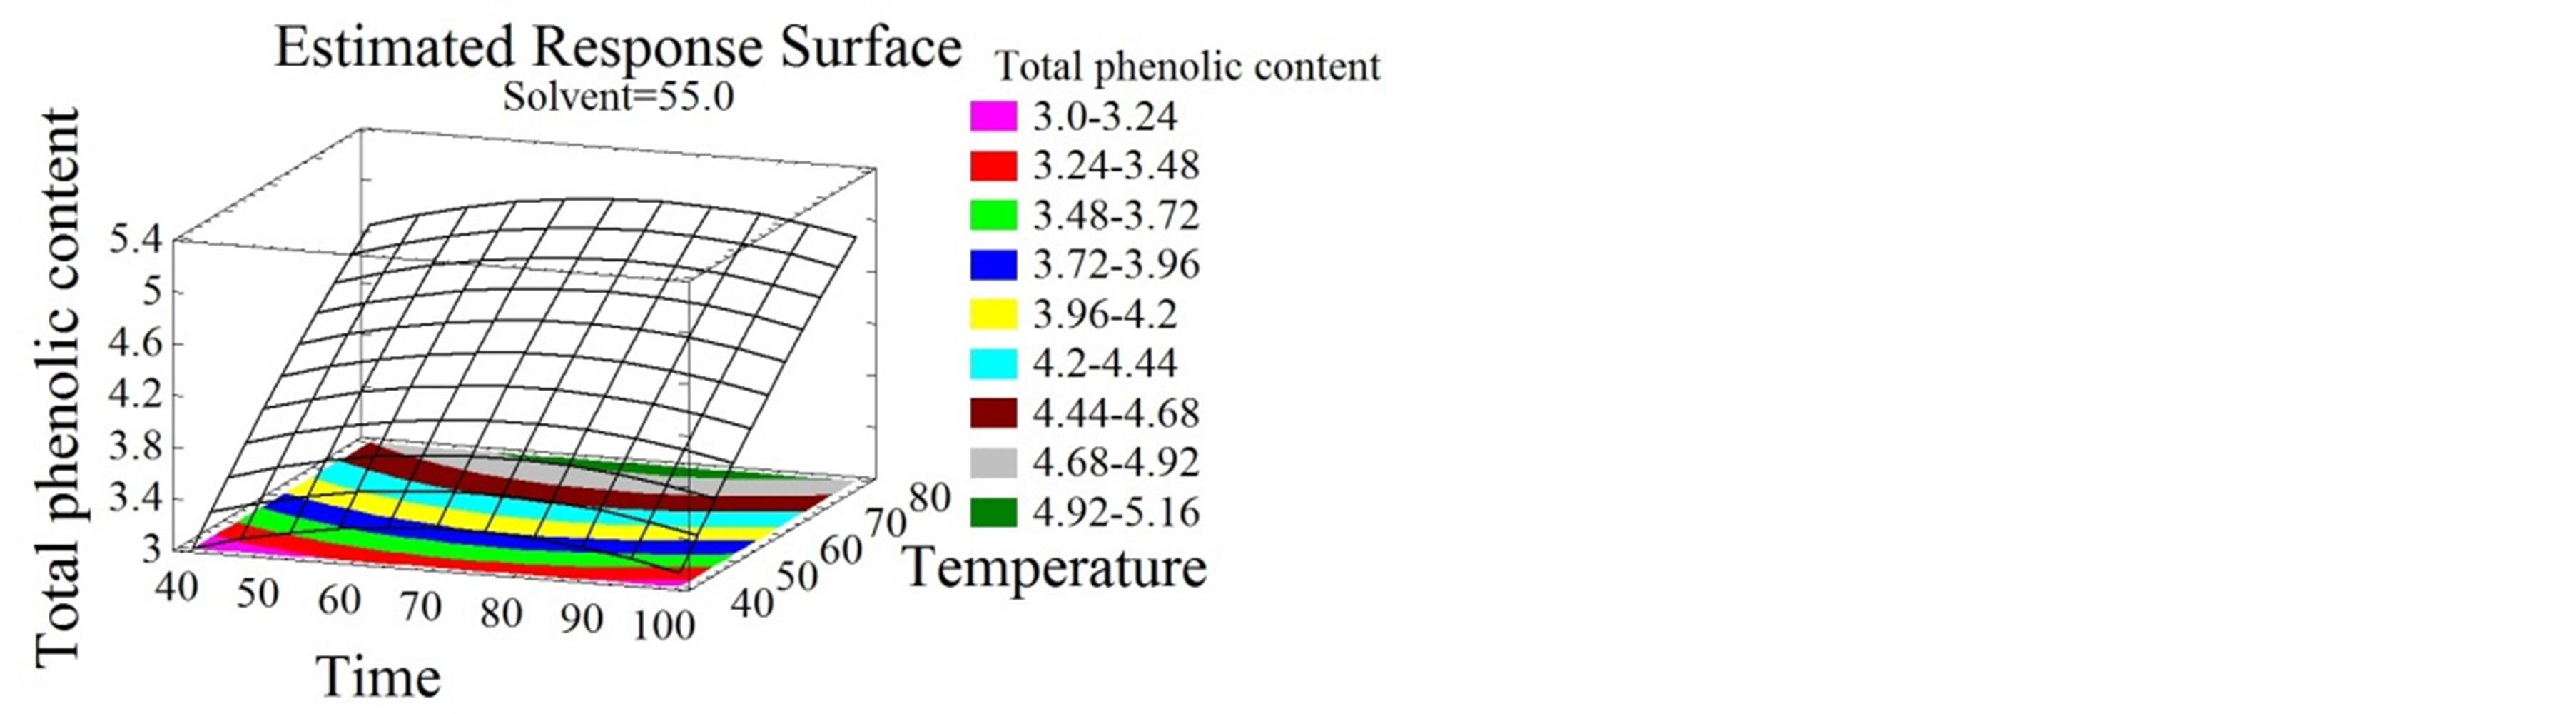
The response surface plots shown in Figures 2, 3 and 4 give by their shapes, information about the significance of each experimental parameter. It can be noticed from Figures 2(a) and (b) that temperature had a positive linear effect on TPC since it increased with temperature increase to reach an optimum of 94˚C. The enhancing capacity of the temperature parameter on the extraction efficiency of phenolic compounds was reported by many authors [5,8,21]. It ameliorates the mass transfer, improves the solubilization of the solutes in the solvent and reduces the surface tension and viscosity [31]. Nevertheless, and beyond a certain value the denaturation of the phenolic compounds can occur. This limit temperature is different amongst extraction studies; it is 50˚C for some [11] or 60˚C for others [21]. Regarding the duration of the extraction process, short [3,32,33] and long extraction periods can be found in the literature [34,35]. In this study the temperature was elevated and the time was reduced. The latter showed a negative quadratic effect on the TPC (Figure 2(c)) contrarily to that obtained by El Hajj et al. [12] who noticed an increase in total phenolics with the increase of time. This contradiction is probably due to the high temperatures employed in this study, which require short periods of time to avoid the degradation of the phenolic compounds. At short periods of time
 (a)
(a) (b)
(b)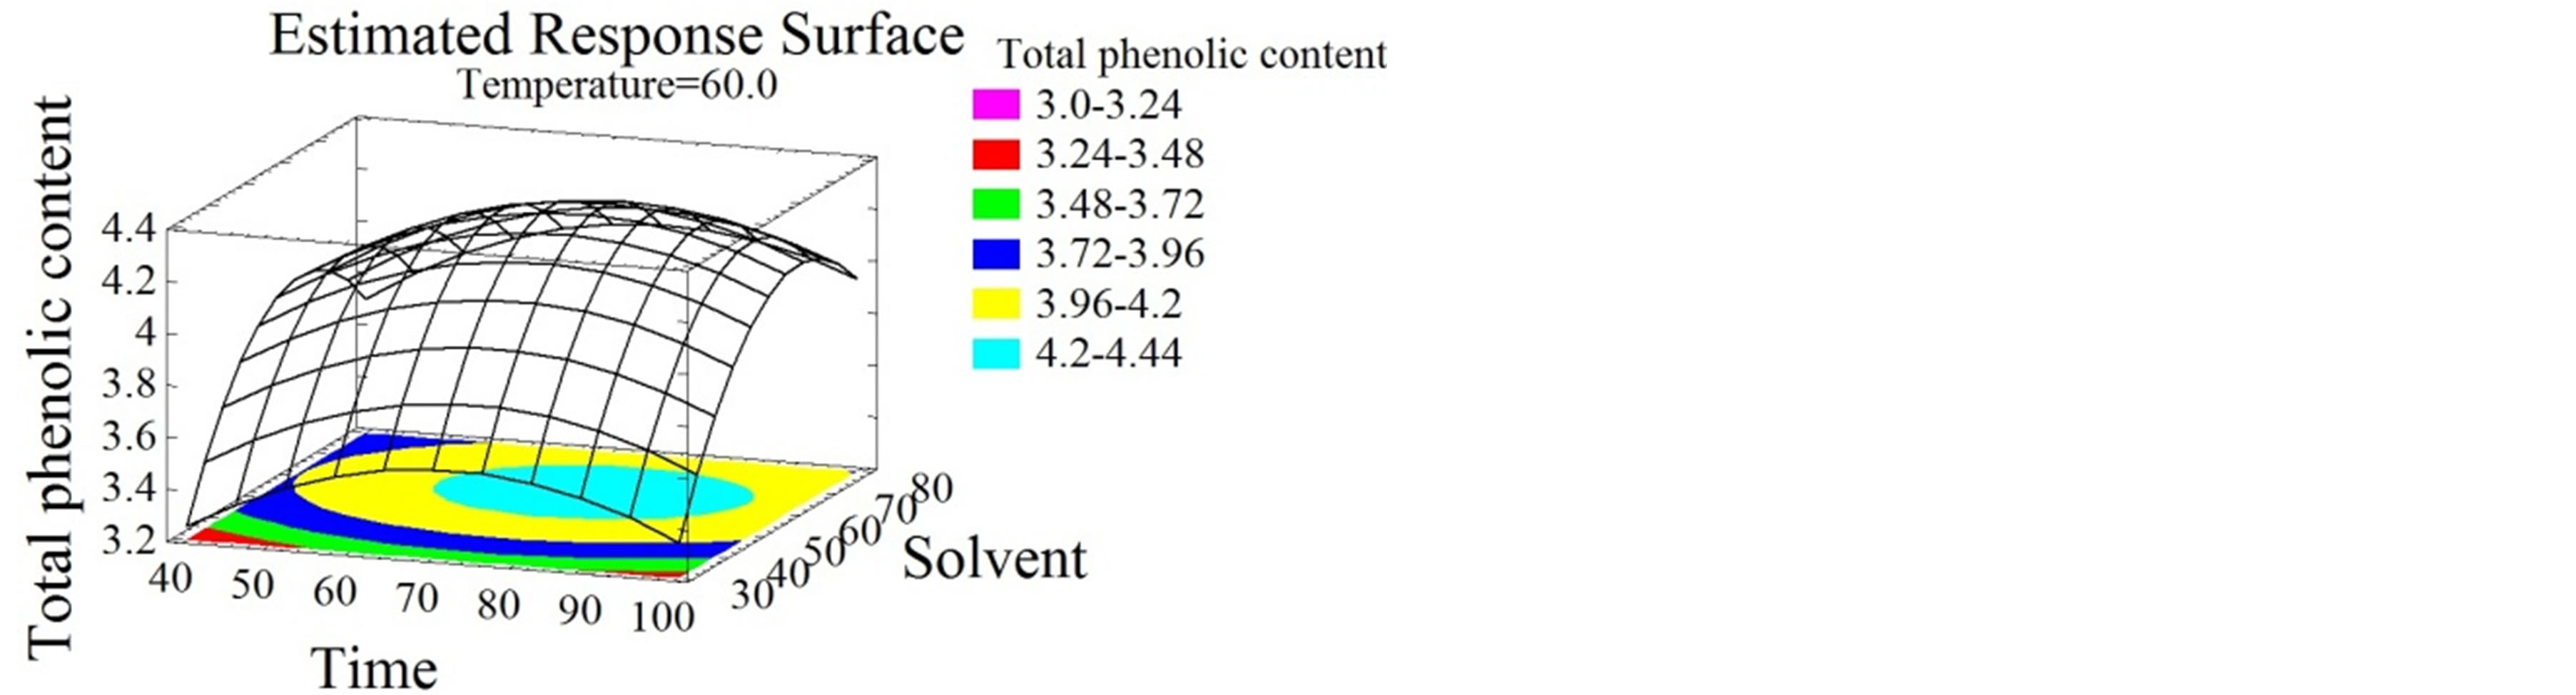 (c)
(c)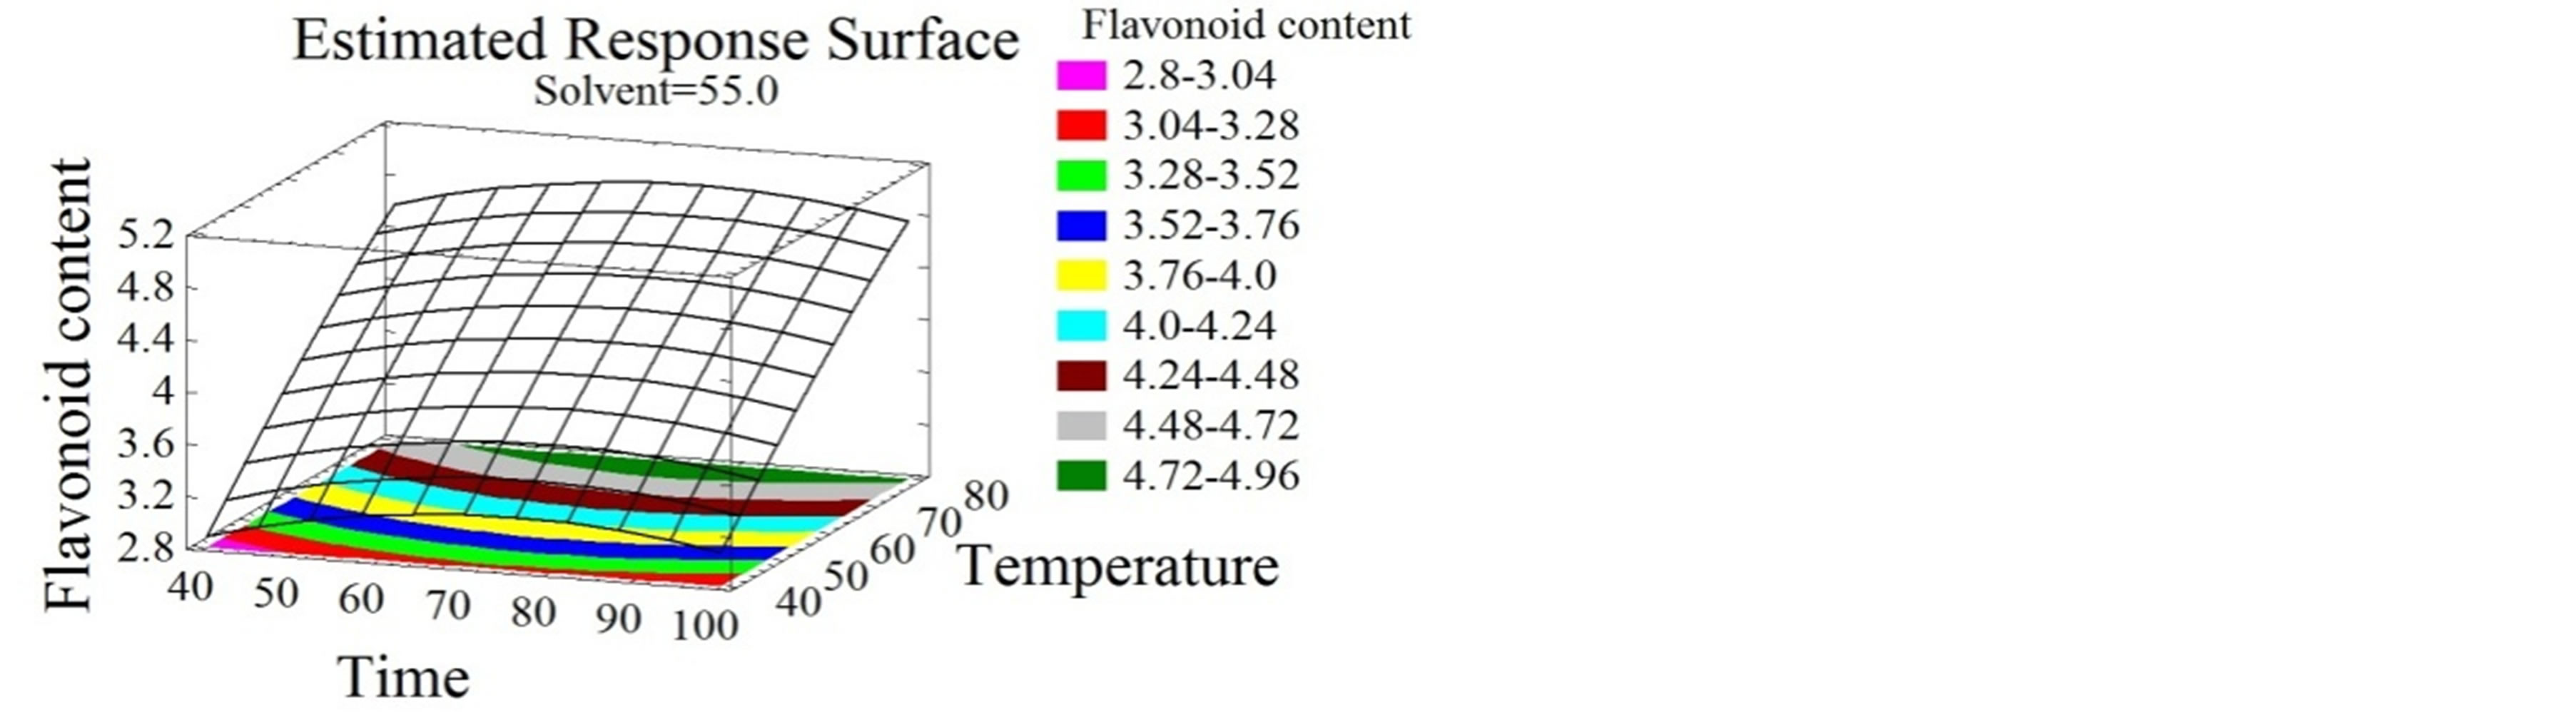 (d)
(d)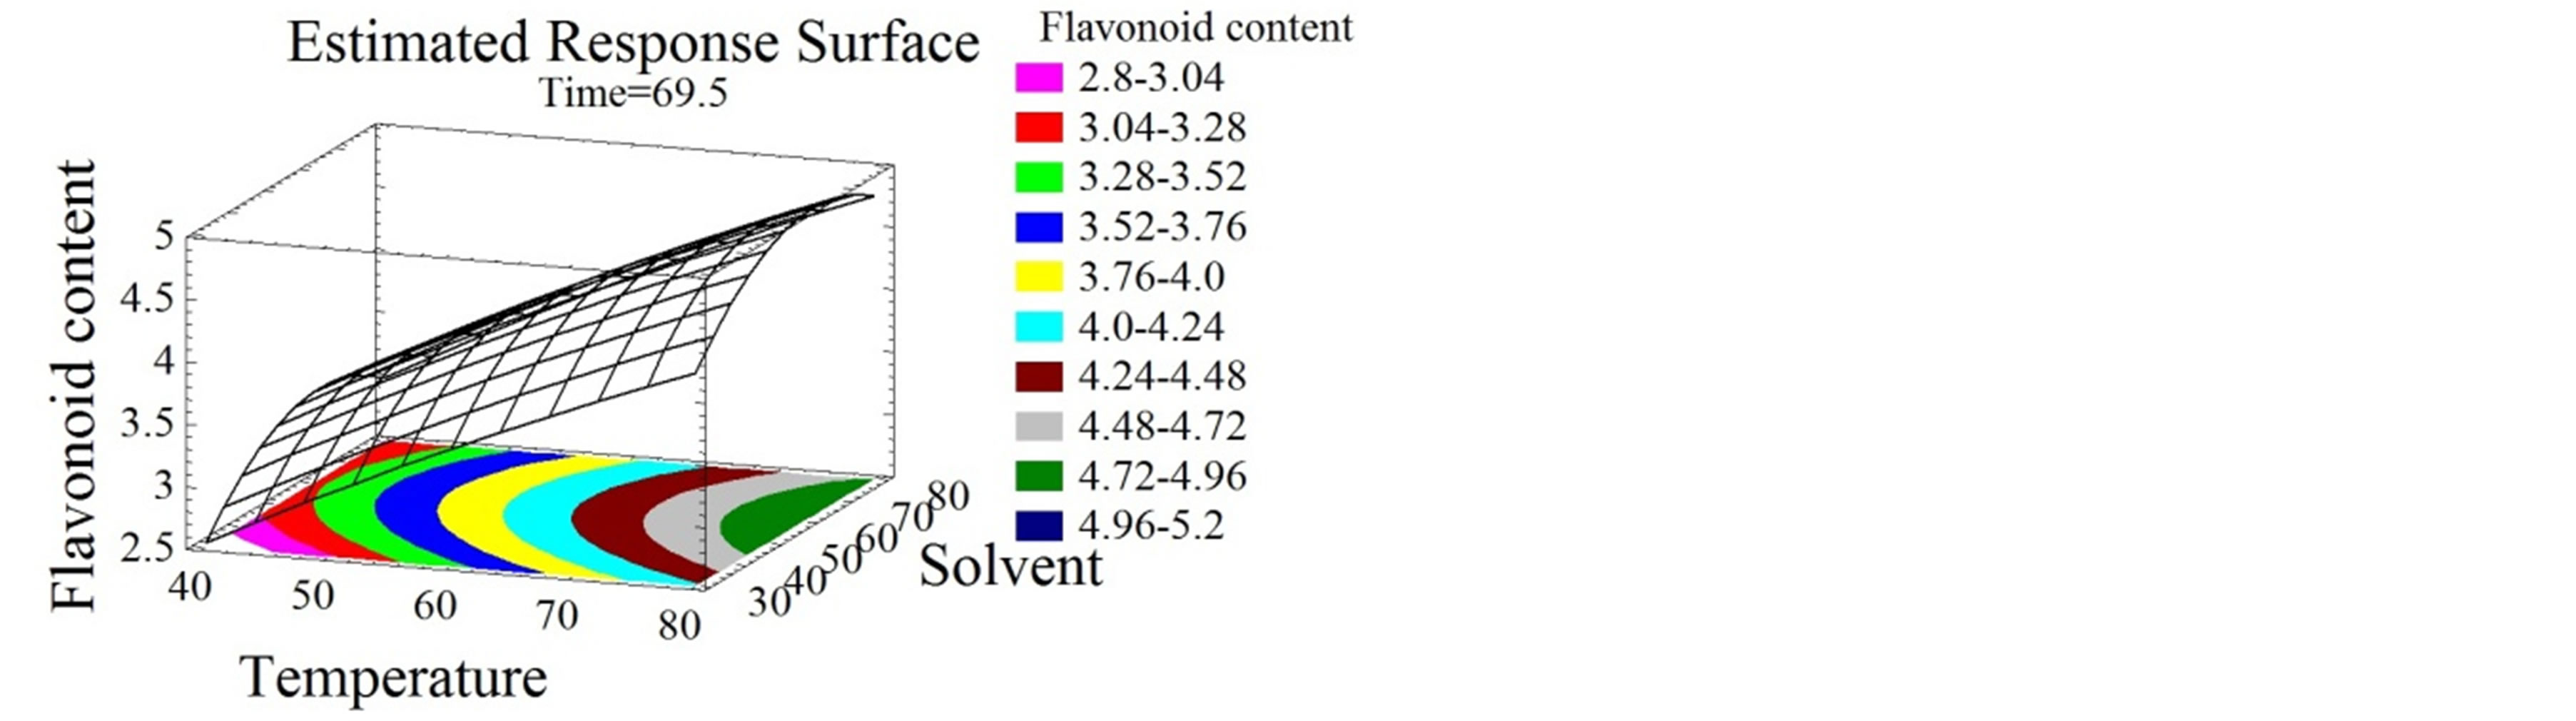 (e)
(e)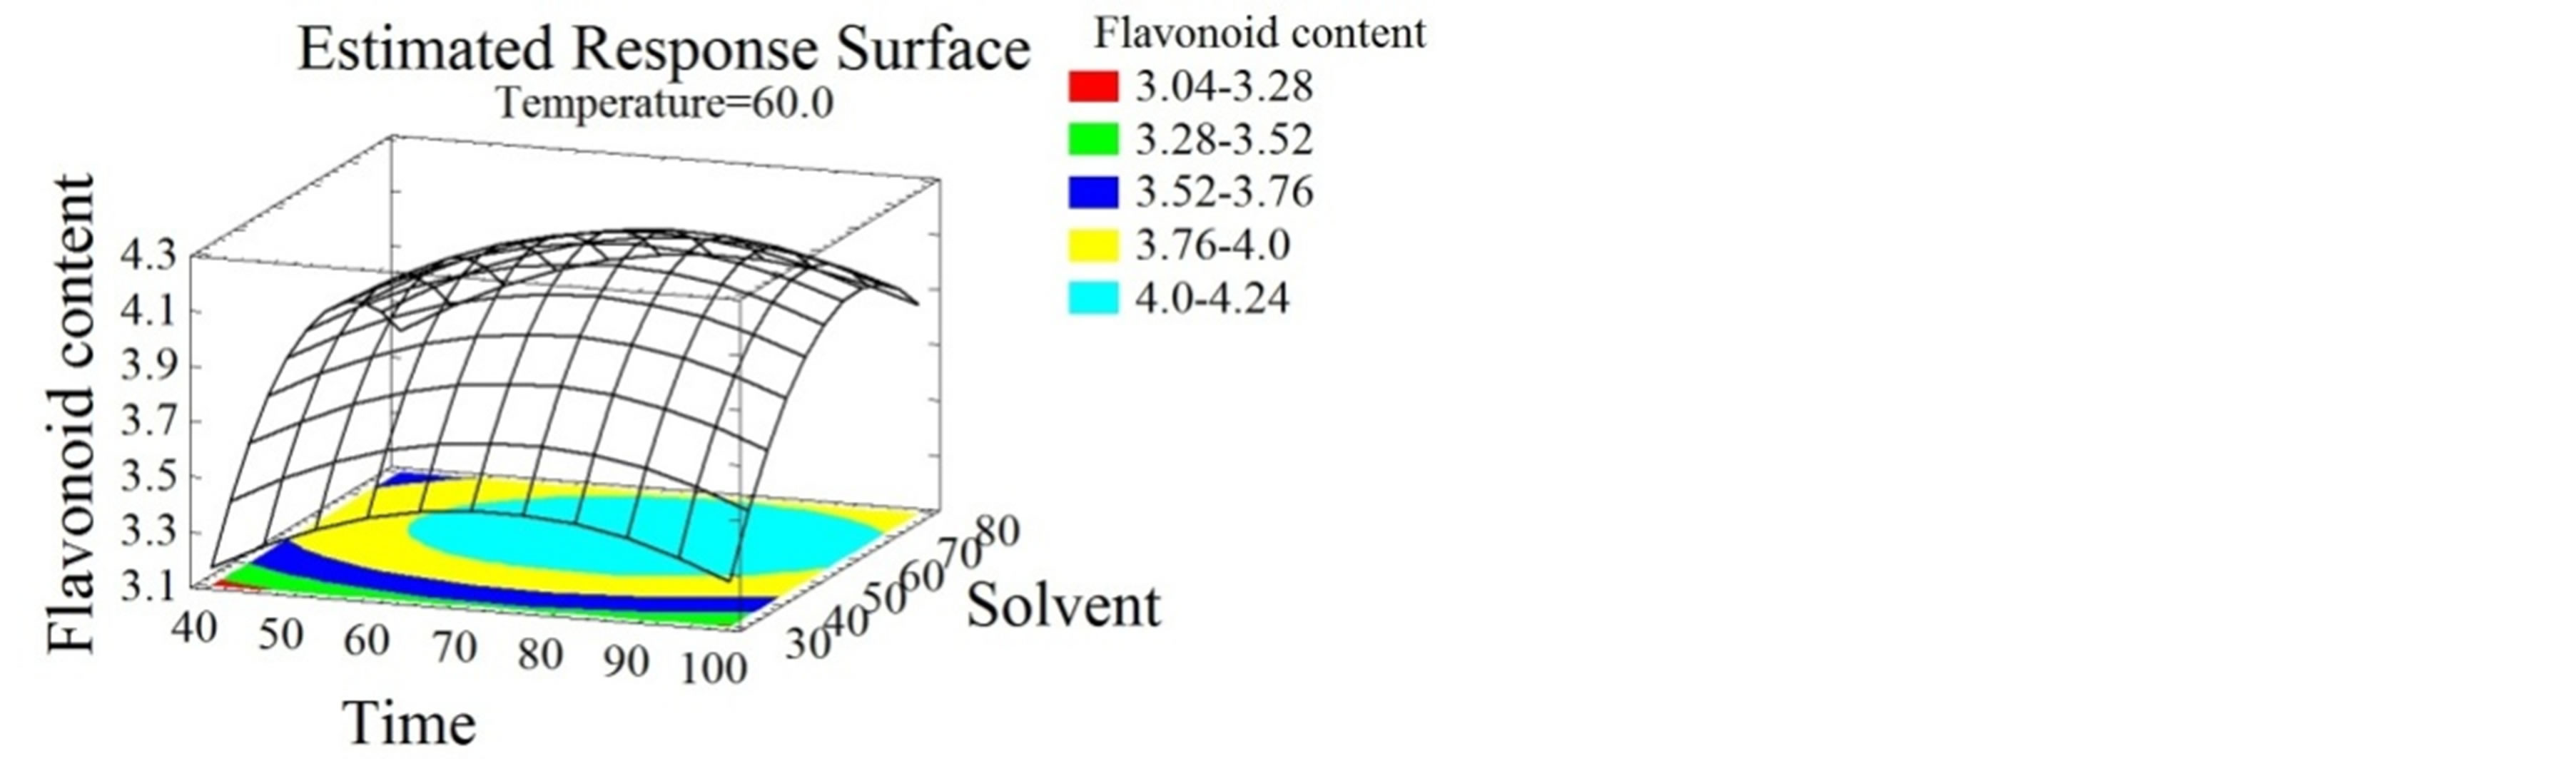 (f)
(f)
Figure 2. Total phenolic content and flavonoid content surface plots. Three-dimensional expressions by surface plots of TPC and FC. The three-dimensional graphs were plotted between two independent variables while the remaining independent variable was kept at its zero level.
 (a)
(a) (b)
(b)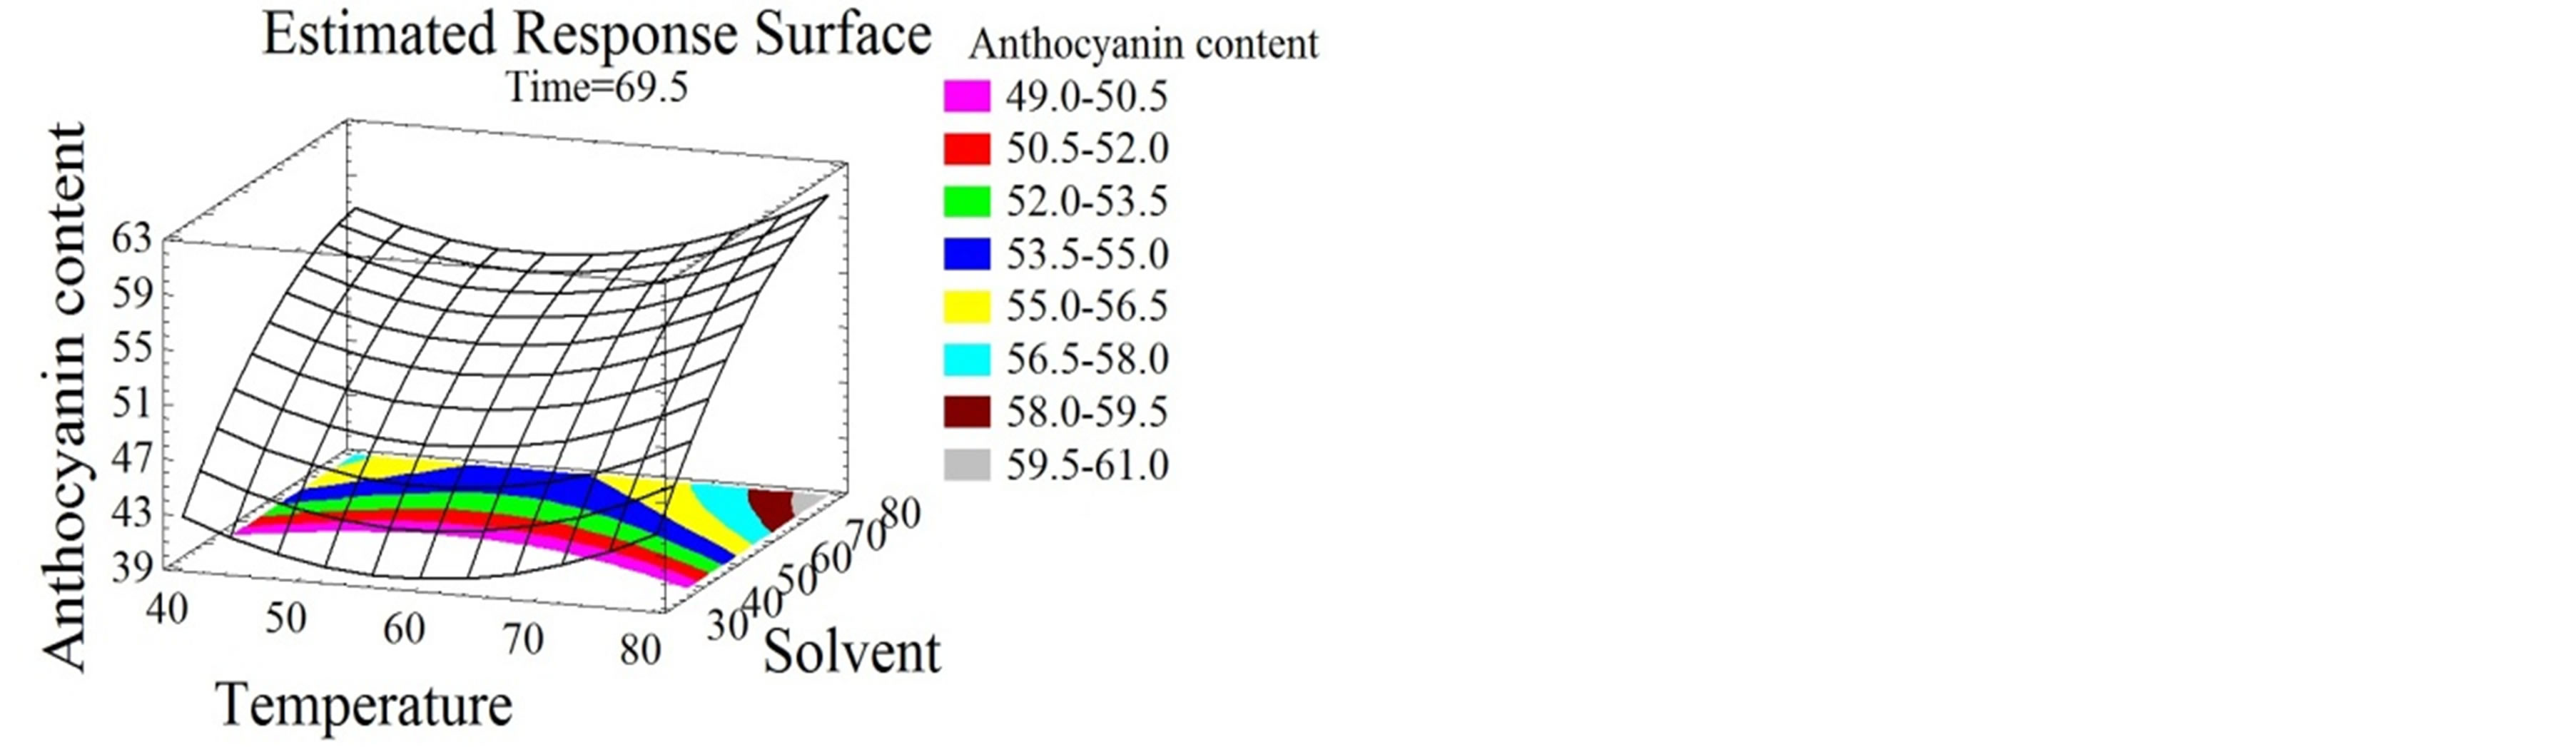 (c)
(c)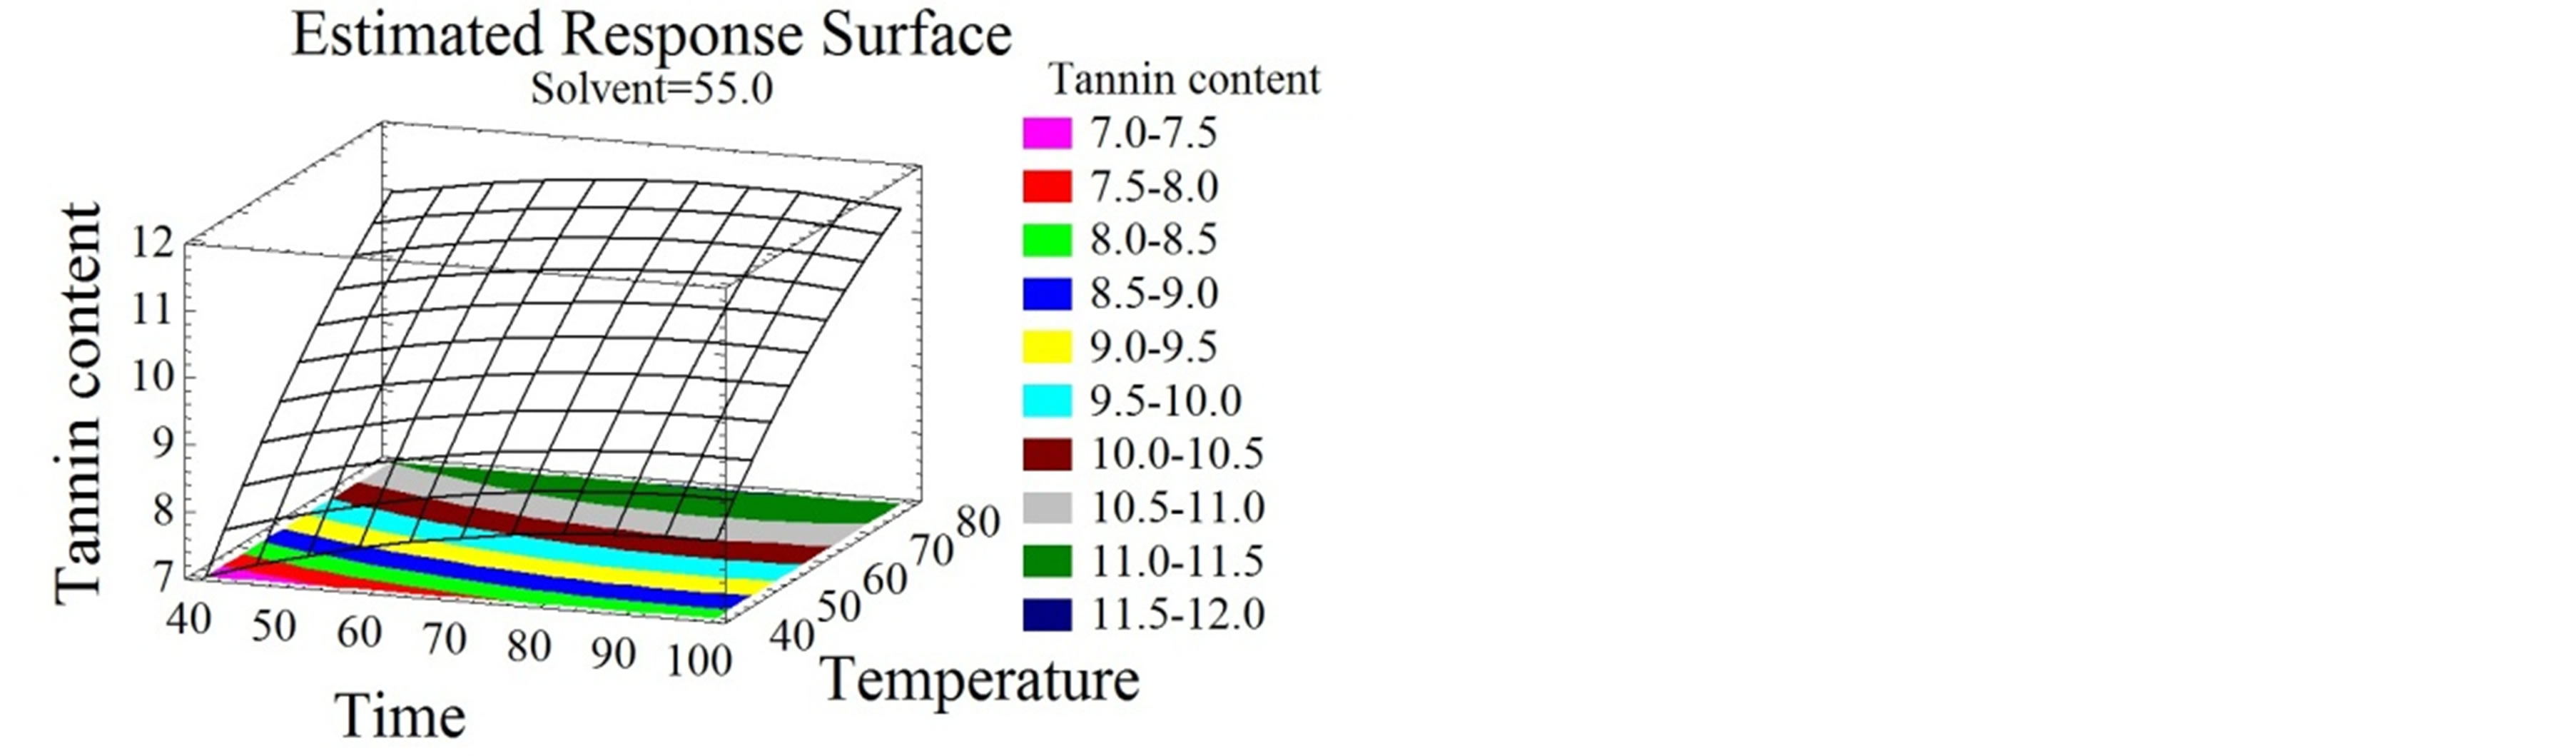 (d)
(d)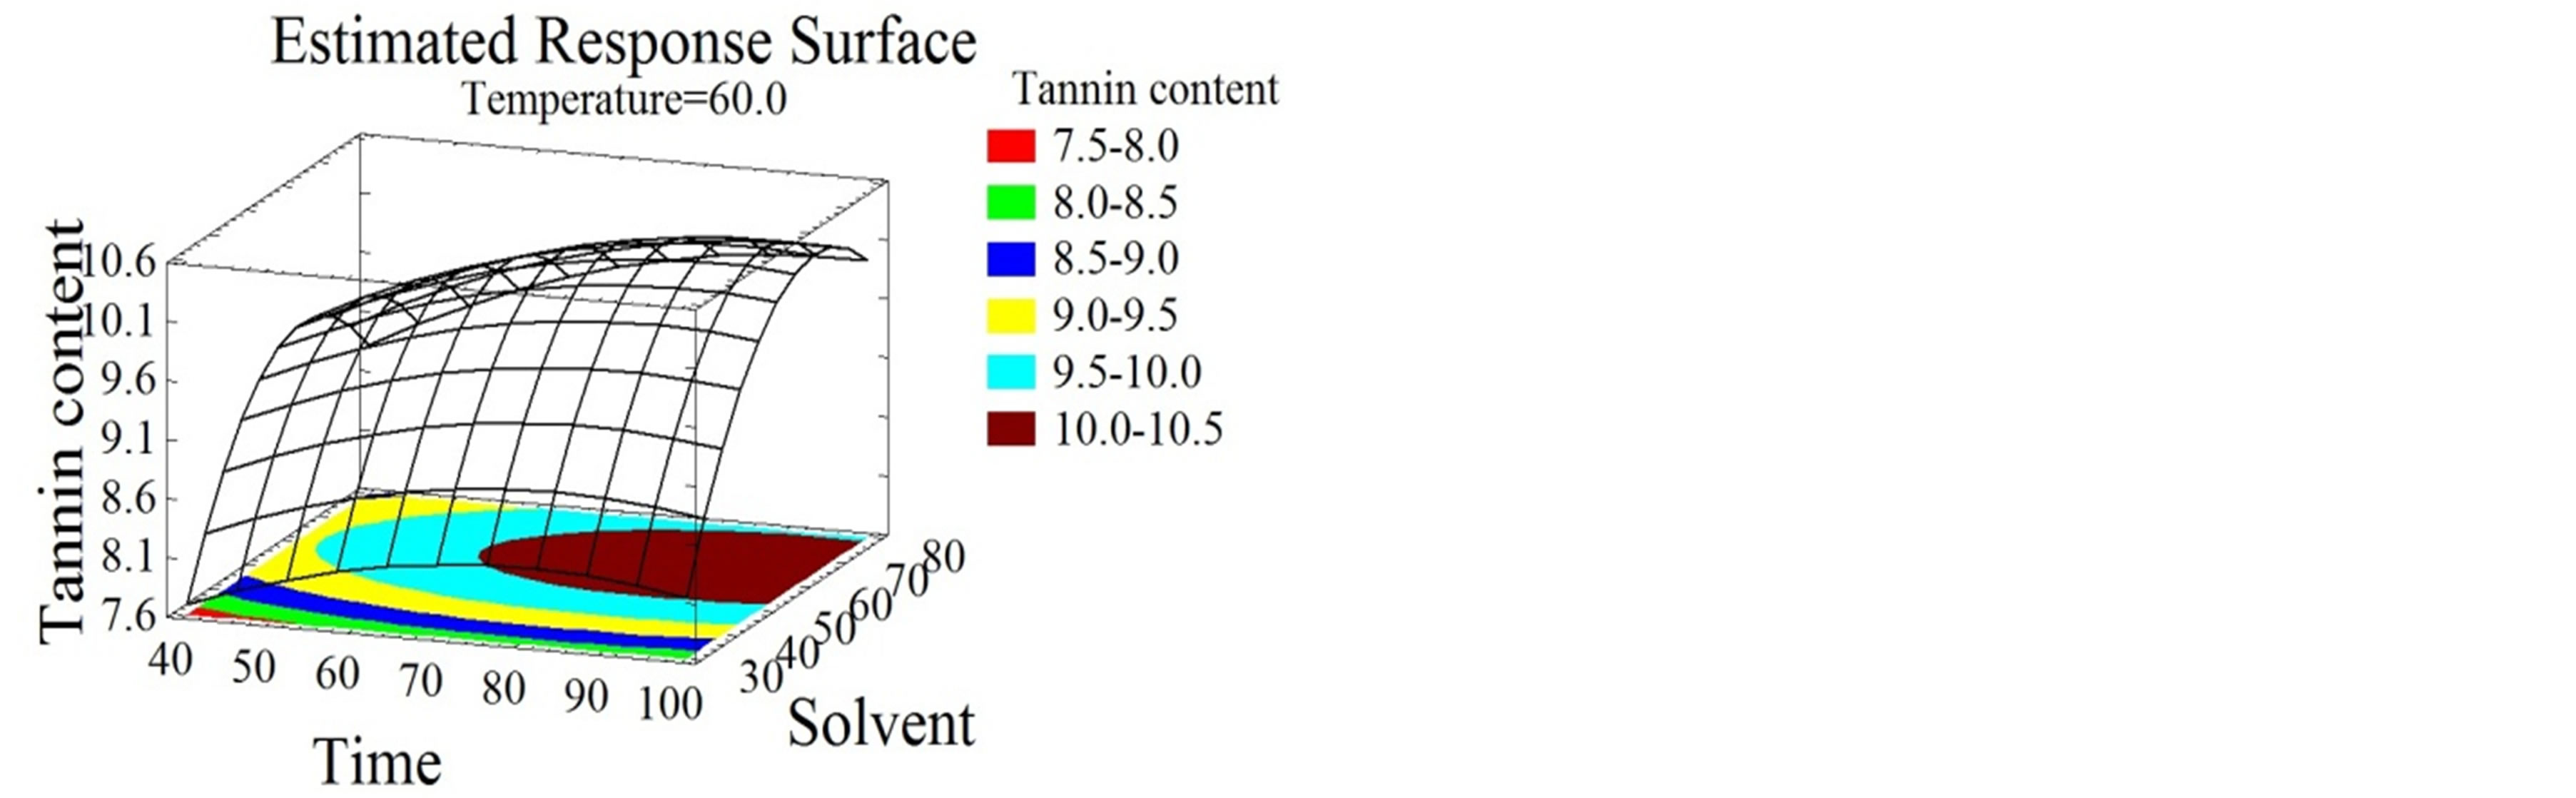 (e)
(e)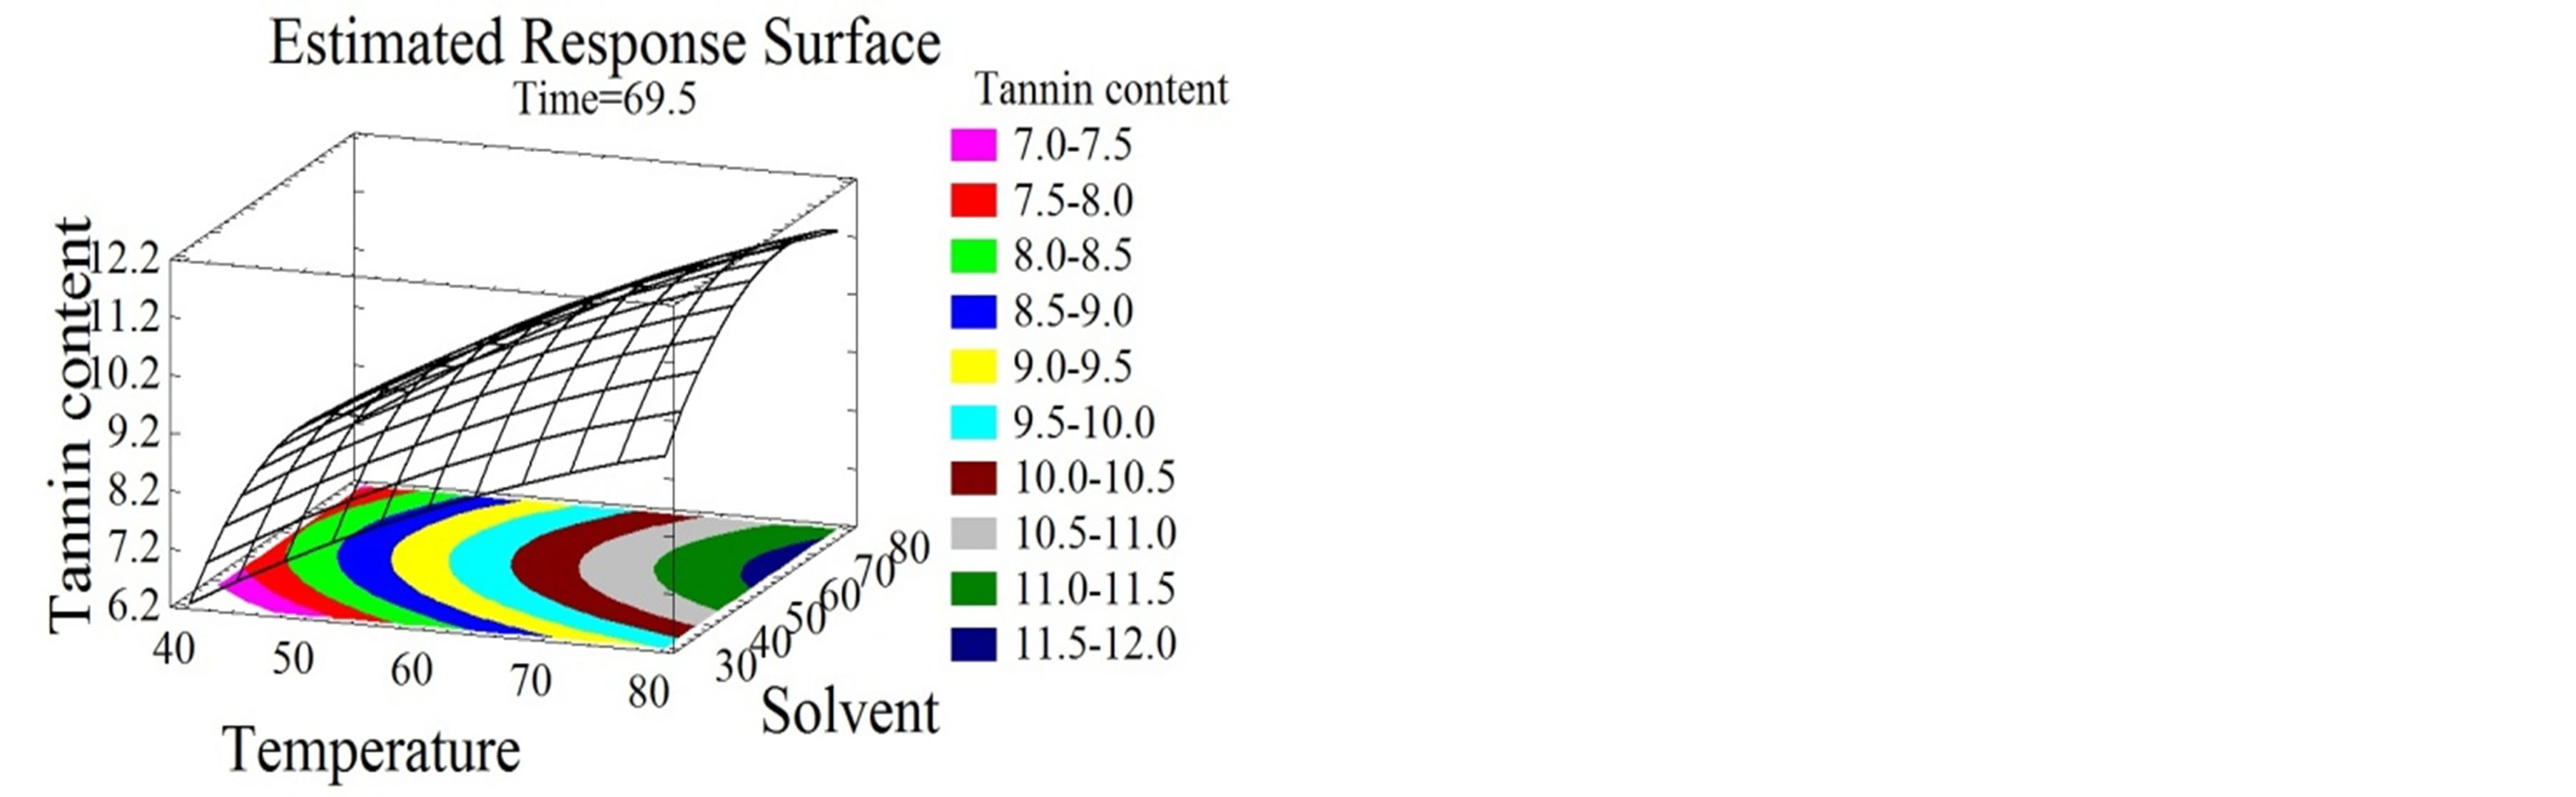 (f)
(f)
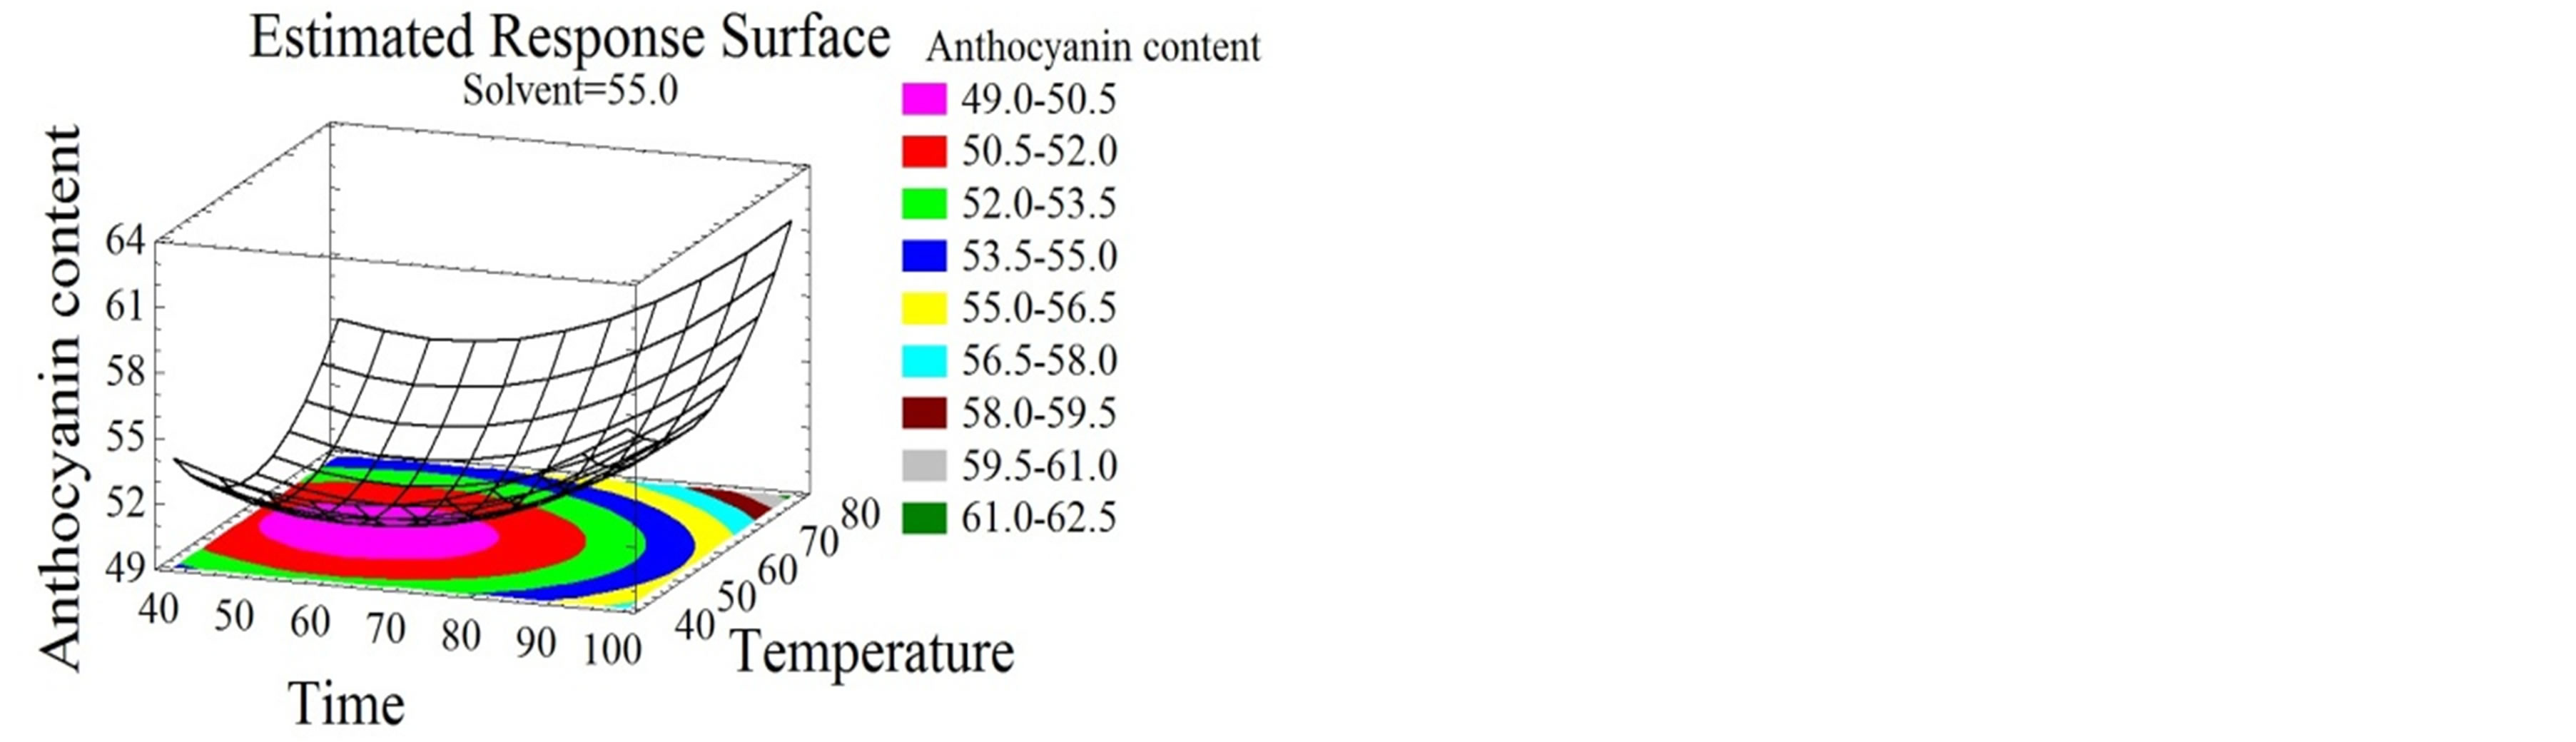
Figure 3. Total monomeric anthocyanin and tannin content surface plots. Three-dimensional expressions by surface plots of TMA and TC. The three-dimensional graphs were plotted between two independent variables while the remaining independent variable was kept at its zero level.
the temperature enhanced the extraction process but with relatively long periods the effect is inverted, and the phenolic compounds are threatened by oxidation or degradation [33]. A competition can thus be noticed between the positive and negative effects of temperature. Numerous solvents were tested for the extraction of phenolic compounds from grape pomace and skins, amongst which, methanol, ethanol, and water are the most commonly used. In terms of extraction rate, methanol seems to be the most effective, followed by ethanol then water [3]. Nevertheless, for food application, ethanol and water are preferred because of hygiene, low cost, and health compatibility [36]. Ethanol concentration has been reported to affect the phenolic compounds extraction since it diminishes the boiling point and influences the polarity of the mixed solvent [37]. Herein, solvent mixture showed a negative quadratic effect on the TPC, who increased when ethanol percentage in water increased up to a certain value, and then decreased when moving towards pure ethanol. This effect was expected since the use of alcohol-water mixtures improves the extraction rates more than the mono-component solvent system [33]. Ethanol improves the solubility of the solute and water contributes in its desorption from the matrix [38]. The
 (a)
(a) (b)
(b)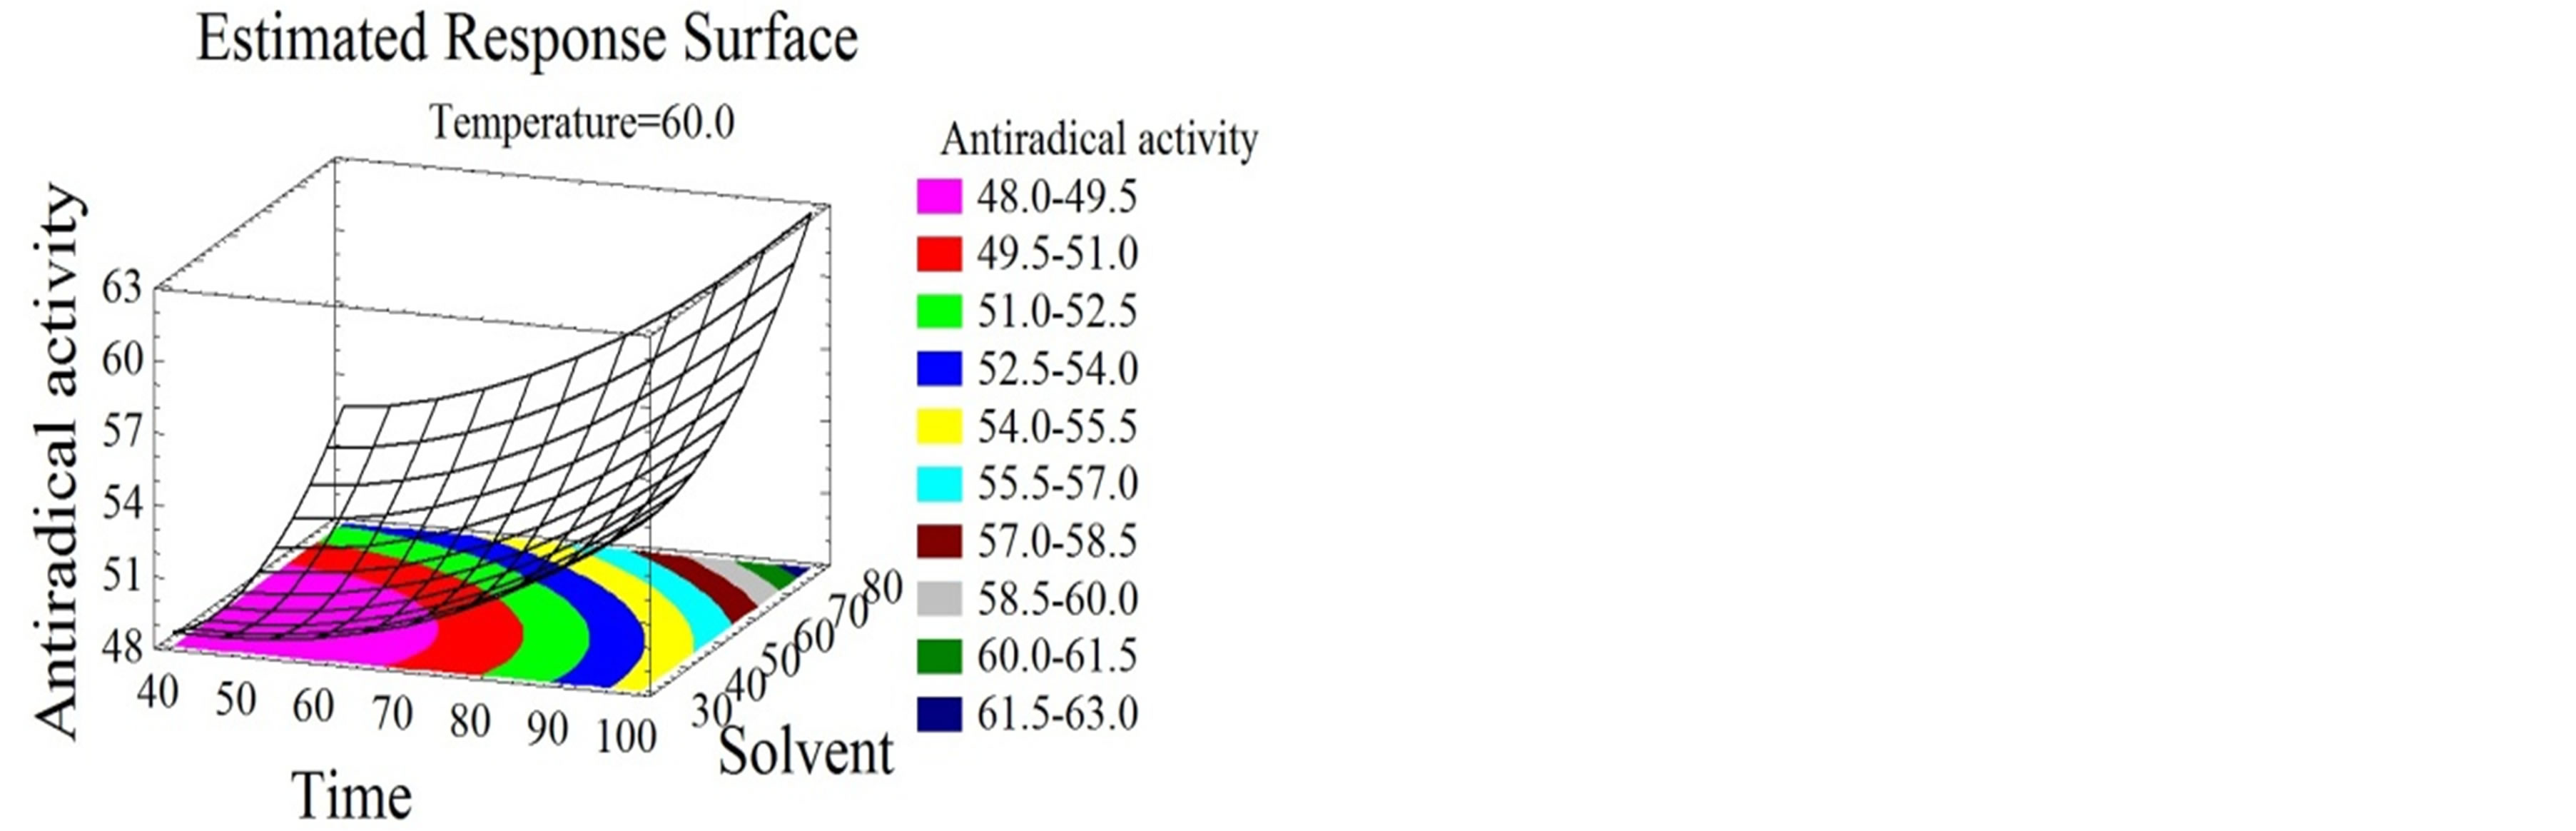 (c)
(c)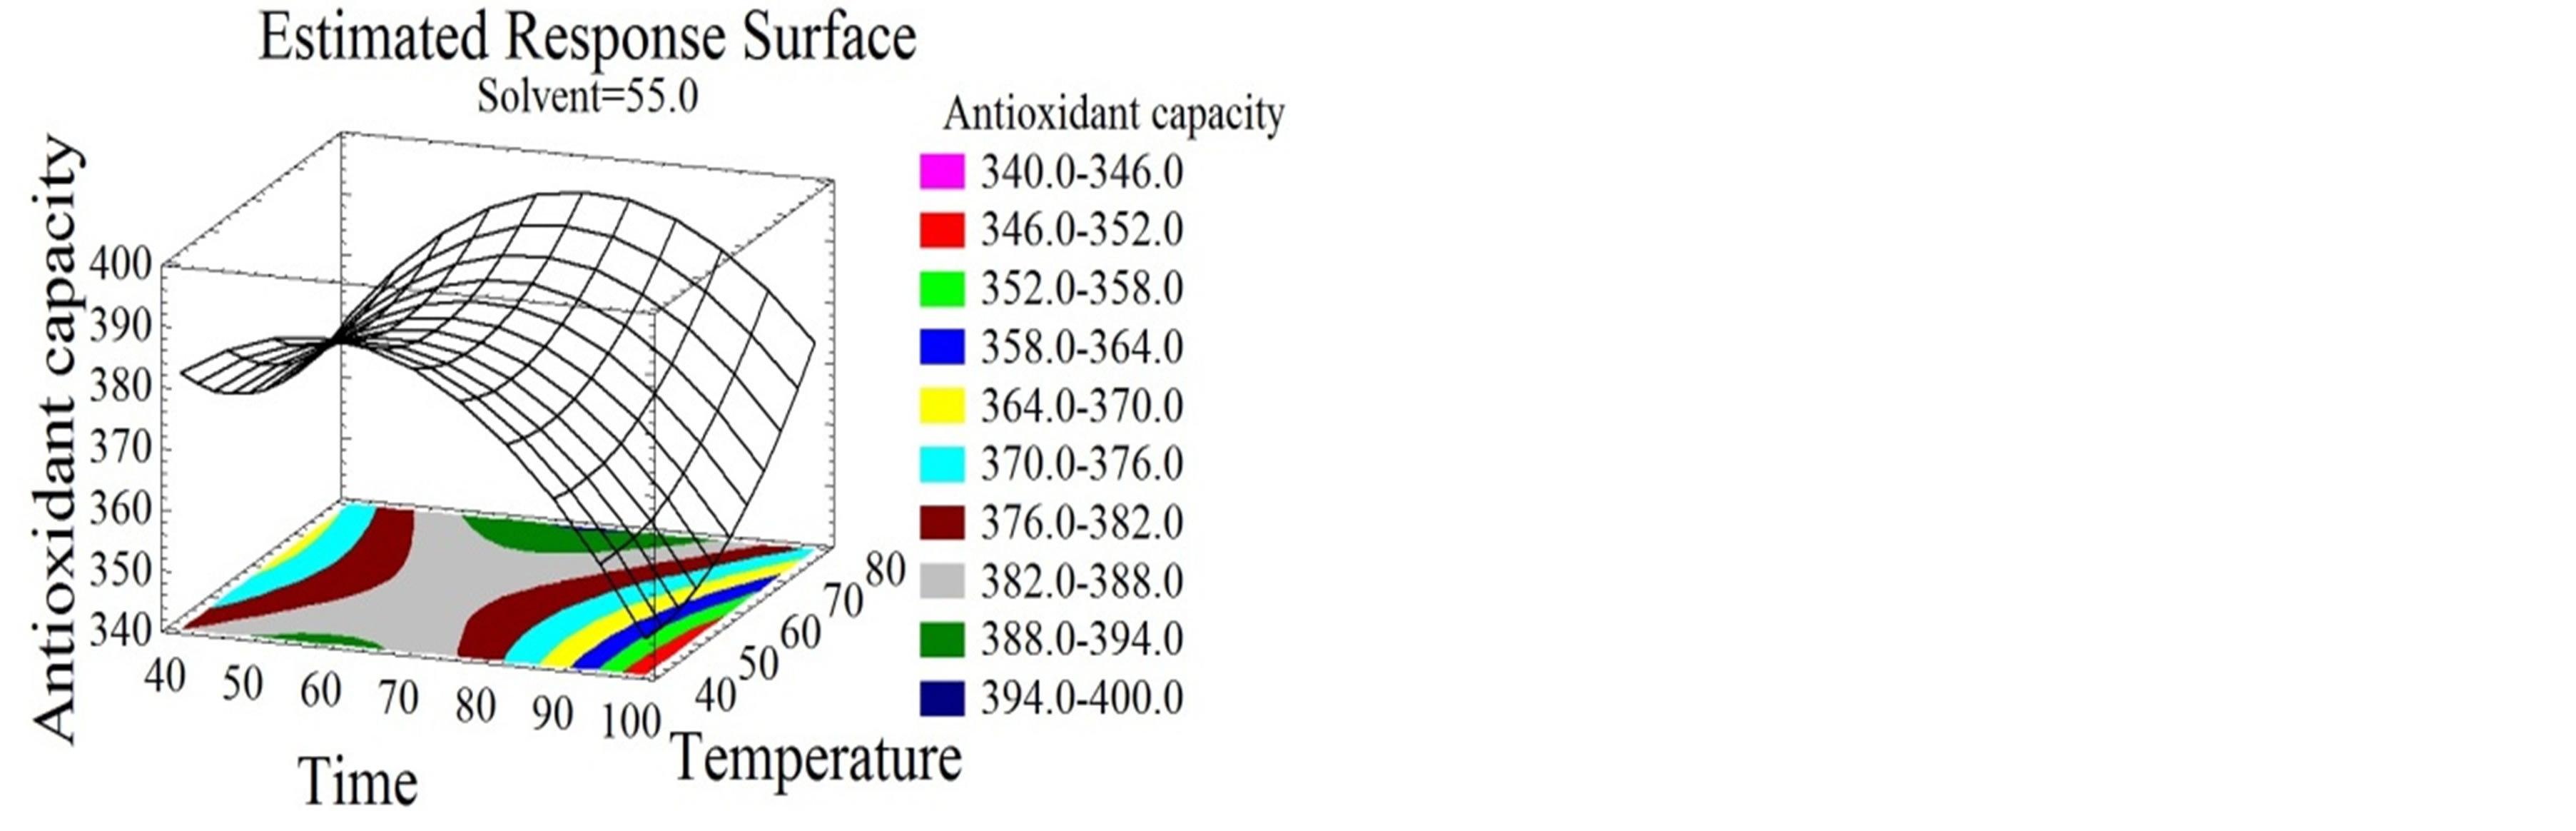 (d)
(d)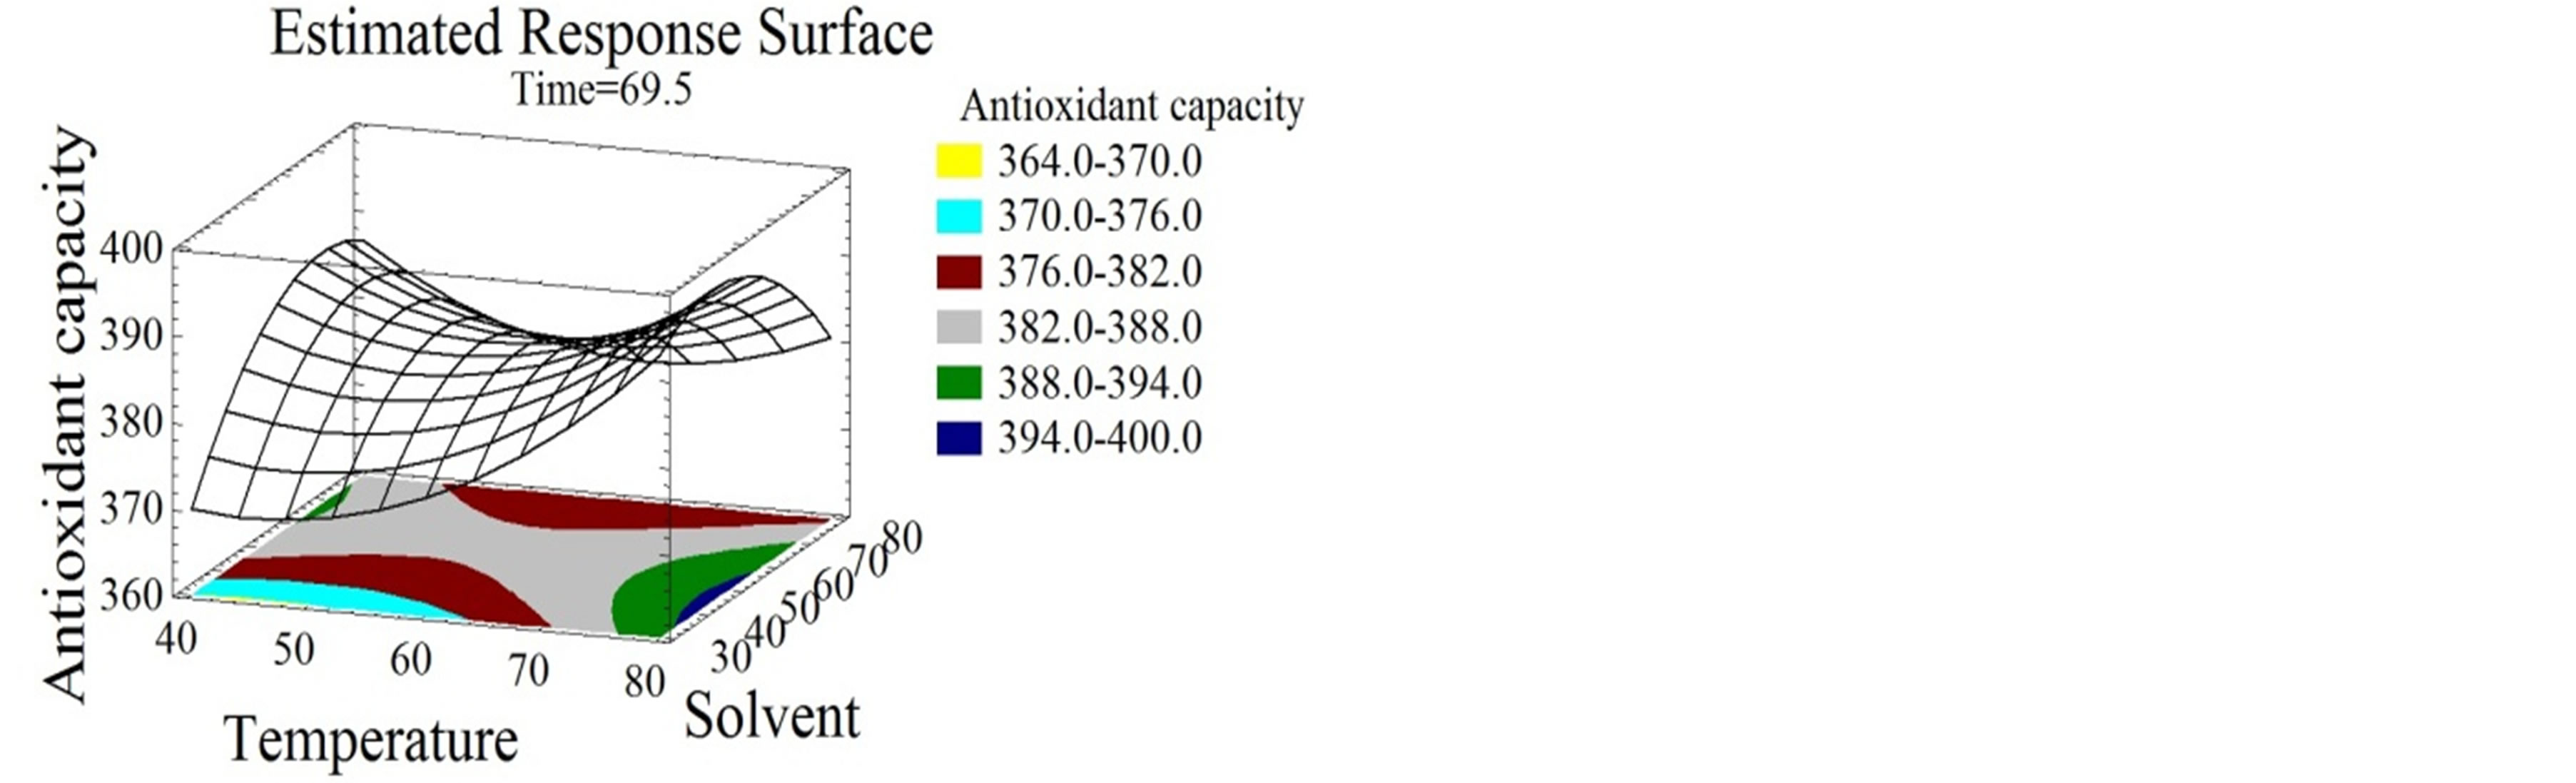 (e)
(e)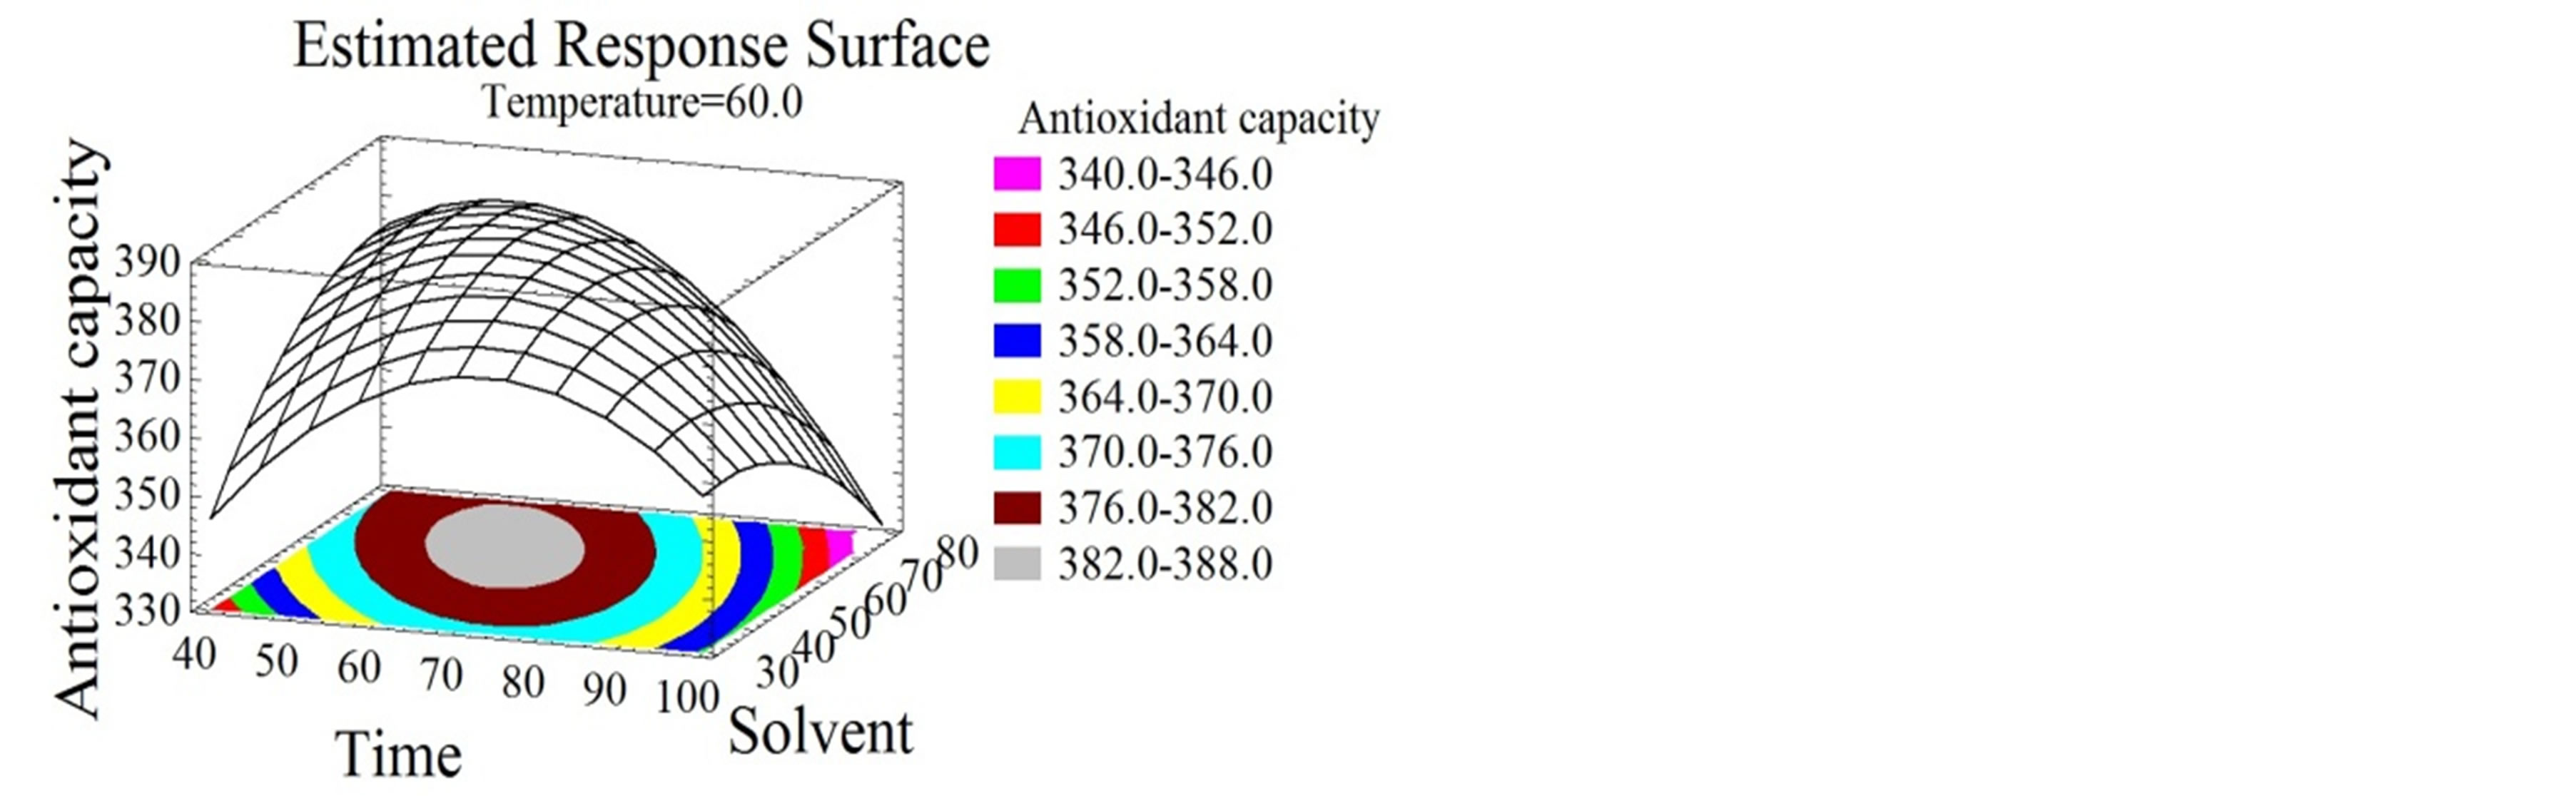 (f)
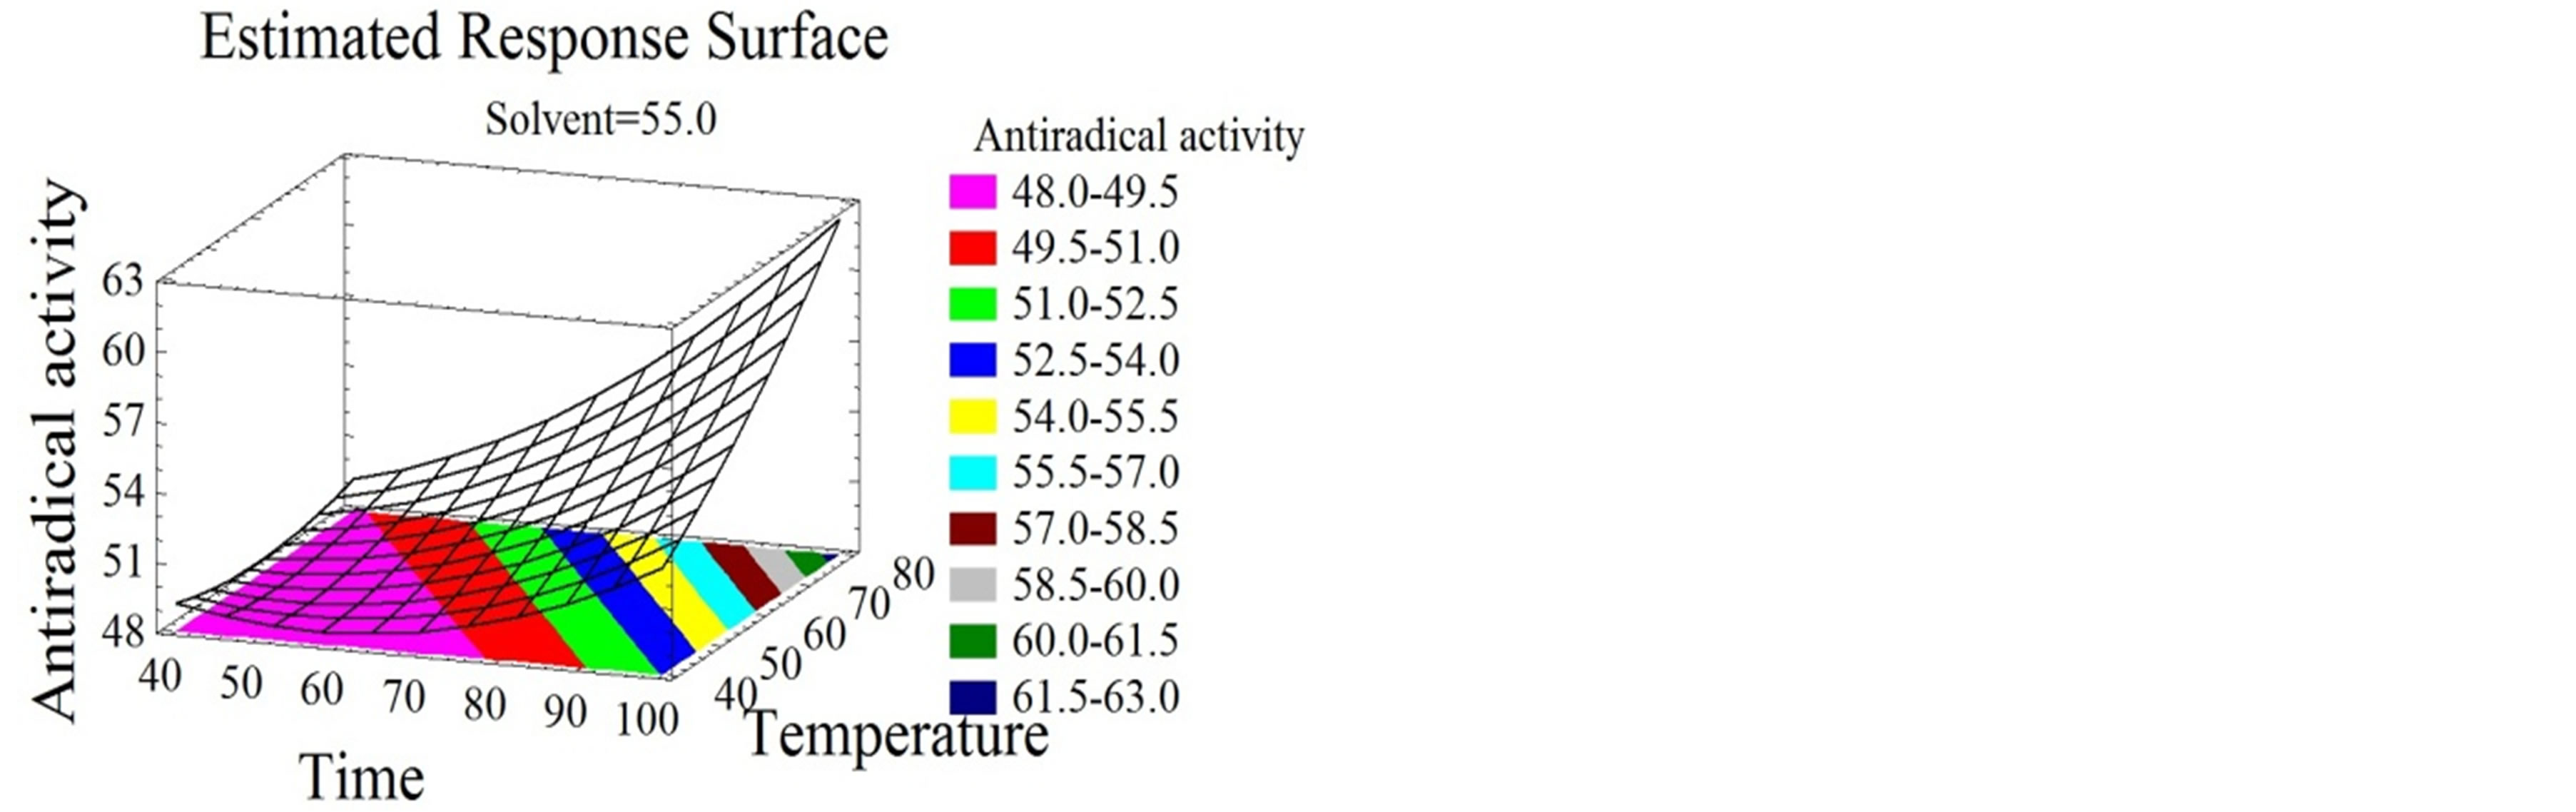
(f)
Figure 4. Antiradical activity and antioxidant capacity surface plots. Three-dimensional expressions by surface plots of AA and AC. The three-dimensional graphs were plotted between two independent variables while the remaining independent variable was kept at its zero level.
optimal solvent mixture was found to be 63% ethanol/ water. Spigno et al. [21] showed that grape pomace phenolics extraction increased for a water ethanol mixture content from 10% to 30%.
3.4.1. Effect of Extraction Parameters on FC
Flavonoids extraction was reported to be affected by many parameters such as time, temperature, ethanol concentration, solid-liquid ratio and extraction cycles [39- 41]. Herein, temperature had a positive linear effect on FC (Figures 2(d) and (e)). Temperature increase leads to FC increase to reach an optimum of 94˚C, identically to the TPC. Many authors showed the effect of temperature on flavonoids extraction. Sheng et al. [42], optimized the solid-liquid extraction of flavonoids from Flos Populi, the maximal yield was obtained at 94.66˚C. The authors explained this better liberation of bioactive compounds from plant cells by the decrease of solvent viscidity and the increase of molecular movement with temperature elevation. Time had a negative quadratic effect (Figure 2(f)), the FC yield increased for the first 76 minutes then decreased, probably due to the decomposition phenomenon observed with relatively extended extraction time [42]. Flavonoids and their glycosides [43] are thought to be efficiently extracted from plant materials by ethanol [44]. As shown in Figure 2(f), solvent mixture had a negative quadratic effect on FC extraction. These increased with ethanol concentration up to 64%, then decreased as getting close to pure ethanol. Similarly, Bimakr et al. [45] conducted the extraction of flavonoids from spearmint (Mentha spicata L.) leaves using a 70% ethanol soxhlet extraction.
3.4.2. Effect of Extraction Parameters on TMA
Time was shown in this study to have linear and quadratic positive effects on TMA (Figure 3(a)). Similarly, Lapornik et al. [24], showed an increase in the anthocyanin content with time increase. For their part, El Hajj et al. [12] showed a negative effect of time on TMA which decreased after 97 hours; this might be due to their prolonged extraction time. In our study, the optimal extraction time for TMA was 119 minutes. Although temperature was reported to be one of the major anthocyanins degradation factors [46], in this study it had linear and quadratic positive effects on TMA extraction (Figure 3(a)). This observation is probably due to the short time of exposure to high temperatures, which was not enough to start the degradation kinetics. The increase of extraction temperature was reported to reduce times of extraction of total phenolics and anthocyanins [28]. This work showed a quadratic negative effect for solvent mixture on the extraction process (Figures 3(b) and (c)) with an optimum of 69% ethanol/water mixture. Lapornik et al. [24], extracted anthocyanins from grape pomace using 70% ethanol/water solvent; which is very identical to our conditions.
3.4.3. Effect of Extraction Parameters on TC
As shown in Figures 3(d), (e) and (f), time, temperature and solvent mixtures have negative quadratic effects on the tannin content. TC increases with time increase to reach its optimal value after 77 minutes, after which a decrease was obtained.
The same tendency of tannin augmentation was observed with temperature and ethanol concentration increase, until they reached 94˚C and 67% ethanol/water mixture, respectively. Tannin extraction from bark was patented to be preferably conducted at high temperatures, between 90˚C and 100˚C [47]. Ethanol was demonstrated to effectually extract tannins from plant materials [44], more specifically. The efficiency of catechin and procyanidins extraction was stated to be ameliorated when ethanol concentration and operation time were extended [48].
In this study a medium polarity of the solvent was found to be the most appropriate (64% ethanol/water) for tannin content maximization. This comes in agreement with the diverse solubilities of the components; procyanidins were shown to be soluble in the aqueous phase and catechins in the organic part of the solvent [49].
3.4.4. Effect of the Extraction Parameters on the Bioactivity of the Phenolic Compounds
In order to emphasize on the biological properties of the extracts, the optimal extraction parameters for the maximization of the AA and the AC were defined.
Temperature had a quadratic positive effect on both properties (Figures 4(a), (b), (d) and (e)) and the optimal temperature for the maximization of the bioactivity was 94˚C. Chamorro et al. [50] showed that a 100˚C furnace thermal treatment did not affect the AC of phenolic compounds extracted from grape pomace and grape seeds.
Wijngaard and Brunton [51] optimized the AC of phenolic compounds from apple pomace at 80˚C. Solvent mixture and time had quadratic positive effects on the AA (Figures 4(a), (b) and (c)) and the optimal values for the maximization of the response were 97% ethanol/water after 119 minutes.
Water extracts were reported by many authors to have lower DPPH inhibition percentages than alcoholic extracts from several natural products [3]. Red-hulled rice methanol extracts showed 3 times higher inhibition percentages than those obtained with water [52]. Unlike for AA, time and solvent mixture had quadratic negative effects on the AC (Figures 4(d), (e) and (f)) that reached its highest value at 26% ethanol/water mixture after 86 minutes incubation time. The phenolic compounds extracted under our conditions showed hydrophilic properties since they are favorably extracted at high water percentage. In this study no correlation of a certain class of phenolic compounds with the AA and AC was demonstrated. Nevertheless, literature review connects the bioactivity to many compounds. Flavonoids have been associated to various biological activities amongst which antiviral and antioxidant effects [53]. Kulisic-Bilusic et al. [54] reported antioxidant activities for procyanidins and anthocyanins. As for free radical scavenging activity it was stated for resveratrol [55], catechin [56,57], flavonol [58,59], procyanidin [59], anthocyanin [60], and gallic acid [55]. Regarding the diversity of the phenolic compounds and its association with the bioactive properties and taking into consideration a possible synergistic effect between the molecules [29], it seemed to us very important to maximize the quantity and diversity of all subtypes of phenolic compounds. Therefore a simultaneous response optimization was conducted.
3.5. Multiple Response Optimization
The simultaneous optimization of multiple responses is a main concern for industrial applications [61] especially that the energy cost of the process is significantly diminished when extraction parameters are optimized [21]. The response variables TPC, FC, TMA, TC, AC, and AA were optimized separately, allowing therefore the targeting of a certain class of compounds only by varying the extraction parameters. Yet, the desirability function in the RSM was utilized to reveal the combination of the extraction parameters (time, temperature, and solvent mixture) capable of simultaneously maximizing all the responses (TPC, FC, TMA, TC, AC, and AA). The overlay plot (Figure 5) shows the outlines superposition of all the studied responses and the simultaneous optimum for all responses is showed by the black spot. A compromise between the quantity of the extracted phenolics (TPC, FC, TMA, TC) and their bioactivity (AC, AA) was the main objective of this simultaneous response optimization. The optimal conditions maximizing TPC, FC, TMA, TC, AC, and AA are 93˚C, 93 minutes, and 66% ethanol/water mixture. For instance, on an industrial scale, phenolic compounds extraction from grape pomace is conducted at 50˚C for 20 hours with a 70% ethanol/ water mixture [4]. Bearing in mind a possible industrial application, the optimization process in this study targeted the reduction of the overall process cost. Therefore, we suggested reducing the extraction time and increasing the temperature, which will certainly lower the cost of the process. We have demonstrated that the quality of the extracts was not affected by the heightened temperature
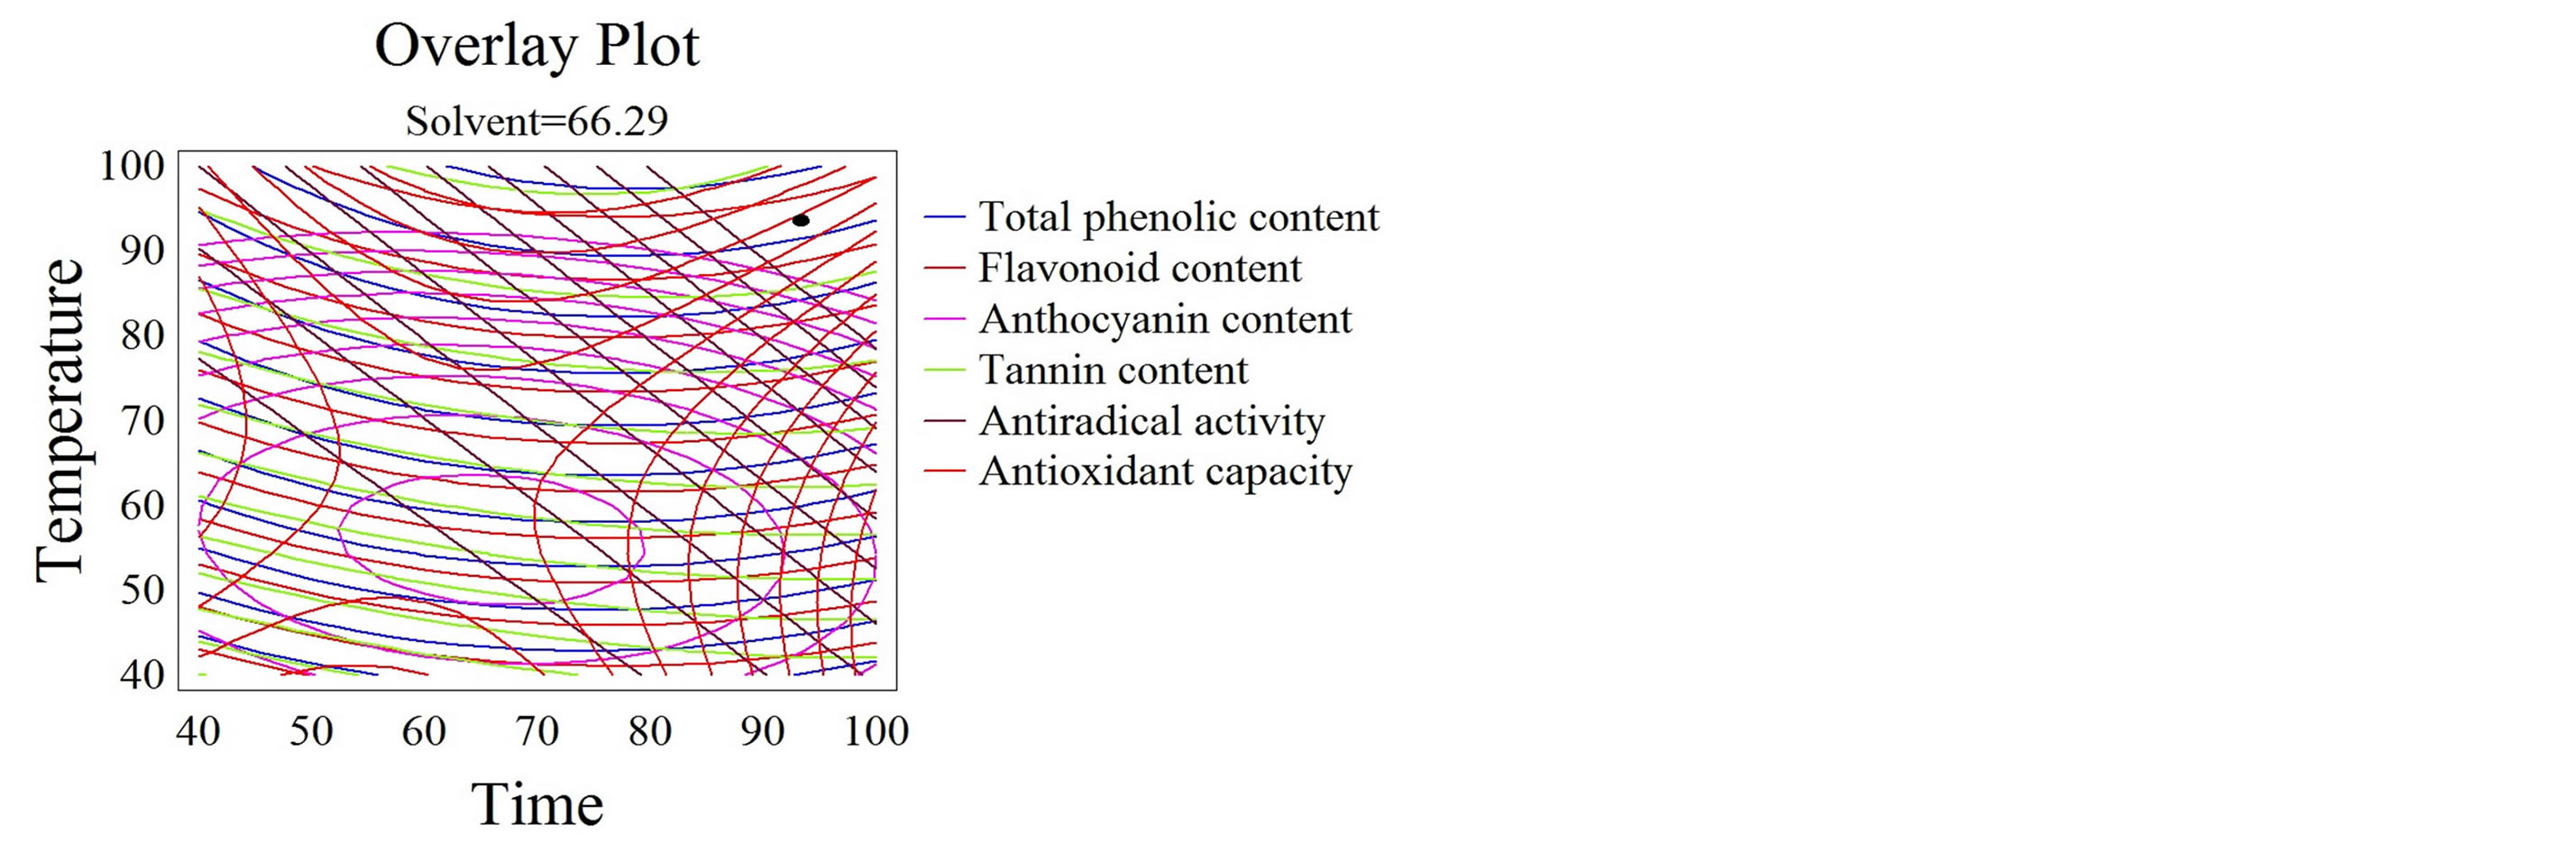
Figure 5. Desirability analysis. Superposition plots, showing the best experimental parameters that maximize all the responses. The black spot shows the optimum for all the responses.
if short periods of times were adopted. Moreover, relatively high quantities of phenolics were extracted with important bioactive properties. Respecting these optimal conditions, we could save several hours, up to 18.5, for each extraction process. Nevertheless, an accurate economical evaluation of the extraction energy cost on the overall production fee is required to confirm the choice of the parameters. Furthermore, a semi-pilot followed by a pilot scale studies are necessary for the scaling up of our results on an industrial level.
4. Conclusion
RSM was revealed accurate in predicting models and optimizing several extraction conditions for the simultaneous maximization of many parameters such as temperature, thus minimizing the degradation process. A potential alternative was proposed for an industrial solid-liquid extraction process of phenolic compounds from grape pomace. We increased the incubation temperature up to 93˚C, reduced the time of the process to 93 minutes, and used 66% ethanol/water as solvent mixture. These extraction conditions reduce the energy cost and maximize simultaneously the extraction of total phenolic compounds (5.5 g GAE/100g DM), flavonoids (5.4 g GAE/ 100 g DM), anthocyanins (70.3 mg/100g DM) and tannins (12.3 g/L), retaining both the antiradical (67%) and antioxidant activities (393 mgAAE/L).
Acknowledgements
The Research Council of Saint Joseph University of Beirut funded this work (Project FS54). We are grateful to Joseph Yaghi for technical assistance and to the society Château KSARA for providing the grape pomace.
REFERENCES
- D. P. Makris, G. Boskou, and N. K. Andrikopoulos, “Polyphenolic Content and in Vitro Antioxidant Characteristics of Wine Industry and Other Agri-Food Solid Waste Extracts,” Journal of Food Composition and Analysis, Vol. 20, No. 2, 2007, pp. 125-132. http://dx.doi.org/10.1016/j.jfca.2006.04.010
- N. El Darra, N. Grimi, R. G. Maroun, N. Louka and E. Vorobiev, “Pulsed Electric Field, Ultrasound, and Thermal Pretreatments for Better Phenolic Extraction during Red Fermentation,” European Food Research and Technology, Vol. 236, No. 1, 2012, pp. 47-56. http://dx.doi.org/10.1007/s00217-012-1858-9
- M. Pinelo, M. Rubilar, M. Jerez, J. Sineiro and M. J. Núñez, “Effect of Solvent, Temperature, and Solvent-toSolid Ratio on the Total Phenolic Content and Antiradical Activity of Extracts from Different Components of Grape Pomace,” Journal of Agricultural and Food Chemistry, Vol. 53, No. 6, 2005, pp. 2111-2117. http://dx.doi.org/10.1021/jf0488110
- N. Boussetta, “Intensification de l’Extraction des Polyphénols par Electrotechnologies pour la Valorisation des Marcs de Champagne,” Ph. D. Thesis, University of Technology of Compiègne, France, 2010.
- H. N. Rajha, N. E. Darra, N. Louka, R. G. Maroun, W. Ziegler and H. Bochzelt, “Valorization of Industrial Waste Using Energy Saving Procedures. Phenolic Compounds Purification from Grape By-Products by Accelerated Solvent Extraction (ASE),” International Conference on Renewable Energies for Developing Countries, 2012, pp. 1-5.
- J. Khalil, “Pulsed Electric Field (P.E.F.) and Pectinase for the Extraction of Polyphenols from Grape Pomace and Peel,” Dissertations & Thesis in Food Science and Technology, 2011, Paper 16.
- E. Barzana, D. Rubio, R. I. Santamaria, O. Garcia-Correa, F. Garcia, V. E. RidauraSanz and A. López-Munguía, “Enzyme-Mediated Solvent Extraction of Carotenoïds from Marigold Flower (Tageteserecta),” Journal of Agricultural and Food Chemistry, Vol. 50, No. 16, 2002, pp. 4491-4496. http://dx.doi.org/10.1021/jf025550q
- G. Spigno and D. M. De Faveri, “Antioxidants from Grape Stalks and Marc: Influence of Extraction Procedure on Yield, Purity and Antioxidant Power of the Extracts,” Journal of Food Engineering, Vol. 78, No. 3, 2007, pp. 793-801. http://dx.doi.org/10.1016/j.jfoodeng.2005.11.020
- P. D. Haaland, “Experimental Design in Biotechnology,” CRC Press, Boca Raton, 1989.
- G. E. P. Box and K. B. Wilson, “On the Experimental Attainment of Optimum Conditions,” Journal of the Royal Statistical Society. Series B (Methodological), Vol. 13, No. 1, 1951, pp. 1-45.
- J. E. Cacace and G. Mazza, “Optimization of Extraction of Anthocyanins from Black Currants with Aqueous Ethanol,” Journal of Food Science, Vol. 68, No. 1, 2003, pp. 240-248. http://dx.doi.org/10.1111/j.1365-2621.2003.tb14146.x
- Y. El Hajj, N. Louka, C. Nguyen and R. G. Maroun, “Low Cost Process for Phenolic Compounds Extraction from Cabernet Sauvignon Grapes (Vitisvinifera L. cv. Cabernet Sauvignon). Optimization by Response Surface Methodology,” Food and Nutrition Sciences, Vol. 3, No. 1, 2012, pp. 89-103. http://dx.doi.org/10.4236/fns.2012.31014
- H. N. Rajha, N. El Darra, E. Vorobiev, N. Louka and R. G. Maroun, “An Environment Friendly, Low-Cost Extraction Process of Phenolic Compounds from Grape Byproducts. Optimization by Multi-Response Surface Methodology,” Food and Nutrition Sciences, Vol. 4, No. 6, 2013, pp. 650-659. http://dx.doi.org/10.4236/fns.2013.46084
- E. Ozcan, “Ultrasound Assisted Extraction of Phenolics from Grape Pomace,” Middle East Technical University, 2006.
- K. Slinkard and V. L. Singleton, “Total Phenol Analysis: Automation and Comparison with Manual Methods,” American Journal of Enology and Viticulture, Vol. 28, No. 1, 1977, pp. 49-55.
- M. A. Amerine and C. S. Ough, “Methods for Analysis of Musts and Wines,” 1980.
- M. M. Giusti and R. E. Wrolstad, “Characterization and Measurement of Anthocyanins by UV-Visible Spectroscopy,” Current Protocols in Food Analytical Chemistry, 2001.
- P. Ribéreau-Gayon, D. Dubourdieu and B. Donèche, “Traité d’Œnologie,” 6ème Edition, Tome 2. Chimie du vin. Stabilisation et Traitements, 1998.
- P. Preito, M. Pineda and M. Aguilar, “Spectrophotometric Quantitation of Antioxidant Capacity through the Formation of a Phosphomolybdenum Complex: Specific Application to the Determination of Vitamin E,” Analytical Biochemistry, Vol. 269, No. 2, 1999, pp. 337-341. http://dx.doi.org/10.1006/abio.1999.4019
- S. Kallithraka, A. A.-A. Mohdaly, D. P. Makris and P. Kefalas, “Determination of Major Anthocyanin Pigments in Hellenic Native Grape Varieties (Vitisvinifera sp.): Association with Antiradical Activity,” Journal of Food Composition and Analysis, Vol. 18, No. 5, 2005, pp. 375- 386. http://dx.doi.org/10.1016/j.jfca.2004.02.010
- G. Spigno, L. Tramelli and D. M. De Faveri, “Effects of Extraction Time, Temperature and Solvent on Concentration and Antioxidant Activity of Grape Marc Phenolics,” Journal of Food Engineering, Vol. 81, No. 1, 2007, pp. 200-208. http://dx.doi.org/10.1016/j.jfoodeng.2006.10.021
- A. B. S. Meyer, “Enhanced Extraction of Antioxidant Phenols from Wine and Juice Press Residues via Enzymatic Polysaccharide Hydrolysis,” Fruit Processing, Vol. 12, 2002, pp. 29-33.
- M. Pinelo, J. Sineiro and M. J. Núñez, “Mass Transfer during Continuous Solid-Liquid Extraction of Antioxidants from Grape Byproducts,” Journal of Food Engineering, Vol. 77, No. 1, 2006, pp. 57-63. http://dx.doi.org/10.1016/j.jfoodeng.2005.06.021
- B. Lapornik, M. Prošek and A. GolcWondra, “Comparison of Extracts Prepared from Plant By-Products Using Different Solvents and Extraction Time,” Journal of Food Engineering, Vol. 71, No. 2, 2005, pp. 214-222. http://dx.doi.org/10.1016/j.jfoodeng.2004.10.036
- M. Antolovich, P. Prenzler, K. Robards and D. Ryan, “Sample Preparation in the Determination of Phenolic Compounds in Fruits,” Analyst, Vol. 125, No. 5, 2000, pp. 989-1009. http://dx.doi.org/10.1039/b000080i
- N. El Darra, N. Grimi, E. Vorobiev, N. Louka and R. Maroun, “Extraction of Polyphenols from Red Grape Pomace Assisted by Pulsed Ohmic Heating,” Food and Bioprocess Technology, Vol. 6, No. 5, 2013, pp. 1281- 1289.
- E. Revilla, J.-M. Ryan and G. Martín-Ortega, “Comparison of Several Procedures Used for the Extraction of Anthocyanins from Red Grapes,” Journal of Agricultural and Food Chemistry, Vol. 46, No. 11, 1998, pp. 4592- 4597. http://dx.doi.org/10.1021/jf9804692
- J. E. Cacace and G. Mazza, “Extraction of Anthocyanins and Other Phenolics from Black Currants with Sulfured Water,” Journal of Agricultural and Food Chemistry, Vol. 50, No. 21, 2002, pp. 5939-5946. http://dx.doi.org/10.1021/jf025614x
- N. El Darra, J. Tannous, P. B. Mouncef, J. Palge, J. Yaghi, E. Vorobiev, N. Louka and R. G. Maroun, “A Comparative Study on Antiradical and Antimicrobial Properties of Red Grapes Extracts Obtained from Different Vitisvinifera Varieties,” Food and Nutrition Sciences, Vol. 3, No. 10, 2012, pp. 1420-1432. http://dx.doi.org/10.4236/fns.2012.310186
- K. Ghafoor, J. Park and Y.-H. Choi, “Optimization of Supercritical Fluid Extraction of Bioactive Compounds from Grape (Vitislabrusca B.) Peel by Using Response Surface Methodology,” Innovative Food Science & Emerging Technologies, Vol. 11, No. 3, 2010, pp. 485- 490. http://dx.doi.org/10.1016/j.ifset.2010.01.013
- L. Ramos, E. M. Kristenson and U. A. Brinkman, “Current Use of Pressurised Liquid Extraction and Subcritical Water Extraction in Environmental Analysis,” Journal of Chromatography A, Vol. 975, No. 1, 2002, pp. 3-29. http://dx.doi.org/10.1016/S0021-9673(02)01336-5
- F. Bonilla, M. Mayen, J. Merida and M. Medina, “Extraction of Phenolic Compounds from Red Grape Marc for Use as Food Lipid Antioxidants,” Food Chemistry, Vol. 66, No. 2, 1999, pp. 209-215. http://dx.doi.org/10.1016/S0308-8146(99)00046-1
- Y. Yilmaz and R. T. Toledo, “Oxygen Radical Absorbance Capacities of Grape/Wine Industry Byproducts and Effect of Solvent Type on Extraction of Grape Seed Polyphenols,” Journal of Food Composition and Analysis, Vol. 19, No. 1, 2006, pp. 41-48. http://dx.doi.org/10.1016/j.jfca.2004.10.009
- G. K. Jayaprakasha, R. P. Singh and K. K. Sakariah, “Antioxidant Activity of Grape Seed (Vitisvinifera) Extracts on Peroxidation Models in Vitro,” Food Chemistry, Vol. 73, No. 3, 2001, pp. 285-290. http://dx.doi.org/10.1016/S0308-8146(00)00298-3
- M. Pinelo, P. D. Fabbro, L. Manzocco, M. J. Nuñez and M. C. Nicoli, “Optimization of Continuous Phenol Extraction from Vitisvinifera Byproducts,” Food Chemistry, Vol. 92, No. 1, 2005, pp. 109-117. http://dx.doi.org/10.1016/j.foodchem.2004.07.015
- A. Moure, J. M. Cruz, D. Franco, J. M. Domínguez, J. Sineiro, H. Domínguez, M. José Núñez and J. C. Parajó, “Natural Antioxidants from Residual Sources,” Food Chemistry, Vol. 72, No. 2, 2001, pp. 145-171. http://dx.doi.org/10.1016/S0308-8146(00)00223-5
- H. Wijngaard and N. Brunton, “The Optimization of Extraction of Antioxidants from Apple Pomace by Pressurized Liquids,” Journal of Agricultural and Food Chemistry, Vol. 57, No. 22, 2009, pp. 10625-10631. http://dx.doi.org/10.1021/jf902498y
- A. Mustafa and C. Turner, “Pressurized Liquid Extraction as a Green Approach in Food and Herbal Plants Extraction: A Review,” Analytica Chimica Acta, Vol. 703, No. 1, 2011, pp. 8-18. http://dx.doi.org/10.1016/j.aca.2011.07.018
- H. Liu, X. Du, Q. Yuan and L. Zhu, “Optimisation of Enzyme Assisted Extraction of Silybin from the Seeds of Silybum Marianum by Box-Behnken Experimental Design,” Phytochemical Analysis, Vol. 20, No. 6, 2009, pp. 475-483. http://dx.doi.org/10.1002/pca.1149
- E. M. Silva, H. Rogez and Y. Larondelle, “Optimization of Extraction of Phenolics from Inga Edulis Leaves Using Response Surface Methodology,” Separation and Purification Technology, Vol. 55, No. 3, 2007, pp. 381-387. http://dx.doi.org/10.1016/j.seppur.2007.01.008
- X. Y. Zhu, Y. L. Mang, J. Xie, P. Wang and W. K. Su, “Response Surface Optimization of MechanochemicalAssisted Extraction of Flavonoids and Terpenetrilactones from Ginkgo Leaves,” Industrial Crops and Products, Vol. 34, No. 1, pp. 1041-1052. http://dx.doi.org/10.1016/j.indcrop.2011.03.013
- Z. L. Sheng, P. F. Wan, C. L. Dong and Y. H. Li, “Optimization of Total Flavonoids Content Extracted from Flos Populi Using Response Surface Methodology,” Industrial Crops and Products, Vol. 43, 2013, pp. 778-786.
- M. Naczk, F. Shahidi and A. Sullivan, “Recovery of Rapeseed Tannins by Various Solvent Systems,” Food Chemistry, Vol. 45, No. 1, 1992, pp. 51-54. http://dx.doi.org/10.1016/0308-8146(92)90012-Q
- N. I. Bazykina, A. N. Nikolaevskii, T. A. Filippenko and V. G. Kaloerova, “Optimization of Conditions for the Extraction of Natural Antioxidants from Raw Plant Materials,” Pharmaceutical Chemistry Journal, Vol. 36, No. 2, 2002, pp. 46-49. http://dx.doi.org/10.1023/A:1016024300843
- M. Bimakr, R. A. Rahman, F. S. Taip, A. Ganjloo, L. M. Salleh, J. Selamat, A. Hamid and I. S. M. Zaidul, “Comparison of Different Extraction Methods for the Extraction of Major Bioactive Flavonoid Compounds from Spearmint (Menthaspicata L.) Leaves,” Food and Bioproducts Processing, Vol. 89, No. 1, 2011, pp. 67-72. http://dx.doi.org/10.1016/j.fbp.2010.03.002
- R. L. Jackman, R. Y. Yada, M. A. Tung and R. Speers, “Anthocyanins as Food Colorants—A Review,” Journal of Food Biochemistry, Vol. 11, No. 3, 1987, pp. 201-247. http://dx.doi.org/10.1111/j.1745-4514.1987.tb00123.x
- D. L. Connolly, “Tannin Extraction,” US Patent No. US5238680 A, 1993.
- E. Alonso, E. Revilla and M. Bourzeix, “Suitability of Water/Ethanol Mixtures for the Extraction of Catechins and Proanthocyanidins from Vitisvinifera Seed Containers in a Winery by-Product,” Proceedings of the International Seed Testing Association, 1991.
- J. Shi, J. Yu, J. E. Pohorly and Y. Kakuda, “Polyphenolics in Grape Seeds-Biochemistry and Functionality,” Journal of Medicinal Food, Vol. 6, No. 4, 2003, pp. 291-299. http://dx.doi.org/10.1089/109662003772519831
- S. Chamorro, I. Goñi, A. Viveros, D. Hervert-Hernández and A. Brenes, “Changes in Polyphenolic Content and Antioxidant Activity after Thermal Treatments of Grape Seed Extract and Grape Pomace,” European Food Research and Technology, Vol. 234, No. 1, 2012, pp. 147- 155. http://dx.doi.org/10.1007/s00217-011-1621-7
- H. H. Wijngaard and N. Brunton, “The Optimisation of Solid-Liquid Extraction of Antioxidants from Apple Pomace by Response Surface Methodology,” Journal of Food Engineering, Vol. 96, No. 1, 2010, pp. 134-140. http://dx.doi.org/10.1016/j.jfoodeng.2009.07.010
- T. Oki, M. Masuda, M. Kobayashi, Y. Nishiba, S. Furuta, I. Suda and T. Sato, “Polymeric Procyanidins as RadicalScavenging Components in Red-Hulled Rice,” Journal of Agricultural and Food Chemistry, Vol. 50, No. 26, 2002, pp. 7524-7529. http://dx.doi.org/10.1021/jf025841z
- A. S. Awaad, D. J. Maitland, A. E. R. M. Donia, S. I. Alqasoumi and G. A. Soliman, “Novel Flavonoids with Antioxidant Activity from a Chenopodiaceous Plant,” Pharmaceutical Biology, Vol. 50, No. 1, 2012, pp. 99-104. http://dx.doi.org/10.3109/13880209.2011.591806
- T. Kulisic-Bilusic, K. Schnäbele, I. Schmöller, V. DragovicUzelac, A. Krisko, B. Dejanovic, M. Milos and G. Pifat, “Antioxidant Activity versus Cytotoxic and Nuclear Factor Kappa B Regulatory Activities on HT-29 Cells by Natural Fruit Juices,” European Food Research and Technology, Vol. 228, No. 3, 2009, pp. 417-424. http://dx.doi.org/10.1007/s00217-008-0948-1
- Y. Yilmaz and R. T. Toledo, “Major Flavonoids in Grape Seeds and Skins: Antioxidant Capacity of Catechin, Epicatechin and Gallic Acid,” Journal of Agricultural and Food Chemistry, Vol. 52, No. 2, 2004, pp. 255-260. http://dx.doi.org/10.1021/jf030117h
- M. Falchi, A. Bertelli, R. Lo Scalzo, M. Morassut, R. Morelli, S. Das, J. Cui and D. K. Das, “Comparison of Cardioprotective Abilities between the Flesh and Skin of Grapes,” Journal of Agricultural and Food Chemistry, Vol. 54, No. 18, 2006, pp. 6613-6622. http://dx.doi.org/10.1021/jf061048k
- Y. P. Qian, Y. J. Cai, G. J. Fan, Q. Y.Wei, J. Yang, L. F. Zheng, X. Z. Li, J. G. Fang and B. Zhou, “AntioxidantBased Lead Discovery for Cancer Chemoprevention: The Case of Resveratrol,” Journal of Medicinal Chemistry, Vol. 52, No. 7, 2009, pp. 1963-1974. http://dx.doi.org/10.1021/jm8015415
- Y. Yoshimura, H. Nakazawa and F. Yamaguchi, “Evaluation of the NO Scavenging Activity of Procyanidin in Grape Seed by Use of the TMA-PTIO/NOC 7 ESR System,” Journal of Agricultural and Food Chemistry, Vol. 51, No. 22, 2003, pp. 6409-6412. http://dx.doi.org/10.1021/jf034129e
- M. A. Soobrattee, V. S. Neergheen, A. Luximon-Ramma, O. I. Aruoma and T. Bahorun, “Phenolics as Potential Antioxidant Therapeutic Agents: Mechanism and Actions,” Mutation Research/Fundamental and Molecular Mechanisms of Mutagenesis, Vol. 579, No. 1, 2005, pp. 200-213.
- [61] D. Bagchi, C. K. Sen, M. Bagchi and M. Atalay, “AntiAngiogenic, Antioxidant and Anti-Carcinogenic Properties of a Novel Anthocyanin-Rich Berry Extract Formula,” Biochemistry (Moscow), Vol. 69, No. 1, 2004, pp. 75-80. http://dx.doi.org/10.1023/B:BIRY.0000016355.19999.93
- [62] C. W. Tsai, L. I. Tong and C. H. Wang, “Optimization of Multiple Responses Using Data Envelopment Analysis and Response Surface Methodology,” Tamkang Journal of Science and Engineering, Vol. 13, No. 2, 2010, pp. 197-203.
NOTES
*Corresponding author.