Food and Nutrition Sciences
Vol. 3 No. 9 (2012) , Article ID: 22302 , 4 pages DOI:10.4236/fns.2012.39168
Influence of Various Antioxidants on the Characteristics of Plain Yogurt
![]()
1School of Animal Sciences, Louisiana State University Agricultural Center, Baton Rouge, USA; 2Department of Food Science, Louisiana State University Agricultural Center, Baton Rouge, USA.
Email: karyana@agcenter.lsu.edu
Received July 14th, 2012; revised August 14th, 2012; accepted August 21st, 2012
Keywords: Antioxidant; Fermented; Quality
ABSTRACT
Free radical damage has been implicated in ageing and in certain degenerative conditions such as Alzheimer’s disease and other forms of dementia. Ageing is also associated with a progressive decline in the function of the immune system and an increased susceptibility to infection. Antioxidants protect the body from free radical damage. Vitamin E is the major antioxidant vitamin in body tissues and is considered the first line of defense against cell membrane damage. Other antioxidant defenses that protect the body from free radical damage include vitamin C and beta carotene. Yogurt is considered a healthy food product and its sales have been steadily increasing over the past 5 years. The objective was to study the influence of various antioxidants on the quality characteristics of yogurt. The antioxidants vitamin C, vitamin E and beta carotene individually and in combination were incorporated at 100% of their respective recommended dietary allowance of 60 mg, 12 mg and 3 mg in 240 mL of yogurt. Yogurt manufacture and all experiments were conducted in triplicate. Use of antioxidants in yogurt manufacture significantly influenced yogurt viscosity, flavor, appearance, body texture but did not influence syneresis, lactic acid bacterial counts and pH. Depending upon the application antioxidants can be recommended in yogurt manufacture.
1. Introduction
This free radicals are highly reactive compounds that are produced when the body uses oxygen. While free radicals are normal products of our cells and have certain beneficial roles in the body, excessive levels in body tissues can be detrimental to health. Free radicals multiply through a series of chain reactions and can damage both the structure and function of cell membranes [1]. There is evidence connecting free radicals to the development of a number of degenerative diseases and accelerated ageing [1].
Free radical damage has been implicated in brain, ageing and in certain degenerative conditions such as Alzheimer’s disease and other forms of dementia. Ageing is also associated with a progressive decline in the function of the immune system and an increased susceptibility to infection. Free radical activity associated with ageing, may contribute to this lowered immune response, and that improved antioxidant levels may have an immunostimulatory effect [1]. Oxidative stress (free radical damage) has been implicated in the development of various causes of disability in elderly people, including cognitive impairment and Alzheimer’s disease, impaired immune function, cataracts and age-related macular degeneration [1].
Antioxidants protect the body from free radical damage. Vitamin E is the major antioxidant vitamin in body tissues and is considered the first line of defense against cell membrane damage [2]. Other Antioxidant defenses that protect the body from free radical damage include vitamin C and beta carotene. The dietary reference intake (recommended daily allowance) for vitamin C is 60 mg and for vitamin E is 12 mg [3]. The suggested consumption of beta carotene is 3 mg per day [4].
People are becoming more cautious of what they eat and are striving to eat healthy as evidenced by the consumer demand for healthier products. Yogurt is considered a healthy food product because of its health beneficial culture bacteria and relatively low caloric content [5]. Yogurt growth has been steadily increasing in the US over the past 5 years [6]. Whether or not use of antioxidants alter the quality characteristics of yogurt would be interesting to know. The objective was to study the influence of various antioxidants on the characteristics of plain yogurt.
2. Materials and Methods
2.1. Yogurt Manufacture
Yogurts were manufactured using standard procedure [7,8] with slight alteration of the incorporation of the antioxidants in the yogurt mix. The antioxidants namely vitamin C, vitamin E and beta carotene were incorporated individually at 60, 12 and 3 mg respectively and a total of 60, 12 and 3 mg respectively all together in 240 mL of yogurt. Product manufacture was replicated three times.
2.2. Syneresis
The released whey in the yogurt samples was measured by inverting a 300 g sample on a fine mesh screen placed on top of a funnel. After 2 h of drainage at 21 C, the quantity of whey collected in a graduated cylinder was used as the index of syneresis.
2.3. Apparent Viscosity
The apparent viscosities was determined at 21˚C using a Brookfield DV II+ viscometer (Brookfield Engineering Lab Inc, Stoughton, MA) with a helipath stand. A T-C spindle was used at 10 rpm. The data were acquired using the Wingather software (Brookfield). A hundred data points will be averaged per replication. Three replications were conducted.
2.4. pH
The pH was determined using an Orion pH meter model 250 A/610 (Fisher Scientific, Instruments, Pittsburgh, PA) calibrated using commercial pH 4.00 and 7.00 buffers (Fisher Scientific).
2.5. Lactic Acid Bacterial Counts
Streptococcus thermophilus counts were determined by plating on M17 agar followed by aerobic incubation at 37˚C for 48 h. The Lactobacillus bulgaricus counts were etermined using MRS agar at pH 5.4 followed by anaerobic incubatiion for 72 h at 43˚C.
2.6. Sensory
Sensory evaluations were conducted by a seven member experienced panel on the yogurt coded with three digit random number codes. The official American Dairy Science Association Intercollegiate Dairy Products Evaluation Contest Score Card for flavor with a 10 point scale (10 = no criticism), for body and texture texture with a 5 point scale (5 = no criticism) and appearance and color with a 5 point scale (5 = no criticism) were used.
2.7. Statistical Analyses
Data were analyzed by ANOVA using the Proc mixed linear model procedure of SAS [9]. Means were separated using the least significant difference test. Significant differences were determined at α = 0.05.
3. Results and Discussion
The pH values are shown in Table 1. The treatment x week interaction effect was not significant nor was the treatment effect significant (Table 2), but the week effect was significant (Table 2). The pH at week 1 was significantly higher than the pH’s at weeks 2 and 3 which were not significantly different from each other. As the lactic acid bacteria grow in the yogurts over time they use up lactose which is converted to lactic acid which has a lowering effect on the pH [7] hence the pH values at week 2 and 3 were lower than week 1.
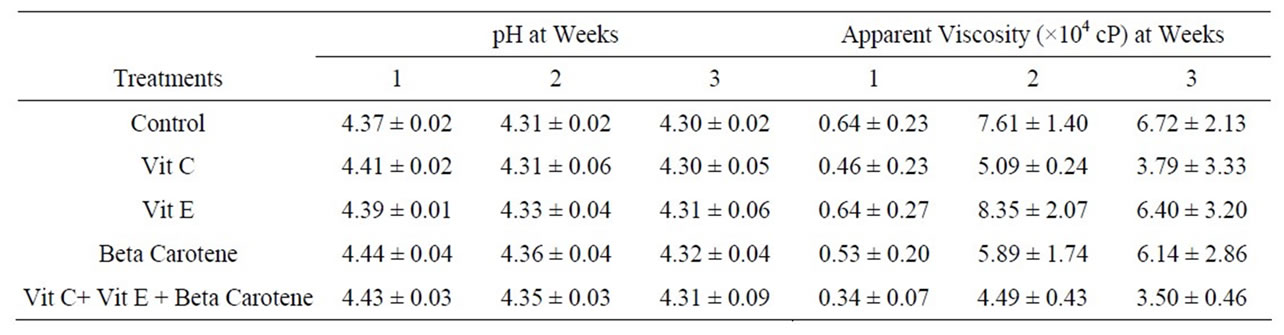
Table 1. Mean ± SD of pH and apparent viscosity of the various yogurts over a storage period.
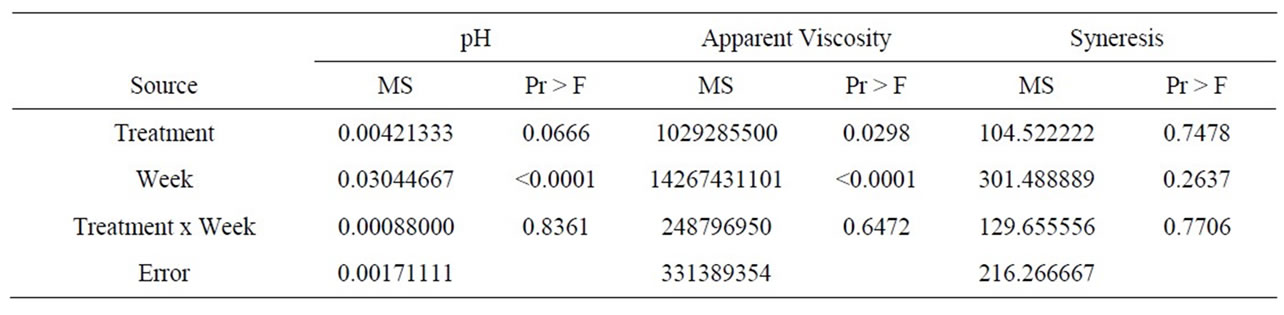
Table 2. Mean squares and Pr > F of treatment, storage time and their interaction for pH, apparent viscosity and syneresis.
Apparent viscosity values are reported in Table 1. The treatment x week interaction effect was not significant (Table 2). The different antioxidants significantly (p = 0.0298) influenced viscosity. Yogurts with vitamin C and yogurts with vitamin C + vitamin E + beta carotene had significantly lower viscosities compared to the control, yogurts with vitamin E and yogurts with beta carotene which were not significantly different from each other.
Added ascorbic acid (vitamin C) individually or in combination with other antioxidants may have influenced the casein micelle matrix of the yogurt to lower its viscosity. Acids are known to influence protein structure. Viscosity at week 1 was significantly lower than the viscosities at weeks 2 and 3 which were not different from each other. At week 1 the pH was higher than at weeks 2 and 3. A lower pH causes more contraction of the matrix resulting in a stronger matrix hence increased viscosity.
Syneresis is the serum released from the product. The syneresis values are presented in Table 3. The treatment x week interaction effect was not significant, nor were the treatment or week effects significant (Table 2). This probably is because the changes in pH comparing week 1 to weeks 2 and 3 were only slight and not major enough to result in excessive contraction of matrix to expel greater amounts of serum.
Lactic acid bacterial counts were converted to log10 scale before the data were analyzed by SAS. The counts are reported in Table 3. The treatment x week interaction effect was not significant, nor was the treatment effect significant (Table 4). The week effect was significant. The counts at week 3 were significantly lower compared to counts at weeks 1 and 2 which were not significantly different from each other. The lactic acid bacteria start dying towards the end of the shelf life of the product because of slight drop in pH and metabolites such as organic acids produced by the bacteria [7].
Flavor scores are reported in Table 5. The treatment x week interaction effect was not significant, but the treatment main effect and week main effect were significant (Table 6). Flavor scores for yogurts with vitamin E and yogurts with beta carotene were high and not significantly different form each other. Flavor scores for yogurts with vitamin E were significantly higher than the control. Yogurts with vitamin C + vitamin E + beta carotene were not different from control but were significantly lower than yogurts with vitamin E and beta carotene. An ingredient or an additive will typically bring its flavor along with it to the product. In this case the flavor contributions were favorable because they were higher than the control.
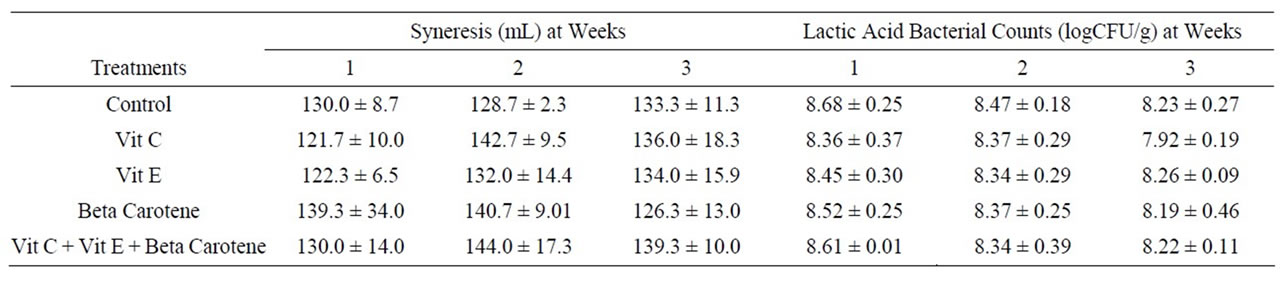
Table 3. Mean + SD of syneresis and lactic acid bacterial counts of the various yogurts over a storage period.
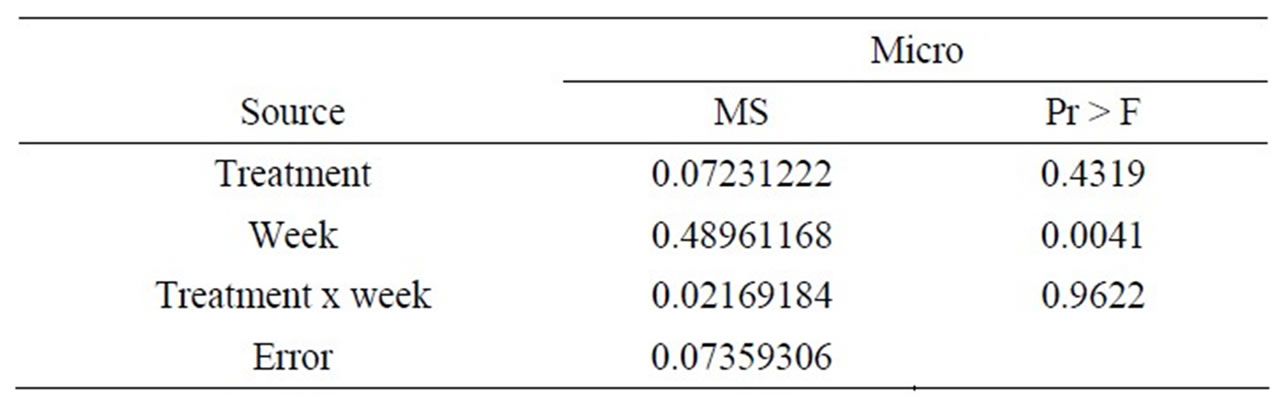
Table 4. Mean squares and Pr > F of treatment, storage time and their interaction for Lactobacilli counts.
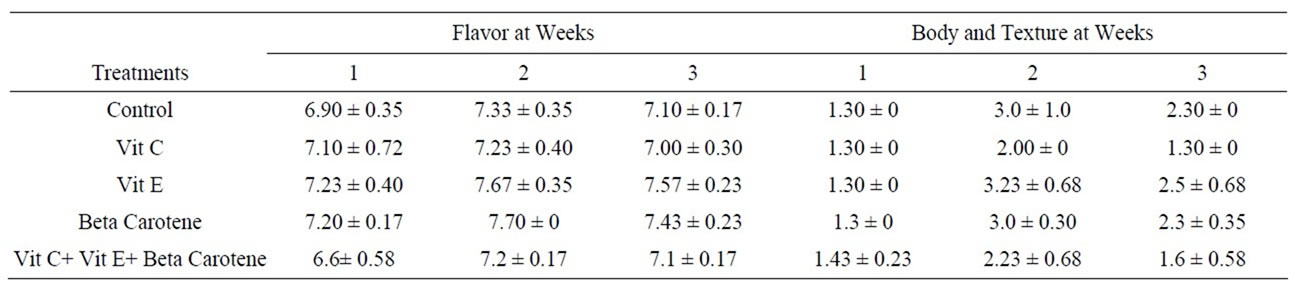
Table 5. Mean + SD of flavor and body texture of the various yogurts over a storage period.
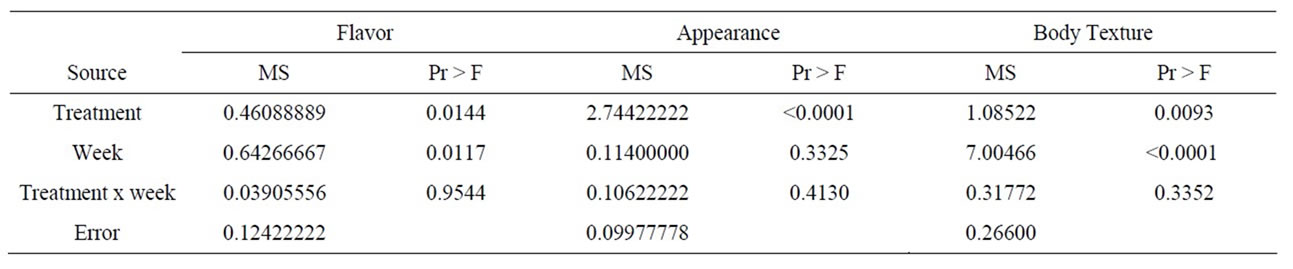
Table 6. Mean squares and Pr > F of treatment, storage time and their interaction for flavor, appearance and body texture.
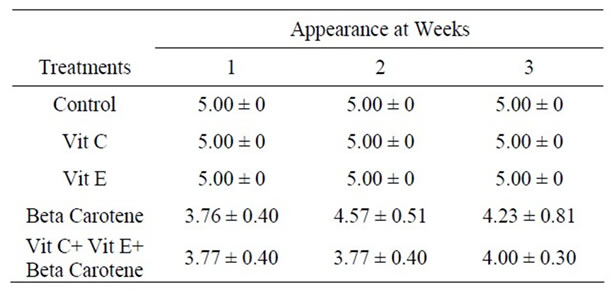
Table 7. Mean + SD of appearance values of the various yogurts over a storage period.
Yogurts at week 2 had significantly higher scores compared to yogurts at week 1. This probably was because compared to week 1 the pH at week 2 was lower. As the lactic acid bacteria use up the lactose more lactic acid is produced [7] which influences the overall flavor of the product.
Body and texture scores are shown in Table 5. The treatment x week interaction effect was not significant, but the treatment main effect and week main effect were significant (Table 6). Yogurt with vitamin E had higher scores compared to the control while yogurts with vitamin C had lower scores compared to the control. The remaining yogurts had scores not significantly different compared to the control. Yogurts at week 2 had the highest scores followed by yogurts at week 3, while yogurts at week 1 had the lowest body and texture scores.
Appearance scores are reported in Table 7. The treatment x week interaction effect was not significant, neither was the week effect significant, but the treatment effect was significant (Table 6). Control yogurts and yogurts with vitamin C and yogurts with vitamin E had significantly high appearance scores which were not significantly different from each other but were significantly higher than yogurts with beta carotene and yogurts with vitamin C + vitamin E + beta carotene. This is because beta carotene brings its own orange color to the product. Although beta carotene has health advantages it need to be used in extreme moderation because excessive use will negatively influence product appearance.
4. Conclusion
Use of antioxidants in yogurt manufacture significantly influenced yogurt viscosity, flavor, appearance, body texture but did not influence syneresis, lactic acid bacterial counts and pH. Depending upon the application antioxidants can be recommended in yogurt manufacture.
REFERENCES
- C. J. Rhodes, “Toxicology of the Human Environment— The Critical Role of Free Radicals,” CRC Press, London, 2000, p. 512.
- B. Brigelius-Flohe and Traber, “Vitamin E: Function and Metabolism,” Federation of American Societies for Experimental Biology, Vol. 13, 1999, pp. 1145-1155.
- USDA, “National Agricultural Library,” 2012. http://fnic.nal.usda.gov/dietary-guidance/dietary-reference-intakes/dri-tables
- “Beta Carotene Foods,” 2012. http://healthandenergyfoods.com/betacarotene-foods-rda
- R. C. Chandan, “Enhancing the Market Value of Milk by Adding Cultures,” Journal of Dairy Science, Vol. 82, No. 10, 1990, pp. 2245-2256. doi:10.3168/jds.S0022-0302(99)75472-X
- “Dairy Facts,” International Dairy Foods Association, Washington DC, 2011.
- F. V. Kosikowski, “Cheese and Fermented Milk Foods,” 2nd Edition, F. V. Kosikowski, Ithaca, 1982.
- K. J. Aryana, “Folic Acid fortified Fat Free Plain Set Yogurts,” International Journal of Dairy Technology, Vol. 56, No. 4, 2003, pp. 219-222. doi:10.1046/j.1471-0307.2003.00105.x
- SAS Institute, “SAS Software 9.1 for Windows,” SAS Institute Inc., Cary, 2003.