Food and Nutrition Sciences
Vol. 3 No. 1 (2012) , Article ID: 17084 , 9 pages DOI:10.4236/fns.2012.31013
Evaluation of Bitterness Intensity of Citrus Products by an Untrained Panel Using Relative-to-Reference Rating
![]()
UMR 1145, AgroParisTech/INRA (Institut Nationale de la Recherche Agronomique), CNAM (Conservatoire National des Arts et Mé- tiers), Massy, France.
Email: sophie.deterre@agroparistech.fr
Received September 16th, 2011; revised October 19th, 2011; accepted October 27th, 2011
Keywords: Unstructured Relative-to-Reference Scaling; Untrained Subjects; Bitterness; Naringin; Bitter Orange Products
ABSTRACT
In order to estimate the bitterness intensity of citrus products we applied an adaptative sensory evaluation method, using naringin as the reference for bitterness. Twenty-five untrained subjects participated in this study. Firstly they tasted and positioned 2 naringin references on an unstructured relative-to-reference scaling to define their own bitterness scales. They then evaluated the bitterness intensity of 2 types of bitter orange products (3 distillates and 2 cold-pressed essential oils of bitter orange peels) according to their own perceptions on their own scales. We observed that 2 types of scale use could be distinguished that might be related to subjects’ sensitivity or/and consumption habits to bitterness. As a result, we observed a significant difference in bitterness intensity between the crude cold-pressed essential oil and the debittered one of bitter orange, whereas there was no significant difference between the 3 distillates. This approach makes it possible to take inter-individual differences in subjects’ sensitivity into account. It also provides a way to very simply rate bitterness intensity with subjects who have received no prior training in sensory evaluation.
1. Introduction
Bitterness is one of the so called “basic-taste” qualities in food and beverages. Various types of scales have been used to evaluate the bitterness intensity: structured category scale from 1 to 5 [1-3] or from 1 to 10 (Pripp et al. 2004) or a 15 cm line-scale anchored with “no perception” and “very strong” [4-6]. Most studies implying bitterness intensity assessment either require prior training or do not consider the training issue at all. However, untrained subjects’ innate ability to rate bitterness should not be taken for granted [7].
In this study, we deliberately worked with a relatively small panel of untrained subjects in order to be in the same conditions as so-called “intern panels” that are frequently used in small-size private companies where only few people can participate in the taste tests and where there is usually not much time to train them.
Frequently, chemical references are used to define bitterness or to help subjects evaluating it. For instance, caffeine (0.27 g·L–1 of caffeine for detection [8]; 0.8 g·L–1 [9]) or quinine (0.5 g·L–1 of quinine hydrochloride [10] are probably the most frequently used references. Haseleu et al. [11] proposed a more comprehensive definition of bitterness with 3 different reference solutions: MgSO4 (166 mmol·L–1) representing a short-lasting metallic bitter taste quality, salicin (1.4 mmol·L–1) imparting a longlasting bitter taste sensation, perceived mainly at the back of the tongue as well as in the throat, and caffeine (8.0 mmol·L–1) providing a long-lasting bitterness perceived throughout the oral cavity.
In citrus products, the origins of bitterness are specific flavonoids called flavanones (refreshing) and limonoids (unpleasant aftertaste [12]). Flavanones represent most of the citrus flavonoids [13], and naringin is one of the most abundant of them [14] found in the albedo of bitter orange peels [15]. For this reason, we decided to use naringin as a reference to evaluate the bitterness intensity of the bitter orange essential oil (EO) and its distillate. The strong bitterness due to naringin can be detected at a dilution of 1:50,000 [16]. Bitter orange peels contain about 5 mg·g–1 of naringin (Sawalha et al. 2009). Soldo and Hofmann [17] reported that when diluted in water, naringin was perceived as slightly bitter at 0.03 mmol·L–1, relatively bitter at 0.07 mmol·L–1 and very bitter at 0.25 mmol·L–1.
In the present study we used relative-to-reference scaling. Stoer and Lawless [18] argued that a great advantage of the relative-to-reference scaling is that it can be used in studies with untrained subjects. Also, according to Larson-Powers and Pangborn [19]: “Anchoring the description to a reference, and expressing results in terms of the positive and negative deviations from a reference, improves both the precision and accuracy of the responses, compared to the unanchored descriptive method.” The number of references used for calibrating the scale differs widely from one study to another. Many authors used only one reference (i.e. at one concentration) [9,18,20] while others fully calibrate intensity scales using many concentrations (see for instance [21]. Here we chose 2 references (low and high concentrations of naringin) in order to determine high and low levels of bitterness, which allow defining interval properties of the scale. We therefore let each subject calibrate his own visual analog linear scale according to his personal perception of these 2 references.
In order to better characterize inter-individual differences in terms of bitterness perception, we measured our subjects’ sensitivity to quinine which is commonly recognized for its distinctive bitter taste. Moreover, since individual bitter taste sensitivity may be related to the consumption of products like coffee or beer [22,23], a questionnaire about consumption habits of some bitter products was submitted to the subjects.
Citrus products such as EO from citrus peelings or their distillates are often added to foods and beverages to enhance their citrus flavor [24,25]. These products however also cause bitterness which may be perceived as an unpleasant taste. After extraction, essential oil can undergo various debittering treatments [26,27]. The underlying motive of this study was to look at the efficiency of the debittering treatments applied to bitter orange EO and peel distillates on bitterness intensity. Our purpose was first to observe how each untrained subject positioned the references prepared with 2 matrices (oil and water) on the linear scale according to his/her own sensations. Secondly, we observed how untrained subjects used their own scales to evaluate the bitterness intensity of citrus products. Finally, we discussed the practical sensory conditions and suggest some means of improving them.
2. Materials and Methods
2.1. Chemicals
Naringin (≥90%) was purchased from Sigma-Aldrich, Co. (St Louis, MO, USA). Quinine was obtained from Extrasynthese (Genay, France). Bottled water (Evian, low mineralization: 405 mg·L–1, pH 5.2) and commercial sunflower oil were bought from a local grocery store.
2.2. References for Bitterness Scalings
Two naringin concentrations, established from the Soldo and Hofmann study [17], were chosen from preliminary testing so that their perceived bitterness would frame those of EO and distillate samples. Two references were thus prepared at slightly bitter (0.38 g·L–1) and very bitter (6.12 g·L–1) concentrations. Reference solutions for the sensory analysis of EO and distillate samples were thus prepared with sunflower oil and Evian bottled-water, respectively. References were coded with letters.
2.3. Essential Oil and Distillate Samples
Cold-pressed EO from Citrus aurantium L. from the West Indies was produced in May 2009. The debittering treatment was conducted in January 2010. Two samples of EO were studied before and after the debittering treatment: crude EO (cEO) and treated EO (tEO).
Bitter orange peel distillates were from a private food company and produced in December 2009. Three samples of distillate obtained with various treatments were studied. They were produced with different peeling percentage and maceration steps before distillation:
• Control distillate: 100% of peeling efficiency (without albedo) with maceration step (control CD);
• Distillate 1: 90% of peeling with maceration step (D1);
• Distillate 2: 90% of peeling without maceration step (D2).
The EO (crude and treated) tastes were judged too strong to be tasted on the tongue. Therefore, for sensory analysis we decided to prepare them with a 1:4 dilution by adding sunflower oil.
For the preparation of the 3 distillate samples, we wanted to reach a degree of alcohol that did not anesthetize the tongue nor mask the basic tastes. As a matter of fact, it is well-known that ethanol increases bitterness [28]. We decided to work with diluted distillates at 15% vol of ethanol [29,30] with bottled water for the sensory analysis. The degree of alcohol was checked using a densimeter (Anton Paar DM35N). All the samples were coded with three-digit numbers and were kept at a cool temperature (4˚C).
2.4. Sensory Evaluation
Participants. Twenty-five subjects (from 22 to 60 years of age) were recruited for being motivated and available to participate in a three-session sensory analysis (Table 1).
Fourteen subjects were from AgroParisTech (subjects J1 to J14) and eleven subjects were plant workers from a private food company (subjects J15 to J25). Warnings about EO and terpene (e.g. limonene) allergies were given before starting the study.
After all sensory sessions had been completed, a questionnaire relating to bitter food consumption habits was
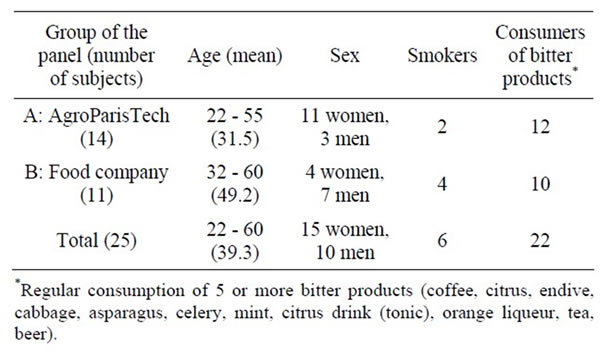
Table 1. Summary of participants.
submitted to the participants. Additional questions regarding their smoker status and any current medical treatments were also asked.
Detection threshold test. The detection threshold sessions were conducted over 2 days in the same week. Detection thresholds were measured for quinine using the ascending series, 2-AFC method [31]. Beginning with the lowest concentration, subjects received serial dilutions of quinine beginning at 400 µM [32] in bottled water (Evian) and progressing in 10 steps of successive decreasing dilutions (dilution factor 2) and a bottled water control. Subjects were thus presented with successive pairs of samples in coded plastic cups and their task was to indicate which cup tasted stronger. If the subject was incorrect at one concentration level, the next pair of samples (higher concentration level) was presented. The threshold was defined as the lowest quinine concentration correctly chosen versus water among 4 consecutive correct trials [33]. All threshold measurement sessions were carried out the same day for a given group.
Product bitterness evaluation. Four days of evaluation sessions were organized over a two-week period on Thursdays and Fridays between 9 am and 12 am. While tasting conditions differed slightly between the AgroParisTech group and the plant group, all sessions took place in a quiet room at warm temperature (~20˚C). Subjects evaluated the distillate samples during the first day (Day 1) and EO samples during the second day (Day 2).
References and samples were placed at room temperature 1h before the session start. Twenty millilitres of each distillate sample and corresponding reference were poured into clear plastic cups (30 mL graduated cup, 47 mm in diameter and 31 mm in height with airtight lid). The same operation was carried out with 15 mL of each EO sample and corresponding reference. Each subject was thus given a tray with the 2 references (low and high concentrations) and 3 distillate samples or 2 EO samples depending on the session. Subjects were also given a rating form (Figure 1) and oral instructions on how to proceed. This was repeated 3 times in a row for each subject.
First of all, the 2 coded references were tasted accord-
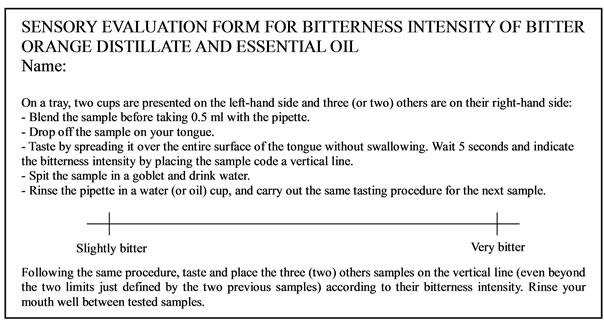
Figure 1. Sensory evaluation form.
ing to a sip-and-spit protocol [34-36]. Subjects took 0.5 mL from the cup with a plastic pipette (7 mL graduated Pasteur pipette up to 3 mL, purchased from VWR International). They held the sample on their tongue for 5 seconds before estimating the bitterness intensity on a 16 cm line scale. Indeed, preliminary tests indicated that 5 seconds were necessary to perceive the delayed bitterness taste. Subjects were asked to rinse their mouth with water (Evian) and to wait between samples until they felt they had recovered a neutral taste sensation on their tongue [36-38]. They had to position the references when starting each repetition. Once the references had been evaluated and rated, EO or distillate samples were evaluated in the same way on the same linear scale. Subjects also had to rinse the pipette between each sample with the same solvent used for the sample dilutions: either sunflower oil or bottled water for the EO and distillate samples, respectively. After the test was completed, the experimenter measured the bitterness ratings for the references and for the samples, and recorded them on an Excel spreadsheet for subsequent data analysis.
Evaluation conditions. All tests took place in either AgroParisTech facilities or the food company, in a silent room with natural light at room temperature (mid-March). A maximum of five subjects performed the evaluation at the same time to keep a silent atmosphere. They were placed in an isolated spot with no possibility of communicating with other subjects. The first tray was given with 2 references on their left-hand side and samples in random order on their right-hand side. Glasses of water and/ or sunflower oil, napkins and pipettes were also provided. First, subjects had to read the form and then, 2 minutes later, we checked that everything was well understood before starting the analysis. During the session subjects could ask for more water, sunflower oil, napkins or pipettes. Subjects took about 30 minutes to complete the 3 repetitions in a row. After the EO sample evaluation (Day 2), the questionnaire was submitted to the subjects.
2.5. Data Analysis
The bitterness of each sample was evaluated by the subjects relative to the perceived intensity of the reference solutions. For every subject, the distance between references (reference inferior (refinf)—reference superior (ref sup)) was arbitrarily given a value of 10 units (Figure 2). Bitterness ratings were thus converted for each subject according to his/her own reference scale. Absolute ratings for references were also considered for analyzing the use of the scale.
A Student’s t test was performed to determine the significance of differences of detection thresholds between 2 groups of subjects and of bitterness taste between the 2 EO (cEO and tEO). Chi2 tests were also performed to determine the significance of differences among subjects’ consumption. The difference in bitterness intensity between the 3 distillates (CD, D1 and D2) was tested by Analysis of variance (ANOVA). The level of signifycance was chosen as p < 0.05. All analyses were performed with XLSTAT (Addinsoft XLSTAT v 2010.5.01).
3. Results and Discussion
3.1. Use of Intensity Scales with Untrained Subjects
Inter-individual differences in bitter perception were cited in the literature [39-42]. It is for this reason that we chose to evaluate the feasibility of estimating the bitterness intensity of citrus products with subjects who were not specifically selected nor trained to evaluate this characteristic.
When analyzing the positioning of the bitterness references for each individual over 3 repetitions, we observed that most of the subjects are very well repeatable and positioned the refinf close to the “slightly bitter” anchor (mean of 1.4 cm). Regarding the [refinf – refsup] distance, 2 groups of subjects can however be distinguished: one group of 18 subjects (group 1) who placed an important distance between the 2 references (mean [refinf – refsup] = 11.1 cm in water and 7.2 cm in oil) and a second group of 7 subjects (group 2) who placed a small distance between references (mean [refinf – refsup] = 3.9 cm in water and 2.2 cm in oil). We hypothesized that these 2 different uses of the scale is related to subjects’ sensitivity to bitterness. In order to test this, we compared subjects’ detection thresholds to quinine for these 2 groups. Group 1 indeed has a slightly more sensitivity to quinine than group 2. This difference is however not significant (tdf = 24 = 1.087, p = 0.144). It could also be noted that the threshold values are widely dispersed (from 10–4 g·L–1 to 10–1 g·L–1) irrespective of the group of subjects. It is thus difficult to conclude on a possible effect of the sensitivity to quinine on the scaling use, especially with such a small sample size.
Moreover we examined the bitter product consumption habits of these subjects, as recorded with our questionnaire. This shows that group 1 was characterized by higher consumption of beer, asparagus and orange liqueur, whereas group 2 had a tendency to consume more grapefruit and tea (Figure 3).
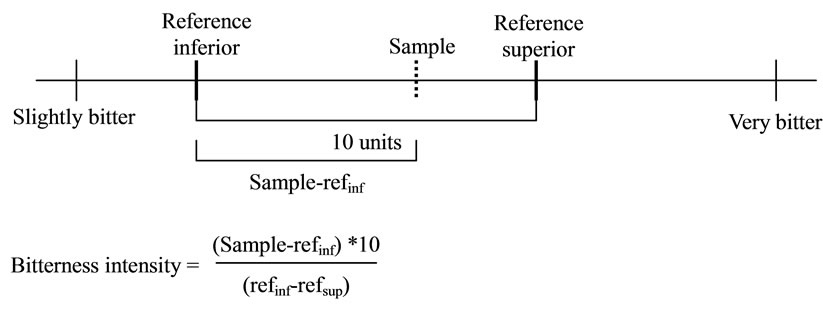
Figure 2. Calculation of the distance of bitterness intensity according to references positions placed by each subject.
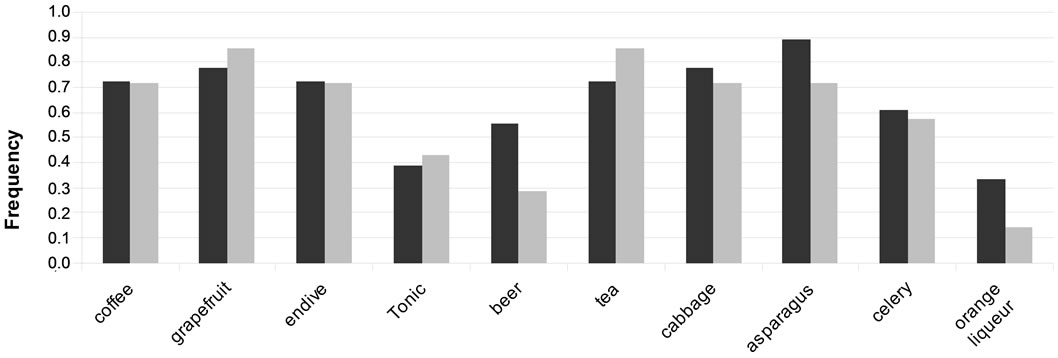
Figure 3. Frequencies of the bitter products consumption for the group 1 (dark) and the group 2 (light).
But again, Chi2 tests indicate that none of the differences of consumption between the 2 groups were significant. These observations about the detection thresholds and the consumption habits were to be expected given the small number of participants and the size of these 2 groups.
3.2. Nature of the Testing Matrix: Oil or Water
We observe that the subjects positioned the references in the same way regardless of the nature of the matrix (i.e. oil or water) over the 3 repetitions. However 4 subjects (J2, J10, J22 and J25) placed apart the 2 references in water (mean [refinf – refsup] = 11.9 cm) while they positioned the 2 references in oil very close together (mean [refinf – refsup] = 1.9 cm). We may hypothesize that these subjects perceive the bitterness difference less clearly in an oily matrix than in aqueous solution. This observation agrees with Thurgood and Martini [43] who found that the bitterness was perceived with a lower intensity in a lipid phase than in an aqueous solution.
Another option would have been to change the oily matrices used for testing the EO and references. For example, using an emulsion instead of plain oil could have been more appropriate. However, any modification in the structure of the matrix (e.g. the droplet size of the emulsion [38,43]) or in the nature of the lipids [37] could also influence taste perception.
3.3. Position of Samples According the References
It is interesting to analyze how the subjects positioned the sample depending on the way they initially positioned the references. Hence, for each of the 2 groups we studied where the EO and distillate samples were positioned relatively to inter-reference distances (Figures 4 and 5).
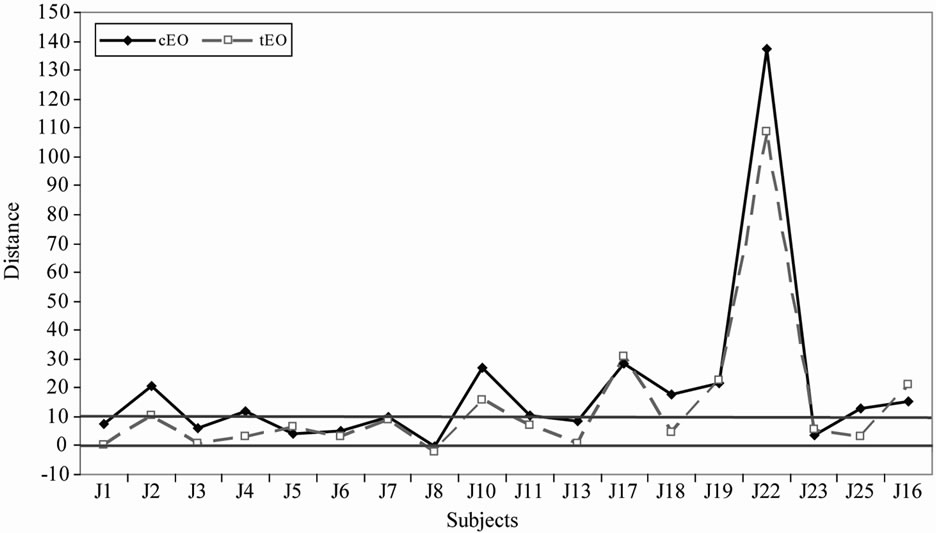 (a)
(a)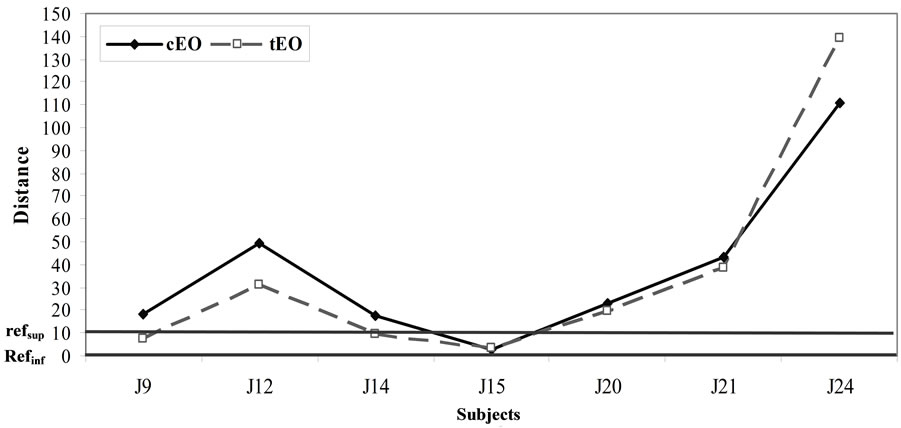 (b)
(b)
Figure 4. Use of the relative-to-reference scale with EO samples for the group 1(a) and group 2(b).
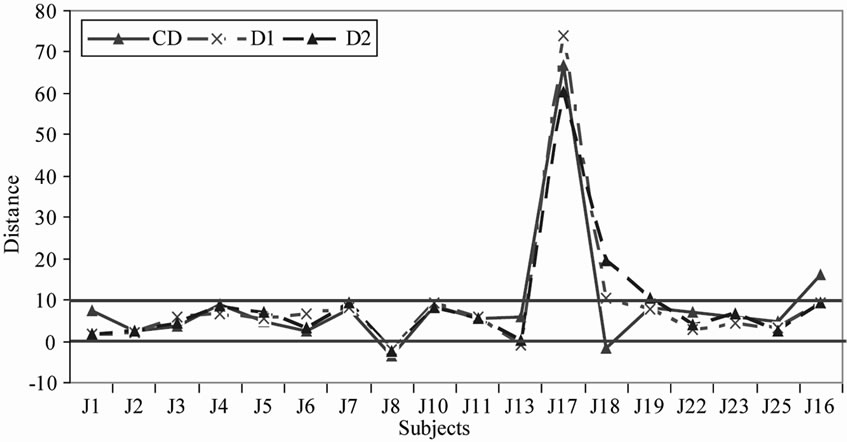 (a)
(a)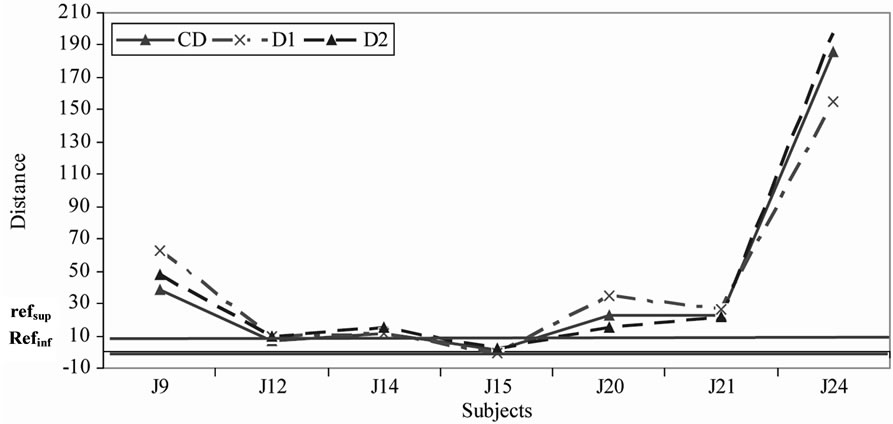 (b)
(b)
Figure 5. Use of the relative-to-reference scale with distillate samples for the group 1(a) and group 2(b).
In general we noticed that the distillate samples are more frequently positioned between the 2 references than the EO samples in the 3 repetitions.
For group 1, most subjects positioned the samples either between the 2 references or very close to the references. This is notably the case for the distillate samples (Figure 5(a)), which means that the references frame the subjects’ representations of the bitterness range well. However we note that 2 subjects (J22 for the EO samples and J17 for the distillate samples) perceived the sample bitterness as much stronger than that of the bitterest reference (Figures 4(a) and 5(a)). On the opposite for group 2, the subjects tended to position at least one of the samples beyond (bitterer than) the references (Figures 4(b) and 5(b)) with the exception of J15 who always positioned the samples between the 2 references.
These observations indicate that our choices of concentrations for references in the aqueous matrix was pertinent, while is seemed to be less adequate for the references in the oily matrix. This difficulty may be related to the issues of measuring taste perception in oily matrices as discussed above.
3.4. Practical Sensory Considerations
According to subjects’ feedback, positioning of bitter references was in itself easy. Overall, subjects found distillate samples pleasant to evaluate because of the orange flavor. It is noteworthy that several subjects reported a sweet sensation associated to the orange flavor, in spite of the fact that those samples contained no sweetening substances.
The only practical problem we faced was that many subjects reported that after tasting oily samples, the mouth cleansing was difficult and the tongue sensations took longer to be recovered than after tasting aqueous samples. The cleansing efficiency could have been improved by providing subjects with a different mouth-cleanser.
Moreover, as required in our evaluation instructions, the subjects kept the samples in their mouth for at least 5 seconds before evaluation. As we had experienced during the pretests, the subjects confirmed that bitterness perception came later on the tongue, especially with the EO samples. This delayed bitterness might be linked either to a matrix effect or to limonin that is well-known to have strong and delayed bitterness [44-48]. HPLC analyses (data not shown) indeed revealed that limonin was present in both the EO samples (around cEO = 32 mg·mL–1 and tEO = 28 mg·mL–1). Unexpectedly, naringin was not detected by these analyses, which may eventually draw into question our choice to use naringin as a reference. What is more, other non-identified compounds could also contribute to the bitterness perception. Subsequent chemical analyses would be required to elucidate this point.
3.5. Differences of Bitterness Intensity
With a Student’s test, we noticed a significant difference in bitterness between the 2 EO (tdf = 24 = 1.882; p = 0.036). The debittering treatment is thus efficient for decreasing the bitterness of bitter orange essential oil. However, regarding the ANOVA analyses, there were no signifycant differences between the 3 distillates in terms of bitterness intensity, even with the most sensitive group (group 1). The initial treatment of the orange peelings (peeling percentage, maceration) thus has either no effect or a minor effect that is leveled by distillation.
4. Conclusion
The relative-to-reference rating method allowed us to estimate differences of bitterness intensity between citrus products with untrained subjects. With appropriate sample preparation, the bitterness intensity of oily and hydro-alcoholic samples can be easily evaluated. Subjects’ uses of the scale seemed to be related to their sensitivity to quinine, even though our data do not allow us to firmly conclude on this point. In both solvents (oil and water), naringin reference concentrations are easily evaluated and appeared to be close to the panel’s representation of bitterness intensity. Naringin appeared to be a good a priori choice of a bitter reference, but further knowledge on specific bitter compounds, such as limonin, that was present in the evaluated products, merit study. Regarding repeatability, untrained subjects give good and reliable bitterness perceived. This choice of methodology seems to be relevant for the evaluation of bitterness of citrus products, and it could be qualified by chemical composition analysis. This work can help in targeting efficient treatments and processes, which contribute to decreasing the bitterness of citrus products.
5. Acknowledgements
We would like to thank Donald White from the A.B.I.E.S. doctoral school, for his kind help in the writing of this article.
REFERENCES
- F. Gutierrez, M. A. Albi, R. Palma, J. J. Rios and J. M. Olias, “Bitter Taste of Virgin Olive Oil: Correlation of Sensory Evaluation and Instrumental HPLC Analysis,” Journal of Food Science, Vol. 54, No. 1, 1989, pp. 68-70. doi:10.1111/j.1365-2621.1989.tb08569.x
- F. Gutierrez-Rosales, S. Perdiguero, R. Guterriez and J. M. Olias, “Evaluation of the Bitter Taste in Virgin Olive Oil,” Journal of the American Oil Chemists’ Society, Vol. 69, No. 4, 1992, p. 394.
- F. Gutierrez-Rosales, J. J. Rios and M. A. L. Gomez-Rey, “Main Polyphenols in the Bitter Taste of Virgin Olive Oil. Structural Confirmation by On-Line Highperformance Liquid Chromatography Electrospray Ionisation Mass Spectrometry,” Journal of Agricultural and Food Chemistry, Vol. 51, No. 20, 2003, pp. 6021-6025. doi:10.1021/jf021199x
- ISO, “ISO 4121 Analyse Sensorielle. Lignes Directives Pour L’utilisation D’échelles de Réponses Quantitatives,” AFNOR, Ed., AFNOR, Paris, 2004.
- M. Esti, M. Contini, E. Moneta and F. Sinesio, “Phenolics Compounds and Temporal Perception of Bitterness and Pungency in Extra-Virgin Olive Oils: Changes Occurring Throughout Storage,” Food Chemistry, Vol. 113, No. 4, 2009, pp. 1095-1100. doi:10.1016/j.foodchem.2008.08.076
- F. Sinesio, E. Moneta and M. Esti, “The Dynamic Sensory Evaluation of Bitterness and Pungency in Virgin Olive Oil,” Food Quality and Preference, Vol. 16, No. 6, 2005, pp. 557-564. doi:10.1016/j.foodqual.2004.12.002
- M. O’Mahony, M. Goldenberg, J. Stedmon and J. Alford, “Confusion in the Use of the Taste Adjectives ‘Sour’ and ‘Bitter’,” Chemical Senses & Flavour, Vol. 4, No. 4, 1979, pp. 301-318.
- SO, “ISO 8586-1 Analyse Sensorielle. Guide General Pour L’election, L’entrainement et le Controle des Sujets,” In: AFNOR Ed., AFNOR, 1991.
- A. H. Pripp, J. Busch and R. Vreeker, “Effect of Viscosity, Sodium Caseinate and Oil on Bitterness Preception of Olive Oil Phenolics,” Food Quality and Preference, Vol. 15, 2004, pp. 375-382. doi:10.1016/S0950-3293(03)00084-3
- H. Valentova and J. Pokorny, “Effect of Edible Oils and Oil Emulsions on the Perception of Basic Tastes,” Nahrung, Vol. 42, No. 6, 1998, pp. 406-408. doi:10.1002/(SICI)1521-3803(199812)42:06<406::AID-FOOD406>3.3.CO;2-Q
- G. Haseleu, D. Intelmann and T. Hofmann, “Structure Determination and Sensory Evaluation of Novel Bitter Compounds Formed from B-Acids of Hop (Humulus lupulus L.) upon Wort Boiling,” Food Chemistry, Vol. 116, No. 1, 2009, pp. 71-81. doi:10.1016/j.foodchem.2009.02.008
- G. D. Manners, “Citrus Limonoids: Analysis, Bioactivity, and Biomedical Prospects,” Journal of Agricultural and Food Chemistry, Vol. 55, No. 21, 2007, pp. 8285-8294. doi:10.1021/jf071797h
- H. S. Lee, “HPLC Analysis of Phenolic Compounds,” In: L. M. L. Nollet, Ed., Food Analysis by HPLC Second edition Revised and Expanded, Marcel Dekker, Inc., Ghent, 2000, pp. 775-824.
- P. E. Shaw, “Fruits II,” In: H. Maarse, Ed., Volatile Compounds in Foods and Beverages, Dekker Marcel, Inc., New York, 1991, pp. 305-312, 323-327.
- S. Ranganna, V. S. Govindarajan and K. V. R. Ramana, “Citrus Fruits: Part II. Chemistry, Technology, and Quality Evaluation. B. Technology,” Critical Reviews in Food Science and Nutrition, Vol. 18, No 4, 1983, pp. 17-21, 63-65.
- J. B. S. Braveman, “II. The Epicarp or Flavedo D. Essential oils, III the Mesocarp or Albedo,” Citrus: Chemical Composition and Chemical Technology Products, Interscience Publishers, Inc., New York, 1949, pp. 40-102.
- T. Soldo and T. Hofmann, “Application of Hydrophilic Interaction Liquid Chromatography/Comparative Taste Dilution Analysis for Identification of a Bitter Inhibitor by a Combinatorial Approach Based on Maillard Reaction Chemistry,” Journal of Agricultural and Food Chemistry, Vol. 53, No. 23, 2005, pp. 9165-9171. doi:10.1021/jf051701o
- N. L. Stoer and H. T. Lawless, “Comparison of Single Product Scaling and Relative-to-Reference Scaling in Sensory Evaluation of Dairy Products,” Journal of Sensory Studies, Vol. 8, No. 4, 1992, pp. 257-270. doi:10.1111/j.1745-459X.1993.tb00218.x
- N. Larson-Powers and R. M. Pangborn, “Descriptive Analysis of the Sensory Properties of Beverages and Gelatins Containing Sucrose or Synthetic Sweeteners,” Journal of Food Science, Vol. 43, No. 1, 1978, pp. 47-51. doi:10.1111/j.1365-2621.1978.tb09733.x
- E. Liden, A. Ulander, F. Deniz and A. G. Gunnarsson, “Odor-Annoyance Estimates from Roadtraffic Combustion Exhausts: Calibration with Master Scaling Using Pyridine as a Reference,” Environment International, Vol. 23, No. 6, 1997, pp. 829-837. doi:10.1016/S0160-4120(97)00095-0
- M. C. Meilgaard, G. V. Civille and B. T. Carr, “Sensory Evaluation Techniques,” 3rd Edition, CRC Press LLC, Boca Raton, 1999. doi:10.1201/9781439832271
- S. Tanimura and R. D. Mattes, “Relationships between Bitter Taste Sensitivity and Consumption of Bitter Substances,” Journal of Sensory Studies, Vol. 8, No. 1, 1993, pp. 31-41. doi:10.1111/j.1745-459X.1993.tb00200.x
- R. D. Mattes, “Influences on Acceptance of Bitter Foods and Beverages,” Physiology & Behavior, Vol. 56, No. 6, 1994, pp. 1229-1236. doi:10.1016/0031-9384(94)90370-0
- G. Nota, D. Naviglio, R. Romano, V. Sabia, G. Attanasio and S. S. Musso, “Examination of the Lemon Peel Maceration Step in the Preparation of Lemon Liquor,” Industrie Delle Bevande, Vol. 159, No. 159, 1999, pp. 1-5.
- M. L. Crupi, R. Costa, P. Dugo, G. Dugo and L. Mondello, “A Comprehensive Study on the Chemical Composition and Aromatic Characteristics of Lemon Liquor,” Food Chemistry, Vol. 105, No. 2, 2007, pp. 771-783. doi:10.1016/j.foodchem.2007.01.041
- H. Vuorela, J. Pohjola, C. Krause and R. Hiltunen, “Application of Headspace Gas Chromatography in Essential Oil Analysis. Part IX. Selective Loss of Terpene Compounds during Hydrodistillation,” Flavour and Fragrance Journal, Vol. 4, No. 3, 1989, pp. 117-120. doi:10.1002/ffj.2730040307
- E. Guenther, “Essential Oils of the Genus Citrus,” In: E. Guenther, Ed., The Essentials Oils of the Plant Families Rutaceae and Labiatae, Vol. 3, Van Nostrand Reinhold, New York, 1949, pp. 190-203, 359.
- A. G. H. Lea and G. M. Arnold, “The Phenolics of Ciders: Bitterness and Astringency,” Journal of Agricultural and Food Chemistry, Vol. 29, No. 5, 1978, pp. 478-483. doi:10.1002/jsfa.2740290512
- Z. Panovska, A. Sediva, M. Jedelska and J. Pokorny, “Effect of Ethanol on Interactions of Bitter and Sweet Tastes in Aqueous Solutions,” Czech Journal of Food Sciences, Vol. 26, No. 2, 2008, pp. 139-145.
- J. Lin and I. Blank, “Odorants Generated by Thermally Induced Degradation of Phospholipids,” Journal of Agricultural and Food Chemistry, Vol. 51, No. 15, 2003, pp. 4364-4369. doi:10.1021/jf034300m
- W. S. Cain, J. F. Gent, R. B. Goodspeed and G. Leonard, “Evaluation of Olfactory Dysfunction in the Connecticut Chemosensory Clinical Research Center,” Laryngoscope, Vol. 98, 1988, pp. 83-88. doi:10.1288/00005537-198801000-00017
- B. Oberti, “Les Facteurs Chimiosensoriels Dans le Comportement Alimentaire des Tunisois,” Montpellier II, Montpellier, 1998.
- J. P. Lehrner, J. Gluck and M. Laska, “Odor Identification, Consistency of Label Use, Olfactory Threshold and Their Relationships to Odor Memory over the Human Lifespan,” Chemical Senses, Vol. 24, No. 3, 1999, pp. 337- 346. doi:10.1093/chemse/24.3.337
- S. S. Schiffman, B. J. Booth, M. L. Losee, S. D. Pecore and Z. S. Warwick, “Bitterness of Sweeteners as a Function of Concentration,” Brain Research Bulletin, Vol. 36, No. 5, 1995, pp. 505-513. doi:10.1016/0361-9230(94)00225-P
- L. Brühl, B. Matthäus, E. Fehling, B. Wiege, B. Lehmann, H. Luftmann, K. Bergander, K. Quiroga, A. Scheipers, O. Frank and T. Hofmann, “Identification of Bitter off-Taste Compounds in the Stored Cold Pressed Linseed Oil,” Journal of Agricultural and Food Chemistry, Vol. 55, No. 19, 2007, pp. 7864-7968. doi:10.1021/jf071136k
- L. Brühl, B. Matthäus, A. Scheipers and T. Hofmann, “Bitter off-Taste in Stored Cold-Pressed Linseed Oil Obtained from Different Varieties,” European Journal of Lipid Science and Technology, Vol. 110, No. 7, 2008, pp. 625-631. doi:10.1002/ejlt.200700314
- J. A. Garcia-Mesa, G. Pereira-Caro, A. Fernandez-Hernandez, C. G.-O. Civantos and R. Mateos, “Influence of Lipid Matrix in the Bitterness Perception of Virgin Olive Oil,” Food Quality and Preference, Vol. 19, No. 4, 2008, pp. 421-430. doi:10.1016/j.foodqual.2007.12.004
- K. Nakaya, T. Kohata, N. Doisaki, H. Ushio and T. Ohshima, “Effect of Oil Droplet Sizes of Oil-in-Water Emulsion on the Taste Impressions of Added Tastants,” Fisheries Science, Vol. 72, No. 4, 2006, pp. 877-883. doi:10.1111/j.1444-2906.2006.01230.x
- D. McCamey, T. M. Thorpe and J. P. McCarthy, “Bitterness in Foods and Beverages,” In: R. L. Rouseff, Ed., Developments in Food Science, Elsevier Science Publishers, Amsterdam, 1990, pp. 169-182.
- L. M. Bartoshuk, “Comparing Sensory Experiences across Individuals: Recent Psychophysical Advances Illuminate Genetic Variation in Taste Perception,” Chemical Senses, Vol. 25, No. 4, 2000, pp. 4647-460. doi:10.1093/chemse/25.4.447
- J. X. Guinard, D. Y. Hong and C. Budwig, “Time-Intensity Properties of Sweet and Bitter Stimuli: Implication for Sweet and Bitter Taste Chemoreception,” Journal of Sensory Studies, Vol. 10, No. 1, 1995, pp. 45-71. doi:10.1111/j.1745-459X.1995.tb00004.x
- D. R. Redd, T. Tanaka and A. H. McDaniel, “Diverse tastes: Genetics of Sweet and Bitter Perception,” Physiology & Behavior, Vol. 88, No. 3, 2006, pp. 215-226. doi:10.1016/j.physbeh.2006.05.033
- J. E. Thurgood and S. Martini, “Effects of Three Emulsion Compositions on Taste Thresholds and Intensity Ratings of Five Taste Compounds,” Journal of Sensory Studies, Vol. 25, No. 6, 2010, pp. 861-875. doi:10.1111/j.1745-459X.2010.00311.x
- C. A. McIntosh, R. L. ManSell and R. L. Rouseff, “Distribution of Limonin in the Fruit Tissues of Nine Grapefruit Cultivars,” Journal of Agricultural and Food Chemistry, Vol. 30, No. 4, 1982, pp. 689-692. doi:10.1021/jf00112a016
- C. A. McIntosh and R. L. Mansell, “Three-Dimensional Distribution of Limonin, Limonoate A-Ring Monolactone, and Naringin in the Fruit Tissues of Three Varieties of Citrus Paradisi,” Journal of Agricultural and Food Chemistry, Vol. 45, No. 8, 1997, pp. 2876-2883. doi:10.1021/jf970057d
- S. Abbasi, P. Zandi and E. Mirbagheri, “Quantitation of Limonin in Iranian Orange Juice Concentrates Using HighPerformance Liquid Chromatography and Spectrophotometric Methods,” European Food Research and Technology, Vol. 221, No. 1-2, 2005, pp. 202-207. doi:10.1007/s00217-005-1136-1
- S. Hasegawa and J. E. Hoagland, “Biosynthesis of Limonoids in Citrus,” Phytochemistry, Vol. 16, No. 4, 1977, pp. 469-471. doi:10.1016/S0031-9422(00)94330-9
- V. P. Maier and G. D. Beverly, “Limonin Monolactone, the Nonbitter Precursor Responsible for Delayed Bitterness in Certain Citrus Juices,” Journal of Food Science, Vol. 33, No. 5, 1968, pp. 488-492. doi:10.1111/j.1365-2621.1968.tb03661.x