Neuroscience & Medicine
Vol. 3 No. 4 (2012) , Article ID: 26231 , 14 pages DOI:10.4236/nm.2012.34050
Early Exposure to Environmental Toxin Contributes to Neuronal Vulnerability and Axonal Pathology in a Model of Familial ALS
![]()
1Department of Experimental Medicine, University of British Columbia, Vancouver, Canada; 2Department of Ophthalmology and Visual Sciences, University of British Columbia, Vancouver, Canada; 3Department of Neuroscience, University of British Columbia, Vancouver, Canada.
Email: cashawlab@gmail.com
Received September 13th, 2012; revised October 18th, 2012; accepted November 4th, 2012
Keywords: SOD1; ALS; Neurotoxin; Axonopathy; NMJ; Gliosis; Toxicity
ABSTRACT
Adult onset amyotrophic lateral sclerosis (ALS) arises due to progressive and irreversible functional deficits to the central nervous system, specifically the loss of motor neurons. Sporadic ALS causality is not well understood, but is almost certainly of multifactorial origin involving a combination of genetic and environmental factors. The discovery of endemic ALS in the native Chamorro population of Guam during the 1950s and the co-occurrence of Parkinsonism and dementia in some patients led to searches for environmental toxins that could be responsible. In the present paper, we report that an environmental neurotoxin enhances mutant superoxide dismutase (SOD)-induced spinal motor neuron death and pathology and induces motor axon abnormalities. These results cumulatively confirm earlier findings that exposure to an environmental toxin is sufficient to produce the disease phenotype and indicate a role for gene-environment interaction in some forms of the disease.
1. Introduction
Amyotrophic lateral sclerosis (ALS) is a progressive paralytic disorder that arises due to degeneration of motor neurons in the brain and spinal cord that invariably leads to respiratory failure and death. About 10% of all ALS cases are familial (FALS), inherited in an autosomal dominant manner, and approximately 20% of FALS cases are caused by mutations in the antioxidant enzyme, superoxide dismutase 1 (SOD1) [1]. The remainder are sporadic with no known cause, but are suspected to be of environmental origin and hence likely neurotoxins. In studies of SOD1G93A transgenic mice that model SOD1 FALS, functional deficits from vulnerable motor axon injury occurred early on during the presymptomatic period of disease [2-4]. Similar data have been observed in other lines of SOD1 ALS mice, with motor neuron injury causing significant motor unit loss during a presymptomatic window of time [3,4]. In spite of these and related studies of mSOD, there is considerable interest in identifying environmental causes for sporadic ALS (SALS) since purely genetic causal factors for ALS appear to account for only a small fraction of all disease cases. As the causes for sporadic ALS have not been clearly identifiedfocus has been concentrated on the mechanisms of motor neuron diseases of genetic origin with the hope that findings can be applied to sporadic cases [5,6], but the link for translating FALS findings to sporadic ALS is controversial [7-9].
While studies that focus on putative environmental toxins are relatively few, to date those that seek to find the link between toxins and genetic susceptibility are rarer [10].
Studies of the ALS disease cluster among the Chamorro people of Guam shortly after World War II provided evidence of environmental causation [11-13]. Similar to classical ALS, these Guamanian cases usually showed signs of upper and lower motor neuron losses developing invariably during the course of the illness while extraocular muscle weakness and objective sensory deficits were largely absent [14,15]. An atypical form of parkinsonism that presented with dementia emerged also with high incidence, sometimes overlapping with ALS in the same patient. All cases showed a wide distribution of Alzheimer’s-like neurofibrillary tangles in the absence of senile plaques [16]. Consistent with an environmental etiology, consumption of flour made from cycad seeds, a recognized feature of Chamorro culture for generations [17] appeared to be involved. Cycad seed flour was found to contain a variety of neurotoxins, some of which remained in the flour after washing. Of these, we focused our attention on several steryl glucosides (SG) [18-21]. These molecules are neurotoxic to primary neuronal and astroglial cultures [18] as well as to motor neuron-derived cell lines [20]. Moreover, synthetic SGs fed to mice caused motor deficits consistent with an ALS-PDC phenotype, notably a progressive motor neuron loss in spinal cord and later cell loss in the striatum [21,22]. Motor neuron loss in animal models is demonstrable by the cycad neurotoxins linked to Guamanian ALS and Parkinsonism [23,24]. In vivo studies in adult CD-1 mice exhibited dramatic motor deficits followed by progressive cognitive dysfunction after 30 days of exposure to cycad flour [23]. Following 70 days of cycad feeding, quantitative magnetic resonance imaging in adult CD-1 mice showed decreased volumes in lumbar cord grey matter, substantia nigra, striatum, motor cortex, and basal nuclei [24]. Collectively, these studies indicated a primarily neurotoxic etiology to ALS-PDC. By implication, neurotoxic etiologies might apply to other related diseases.
Similar data has been reported for SOD1G93A mice without cycad exposure, where the primary difference involved decreases in spinal cord white matter volume in transgenic animals [25]. In addition to spinal cord pathology in SOD1G93A mice, denervation of neuromuscular junctions was observed following followed by limited axon terminal sprouting that form new synaptic connections with denervated muscle fibers [26-28]. Studies in G93A transgenic mice have reported that motor axons innervating fast-twitch fatigable type IIB muscle fibers are selectively vulnerable and fail to sprout, while those innervating fast fatigue-resistant (type IIA) or slow (type I) fibers are resistant and retained their sprouting competence [3,4]. Motor axon abnormalities in the mutant SOD1 mouse model appeared to occur in a retrograde degenerative fashion, with intact proximal axons but with neuromuscular junction denervation [2]. Still the possibility of anterograde degeneration in ALS cannot be completely discounted [29], and human post mortem material is almost always from end stage patients where it is difficult to study pathological changes in the neuromuscular system with any accuracy. However, neuromuscular junction vulnerability may not play a key role in all forms of ALS, as noted in a mouse model of Guamanian ALS-PDC where lower motor neuron loss and pathology preceded denervation of the neuromuscular junction [30].
Although the data supporting neurotoxins in ALS, including the impact of SGs is intriguing, it is uncertain whether these or other toxins are alone responsible for the pathological outcomes or whether they may work in conjunction with genetic susceptibility factors. The idea of genetic and environmental interplay has been an established focus for numerous studies, and is not limited to neurodegenerative diseases [31,32]. Based on the above studies using cycad seed flour or the derived toxins, we tested the hypothesis that similar toxins could modify the onset and progression of disease symptoms in SOD1 transgenic mice. To explore this hypothesis, the current study distinguished between the pathological consequences of either genetic predisposition to neurodegeneration or neurotoxin acting alone on motor axons, and the site of primary pathogenesis when both stressors act in combination.
2. Materials and Methods
2.1. Animals
A colony of mice heterozygous for the G37R mutation (line 29) of the human gene for SOD1, were obtained from the laboratory of Dr. Neil Cashman (Vancouver, BC, Canada). The original breeder mice were produced by Dr. D.W. Cleveland by microinjecting a plasmid encoding wild type human SOD1 contained within 12 kb genomic DNA fragment into hybrid (C57BL/6J x C3H/- HeJ) F2 mouse embryos. The G37R mutation was introduced into the human SOD1 gene by PCR using a mutagenic primer. Transgenic mice from this founder line (line 29) express a (7-fold) increase in SOD1 activity in spinal cord, with pathology restricted to motor neurons in the spinal cord and brainstem [33]. The laboratory of Dr. Cashman maintained the transgene by breeding male hemizygotes to naive C57BL/6 dams, and continued until all progeny were on a pure C57BL/6 background. In this study, C57BL/6 +/+ female mice were paired with C57BL/6 SOD1G37R/+ male hemizygous carriers and the progeny from the breeding were ear punched for genotyping at Transnetyx, Inc (Cordova, TN, USA). Nontransgenic littermates were used as controls. Animals were weaned at 3 weeks of age and housed individually at Jack Bell Research Centre (Vancouver, BC, Canada) at a constant temperature of 21˚C - 22˚C and a 12-hour light/dark cycle. All procedures such as animal husbandry, treatment, and euthanasia were carried out in accordance with the regulations and guidelines of the Canadian Council on Animal Care and National Institute of Health and approved UBC Animal Care protocols. For analysis of disease progression in a toxic-induced nervous system, transgenic animals and non-transgenic littermates at 10 weeks of age were started on a daily diet containing 42 mg of steryl glucoside (SG) per kilogram of body weight. The 10-week starting point for SG feeding allowed time for sufficient baseline motor behavioral testing after weaning at 3 weeks. The 42 mg/kg body weight dose of SG corresponds approximately to those reported in Tabata et al. [21]. However, in the previous study, toxin exposure was set at a fixed concentration and began at 5 months of age. The weight adjustment in the current study was administered to ensure a consistent dosage corresponding to the size of the animal at specific ages, since animals in this study were followed up to 13 months of age. It is important to note that the pellet containing SG was only a part of the overall diet, with the other part consisting of regular mouse chow. In the comparative study, age-matched transgenic animals and wild type littermates not receiving SG but rather a placebo flour pellet were used. These control animals were maintained on a regular mouse chow diet of daily proportions equal in weight (and caloric value) to the diet containing toxin. Mice were considered at end stage of the disease when they were severely paralyzed and were unable to right themselves within 30 seconds when placed on their side.
2.2. Behavioral Assessment
Animals were observed daily for development of tremor, weakness, and loss of weight. At regular 3 week intervals, starting at 4 weeks of age when no signs of disease symptoms were present and up to 51 weeks of age, animals were monitored for onset of disease phenotype. Motor performance was monitored by Rotarod testing using an IITC Rotarod (IITC Life Science Inc., Woodland Hills, CA; #755). Mice were placed on a partitioned rotating rod 1.25 inch in diameter and tested at a constant speed of 30 RPM. Animals fell onto a platform that is sensed by magnetic switches and the time that the animal remains on the rod (up to a maximum of 180 seconds) is displayed and recorded. Rotarod testing was performed on the same day as grip endurance testing.
2.3. Immunocytochemistry and Cell Labeling
For immunocytochemistry and other cell labelling, we processed CNS tissue as we previously described [30]. Primary antibodies were goat polyclonal antibodies to ChAT (1:100; Millipore); rabbit polyclonal antibody to Iba1 (1:200; Wako Chemicals), mouse monoclonals to GFAP (1:100; Cell Signalling) and NF160 (1:200; Millipore); Alexa594-conjugated α-bungarotoxin (1:200, Invitrogen); anti-synaptic vesicle protein 2 (1:30, Developmental Hybridoma Bank).
2.4. Cell Counting and Statistics
We counted all motor neurons and measured gliosis intensities in every tenth transverse section of lumbar cord between L3 and L5. Soma diameters were measured by calculating the average length of two lines spanning the diameter of the cell and intersecting like crosshairs with the intersection point on the center of the nucleus. Data are presented as means ± standard error of the means (S.E.M.) as indicated. All results were analyzed to determine the effect of SG alone, G37R mutation alone, or the interaction between these two variables by ANOVA via Statistica 8.0 statistical software (StatSoft Inc., Tulsa, OK). Statistical significance between groups on rotarod performance was analyzed using repeated measures ANOVA via Statistica 8.0 statistical software (StatSoft Inc., Tulsa, OK) and graphed using Prism 5 (GraphPad Software Inc., San Diego, CA). Statistical significance between experimental and control groups for all other behavioral and histological assessments were calculated using a Student’s t-test. The t-test was used when only two groups and one condition were compared, as in the case of the quantitative histological data. Distributions of Nissl stained soma diameters and toluidine blue stained ventral roots were tested for normality using a one-sample Kolmogorov-Smirnov test, and differences between groups for sex and cell morphology were detected using one-way ANOVA. Following that, a post hoc test using multiple comparison Tukey HSD test was used to find out which groups were significantly different from controls. The analysis and graphs of distribution functions were computed by SPSS version 17.0 (New York, USA). Differences were considered statistically significant at p < 0.05. P values were expressed as exact values except in cases where p < 0.0001. A statistician reviewed the statistical content and methodology.
3. Results
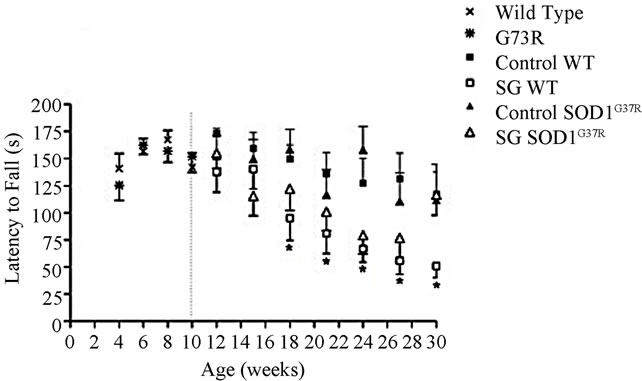
Motor coordination deficits on the rotarod began appearing in wild type mice with SG 2 weeks after beginning SG treatment in males (Figure 1(a)) and 8 weeks in females (Figure 1(b)). The effects reached statistical significance by 8 weeks of SG treatment in males (repeated measures ANOVA; p < 0.0001) and 18 weeks in females (repeated measures ANOVA; p = 0.008). While SG-fed female wild types showed a decline in latency to fall compared to controls, this effect started after 40 weeks of age and was not significant (F = 1.86, p = 0.17). Significant main effects of SG exposure on performance (F = 6.58, p = 0.01) were observed in male mice only before those arising from the genotype alone (F = 0.84, p = 0.36). In contrast, significant main effects of the G37R mutation were observed in female mice (Figure 1(b); F = 13.03, p = 0.0004). The performance on the rotarod of G37R transgenic mice was almost identical to wild type littermates for both sexes during the baseline testing period between 4 to 10 weeks of age before commencement of SG treatment (Figure 1). The combined impact of the toxin on the mutant mice was highly significant (F =
 (a)
(a) (b)
(b)
Figure 1. Chronic SG exposure in wild type male and female mice provokes a progressive deficit in rotarod performance at 30 rpm. (a) SG-fed males showed significant performance deficits by 18 weeks of age compared with controls (p < 0.0001) and a significant genotype × diet interaction (p < 0.005); (b) SG-fed females showed significant performance deficits by 50 weeks of age (p < 0.05) compared with controls, and a significant effect of the G37R genotype was evident (p < 0.0001). Data are reported up to 30 weeks of age for male mice and 51 weeks for females. Note that the maximum time was 180 seconds; weeks 4 to 10 represent baseline performances before SG feeding in all animals. Data are expressed as mean ± S.D. *Significant motor coordination deficits in SG-fed wild types compared to wild type controls.
645.81, p < 0.0001). Similar to the male counterparts, an interaction between SG and SOD1G37R genotype was also observed in females (F = 1699.02, p < 0.0001). Wild type mice without SG (controls) showed a similar level of rotarod performance throughout the study, as demonstrated by a minimal change in performance with increasing age.
3.1. Mutant SOD1 Motor Neurons Show Morphometric Alterations
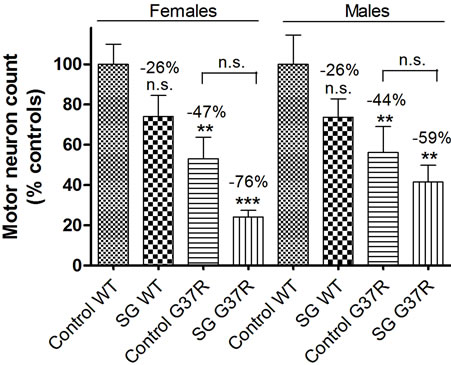
No significant differences in ChAT-positive cell counts were found in SG-fed wild types (p = 0.12 for males, p = 0.09 for females), although the cell count was noticeably lower in this group for both sexes (26% decrease compared to controls; Figure 2). In wild ty pe controls, motor neurons are widely distributed in the left and right ventral lumbar horn (Figure 2(a)) and have a distinct nucleus identified with Hoechst staining (Figure 2(b)). In SG-fed wild types, motor neuron loss is noticeable from the most ventral portion of the left and right lumbar horns (Figure 2(c)) and surviving motor neurons also have a distinct nucleus identified with Hoechst staining (Figure 2(d)), although overall cell loss was not significant in this group for either sex. The number of ChATpositive neurons is significantly reduced in control-fed (Figures 2(e) and (f)) and SG-fed (Figures 2(g) and (h)) transgenic mice compared with WT controls. Motor neurons in control lumbar cords showed healthy motor neuron morphology and ChAT expression (Figure 2(i)) while ChAT expression in “ghost cell” (Figure 2(j)) and shrunken pyknotic (k) motor neurons were observed mostly in transgenic mouse lumbar cords. One-way ANOVA showed no significant main effects of the SG diet in males (F = 2.7, DF = 34, p = 0.16) or in females
 (l)
(l)
Figure 2. Micrographs of ChAT immunostaining in lumbar spinal sections of control and G37R transgenic mice. ChATpositive cell distribution and number in the lumbar cord of control-fed wild type (a, b) and SG-fed wild type (c, d) mice. ChAT-positive distribution and number in the lumbar cord of control-fed G37R (e, f) and SG-fed G37R (g, h) mice. Data on graph (l) presented as ratio of motor neuron numbers compared to wild type controls ± SD. When data from both sexes were combined, a significant main effect was observed for both diet and genotype. Scale bars are 300 μm in a, c, e, and g; 100 μm in b, d, f, and h; and 30 μm in i, j, and k.
(F = 1.7, DF = 40, p = 0.15). In comparison with wild type controls, significant decreases in ChAT-positive cell count were found in G37R mice (p = 0.019 for males, p = 0.0017 for females). Significant main effects were observed for genotype in both males (F = 1.2, DF = 34, p = 0.002) and females (F = 1.04, DF = 40, p = 0.0002). For SG-fed G37R mice the decrease in ChAT-positive cells was more pronounced (p = 0.0034 for males, p = 0.0008 for females). Analysis of gene × diet interaction showed no significance in males (F = 0.27, DF = 34, p = 0.61) and females (F = 0.01, DF = 1, p = 0.91). However, when all the animals from both sexes were combined, significant main effects of both diet (p = 0.007) and genotype (p < 0.0001) were found. In contrast, no significant diet × genotype interaction was observed (p = 0.66). The appearances and numbers of motor neurons were not significantly different between the left and right ventral horns (data not shown).
All groups exhibited morphologically abnormal neurons that appeared to be undergoing degeneration among a larger population of healthy cells (Figure 3). Neuron density in the ventral horn of the transgenic mouse (Figures 3(e) and (g)) was reduced compared with the control (Figure 3(a)). Morphologically abnormal cells are clearly evident at higher magnification, and shrunken (Figure 3(d)), chromatolytic (Figure 3(f)), and ghost cell appearances (Figure 3(h)) are observed alongside apparently healthy cells (Figure 3(b)), although not limited to these corresponding experimental groups. The graph of motor neuron number showed a normal distribution of Nissl stained neuronal diameters (Kolmogorov-Smirnov test; p > 0.01). The reduced proportion of large diameter motor neurons lumbar ventral horn of G37R and/or SGfed groups and the consequent significant reduction in cell diameter range are further illustrated in the cumulative distribution functions (Figure 4). A significant leftward shift of the cumulative distribution function in
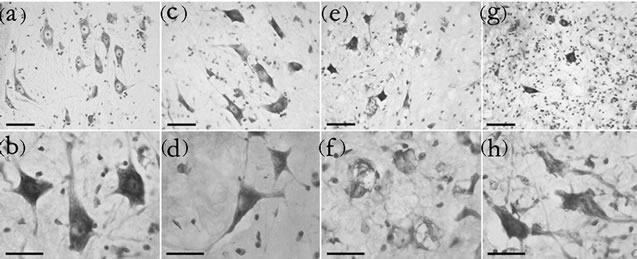
Figure 3. Morphological changes in motor neurons in the ventral horn. Nissl-stained sections from the ventrolateral horn of the lumbar cord enlargement of control-fed wild type (a), SG-fed wild type (c), control-fed G37R (e) and SG-fed G37R (g) mice. (b-h) are representative higher power micrographs of the ventral horn in the corresponding group of the upper panels. Scale bars = 60 μm in upper panels, 30 μm in lower panels.
SG-fed wild type (Tukey HSD post hoc test; p < 0.001), control-fed G37R (Tukey HSD post hoc test; p = 0.001), and SG-fed G37R (Tukey HSD post hoc test; p < 0.001) female mice indicates a decline in soma diameters of neurons with an apparently normal morphology (Figure 4(a)). Chromatolytic neurons also showed significant leftward shifts in the cumulative distribution in both the SG-fed groups (Tukey HSD post hoc test; p < 0.001, wild type SG; p = 0.01, G37R SG), while a leftward shift of the G37R groups was not significant (Tukey HSD post hoc test; p = 0.328; Figure 4(b)). No significant shifts were observed in the diameter of pyknotic neurons between groups (Figure 4(c)). Data for significant leftward shift revealed similar results in male mice, with the exception of two differences. Significant leftward shifts in the cumulative distribution of healthy neurons were greater between male groups (Figure 4(d)) than females, and chromatolytic neurons only showed leftward shifts in the cumulative distribution of in SG-fed G37R mice (Figure 4(e)) compared to controls. In summary, SG-fed mice showed significant leftward shifts in healthy neurons for males (p < 0.05) and for chromatolytic neurons in females (p < 0.05) compared to non SG-fed wild type mice. Mutant mice showed significant leftward shifts towards smaller apparently normal neuronal diameters (males p < 0.0001; females p < 0.001) compared to wild type mice. The combination of SG with the mSOD mutation gave significantly smaller cell diameters for both healthy and chromatolytic neurons (males p < 0.05; females p < 0.05). Table 1 summarizes multiple comparisons of cumulative frequency histograms between groups, broken down by sex and cell morphology.
3.2. Glia from MSOD Mice Exhibit Non-Synchronous Changes to an Activated Morphology
Astrocyte gliosis was determined by quantifying the immunohistochemical labeling intensity of green fluorescent GFAP positive cells in the ventral horn of the lumbar spinal cord in conjunction with blue Hoechst staining (Figure 5). Astrocyte distribution was sparse in the lumbar cord of wild type controls (Figure 5(a)) and SG-fed wild type mice (Figure 5(d)). In wild type animals, astroglia were clustered in the left and right ventrolateral lumbar horn (Figures 5(b) and (e)). Astrocytes were observed in their resting morphology with long, thin processes and a small cell body (Figures 5(c) and (f)). Treatment with SG in wild type mice showed a significant trend for increased GFAP labeling in both males (student’s ttest; p < 0.0001; Figure 5(o)) and females (student’s ttest; p = 0.037; Figure 5(o)). G37R lumbar cords showed a marked increase in astrocyte gliosis for both sexes (student’s t-test; p << 0.0001) with uniform proliferation
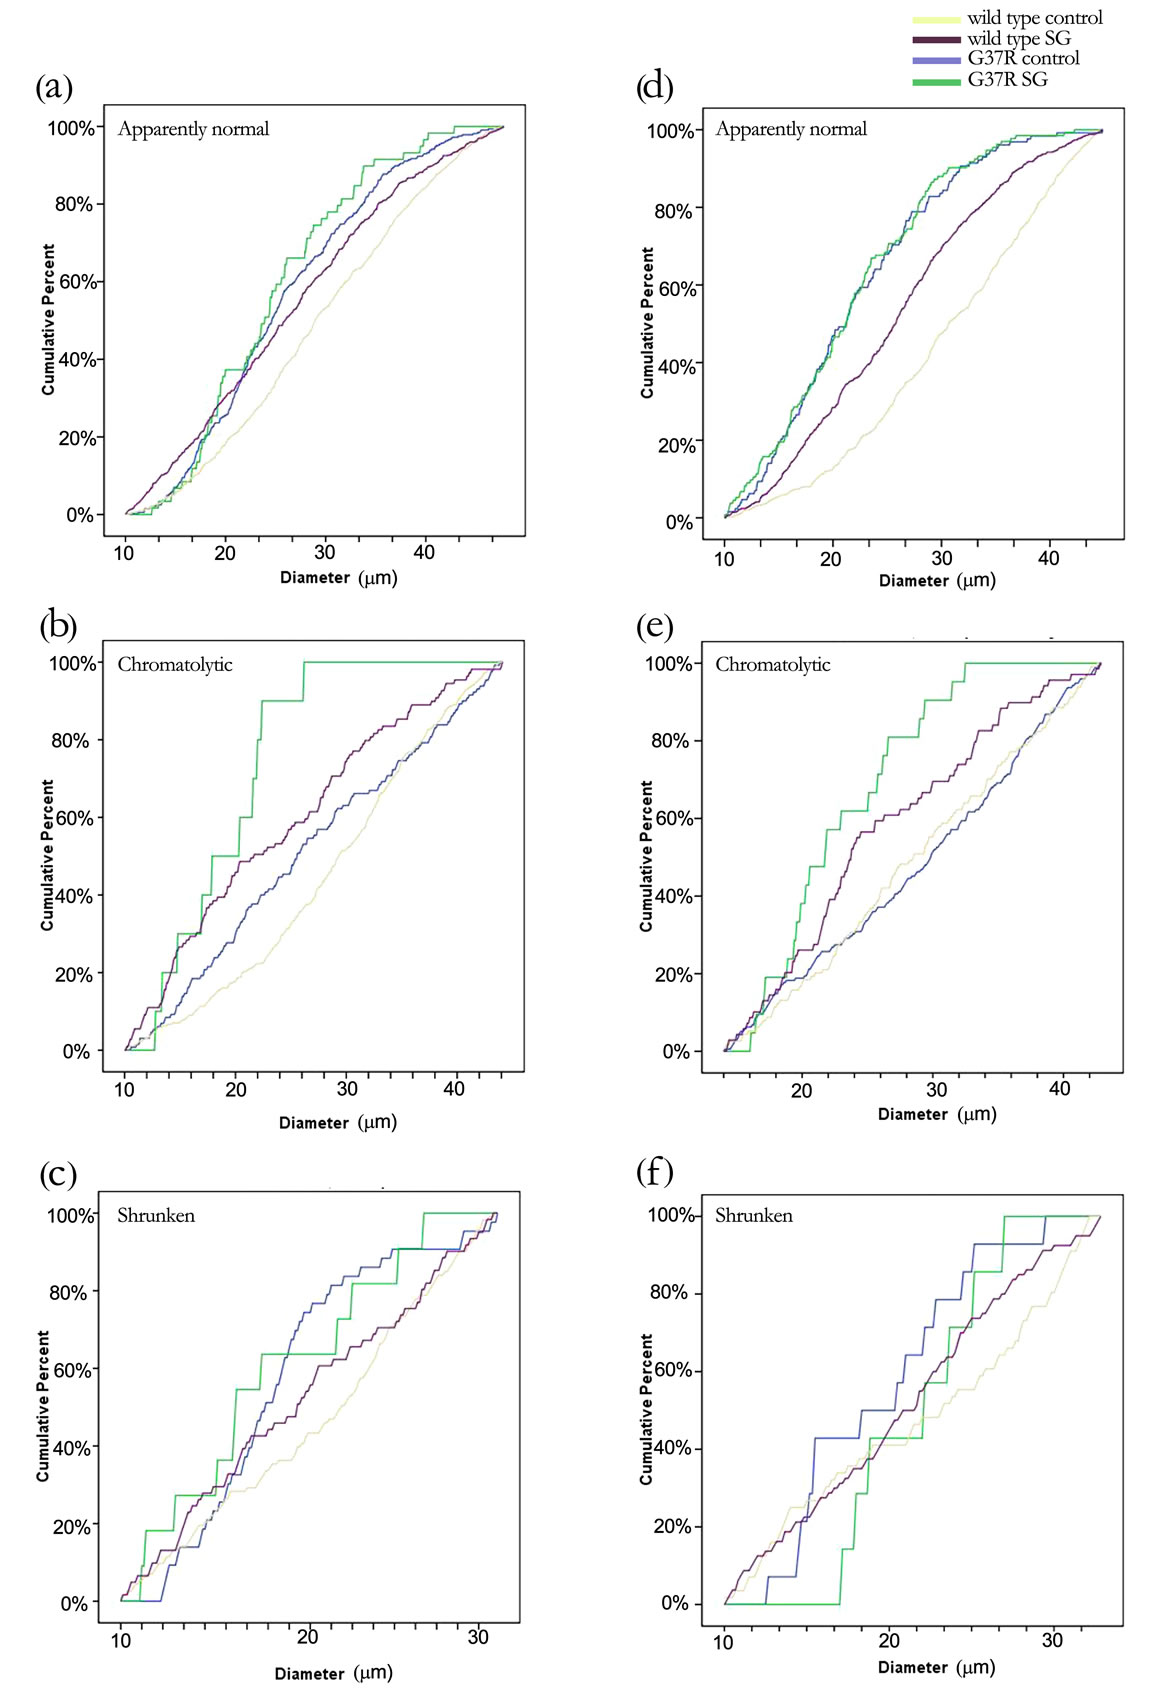
Figure 4. Changes in cell diameters of different cell morphologies between groups are illustrated by a cumulative distribution function. Data are broken down further into female (a-c) and male (d-f) mice. Motor neurons with pyknotic soma did not show any changes in cell size across groups.
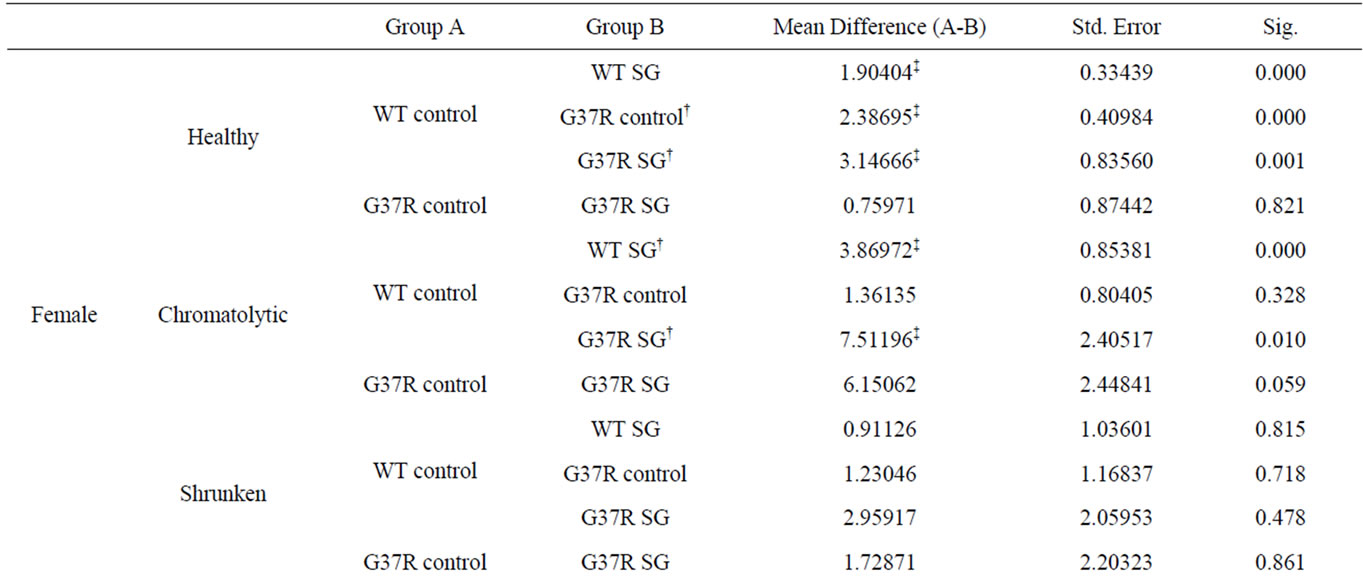
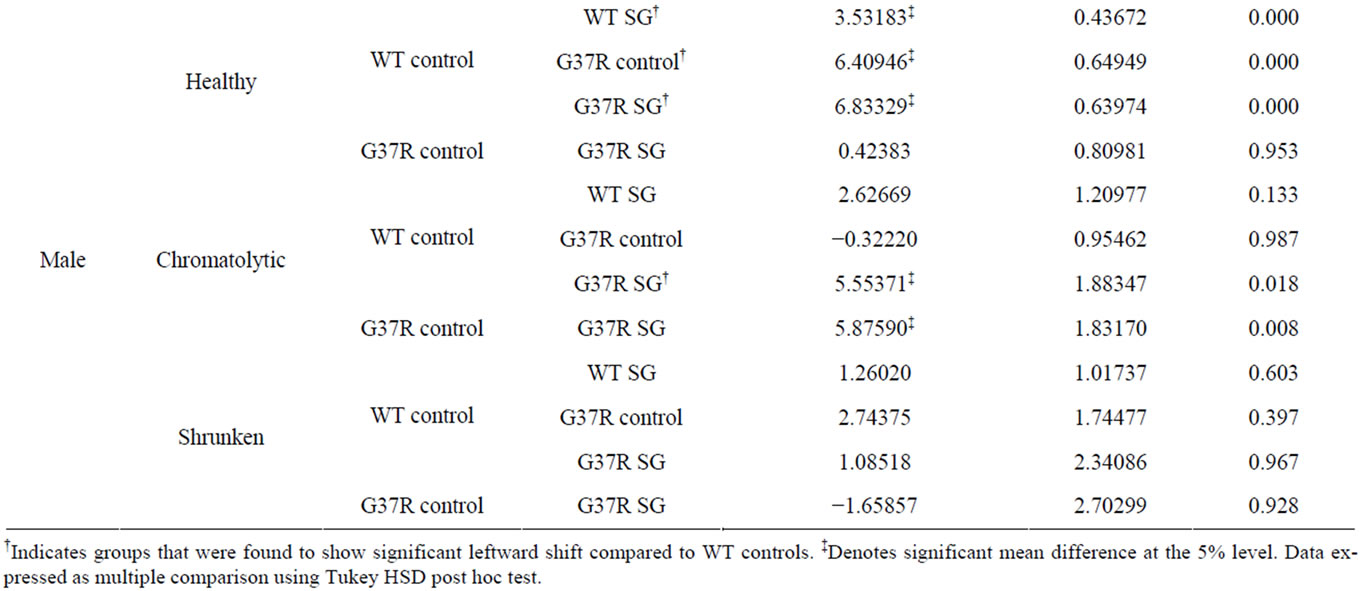
Table 1. Significant differences in cumulative frequency of cell diameter.
throughout the entire grey matter (Figures 5(g) and (l)). Furthermore, control-fed G37R mouse cord showed astrocytes that were exclusively in the activated state with enlarged cell bodies and thickened, retracted processes (Figures 5(j) and (k)) or astrocytes that exclusively showed increased branching of long thin processes (Figures 5(h) and (i)). Treatment with SG in G37R animals did not increase astrocyte proliferation further in males (student’s t-test; p = 0.48), but significantly decreased GFAP label intensity in females (student’s t-test; p = 0.017, compare Figures 5(h)-(j) with m). All GFAPpositive cells in this group were astrocytes with an activated morphology (Figures 5(m) and (n)).
Significant main effects of genotype on increased GFAP green fluorescence intensity was observed in males (one-way ANOVA; F = 3.69, DF = 222, p << 0.0001) and females (one-way ANOVA; F = 2.49, DF = 221, p << 0.0001). Interaction between diet and genotype was significant for both males (one-way ANOVA; p = 0.007) and females (one-way ANOVA; p = 0.001). In summary, SG-fed mice showed significant increases in GFAP label intensity in the lumbar cord grey matter (males p < 0.0001; females p < 0.05) compared to non SG-fed wild type mice with astrocytes in the resting state. Mutant mice showed even greater significant GFAP infiltration (males p < 0.0001; females p < 0.0001) compared to wild type mice with astrocytes either exclusively in an altered resting morphology or an active morphology. The combination of SG with the mSOD mutation did not change astrocyte numbers, but induced active astrocyte morphology in all animals.
Microglial proliferation was described by quantifying
 (o)
(o)
Figure 5. Micrographs of green fluorescent GFAP immunostaining in lumbar spinal sections of control and G37R transgenic mice. (a, d, g, l) illustrate GFAP-positive cell distribution in the lumbar cord of control-fed wild type (a) SG-fed wild type (c), control-fed G37R (g) and SG-fed G37R (l) mice. (b, e, h, m) illustrates GFAP-positive number in the corresponding groups. (c, f, i, n) illustrate representative cell morphologies at high magnification in the corresponding groups. Data on graph (o) presented as percent of green fluorescent GFAP labeling compared to wild type controls ± S.E.M. Scale bars are 300 μm in (a, d, h, l), 60 μm in (b, e, h, m), and 30 μm in (c, f, I n).
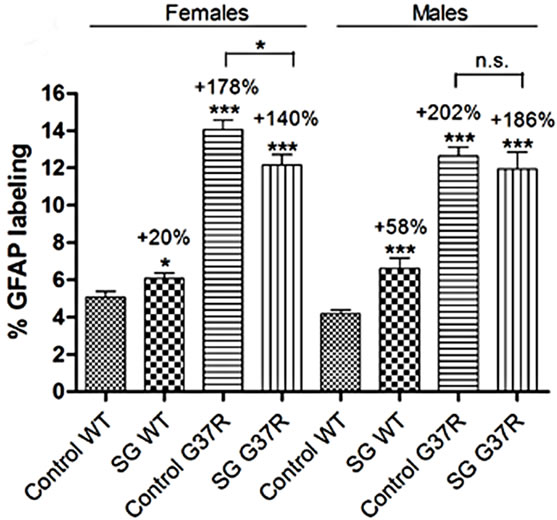
the immunohistochemical labeling intensity of red fluorescent Iba1 positive cells in the ventral horn of the lumbar cord in conjunction with blue Hoechst staining (Figure 6). Microglial distribution was minimal and uniform in control-fed (Figures 6(a) and (b)) and SG-fed (Figures 6(d) and (e)) wild type lumbar cord. In both these groups, Iba1 positive cells were observed as ramified microglia with a small round cell body (Figures 6(c) and (f)) and differences in microglial label intensity were comparable in both males (student’s t-test; p = 0.35) and females (student’s t-test; p = 0.051; Figure 6(m)). Control-fed G37R lumbar cords showed a marked increase in microgliosis for both sexes (student’s t-test; p << 0.0001). Iba1-positive cells in this group were observed to have both enlarged “amoeboid-like” cell bodies with retracted processes (Figure 6(h)) and cells in a with remaining processes that have not yet retracted (Figure 6(i), arrow) in the same spinal cord. The latter proportion of microglia appeared to be in transition between a quiescent ramified resting state and an activated state. Treatment of SG in G37R animals did not increase astrocyte proliferation further in females (student’s t-test; p = 0.28, compare Figures 6(h) and (k)), but significantly increased Iba1 label intensity in males (student’s t-test; p = 0.006; Figures 6(l) and (m)). Virtually all Iba1-positive cells in this group assumed an activated morphology with retracted processes and large cell body (Figures 6(k) and (l)).
Significant main effects of genotype on increased Iba1 red fluorescence intensity was observed in males (oneway ANOVA; F = 3.4, DF = 220, p << 0.0001) and females (one-way ANOVA; F = 2.75, DF = 220, p << 0.0001). Interaction between diet and genotype was significant for both males (one-way ANOVA; p = 0.008) and females (one-way ANOVA; p = 0.002). In summary, SG-fed mice no changes in Iba1 label intensity in the lumbar cord grey matter (males p = 0.35; females p = 0.51) compared to non SG-fed wild type mice with microglia in the resting state. Mutant mice showed significant microglial infiltration (males p << 0.0001; females p << 0.0001) compared to wild type mice with microglia in a transition state between resting and active morphology, but most with an active morphology. The combination of SG with the mSOD mutation did not change microglia numbers in females (p = 0.28), but significantly increased microgliosis in males (p = 0.051) while active astrocyte morphology was observed in all animals.
3.3. SG Toxicity Does Not Contribute to Motor Axonopathy Caused by Mutant SOD1
Evaluations of muscle end plates with rhodamine conjugated α-bungarotoxin immunofluorescence showed significant abnormalities in all G37R groups of both sexes
 (m)
(m)
Figure 6. Micrographs of red fluorescent Iba1 immunostaining in lumbar spinal sections of control and G37R transgenic mice. (a, d, g, j) illustrate uniform Iba1-positive cell distribution in the lumbar cord grey matter of control-fed wild type (a) SG-fed wild type (c), control-fed G37R (g) and SG-fed G37R (j) mice. (b, e, h, k) illustrate Iba1-positive cell numbers in the corresponding groups. (c, f, i, l) illustrate representative cell morphologies at high magnification in the corresponding groups. Data on graph (m) presented as percent of red fluorescent Iba1 labeling compared to wild type controls ± S.E.M. Scale bars are 300 μm in (a, d, g, j), 60 μm in (b, e, h, k), and 30 μm in (c, f, i, l).
(Figure 7). Virtually all endplates (>90%) were innervated in wild type mice of both sexes, showing clear overlap between red and green fluorescent labeling (Figures 7(a) and (b)). Prolonged exposure to SG in wild type mice did not significantly change neuromuscular junction innervation in either sex (p = 0.75 in males; p = 0.066 for females), as reported previously [30]. G37R mice showed significant end plate denervation visualized by empty motor end plates compared with wild types, with 65% denervation in males (p = 0.0005) and 82% denervation in females (p < 0.0001; Figures 7(d) and (g)). Following treatment with SG in G37R mice, levels of denervation did not change significantly (83% in males, p < 0.0001; 64% in females, p = 0.0005). The levels of denervation between non-SG-fed and SG-fed G37R mice were not significant (p = 0.36 for females; p = 0.12 for males).
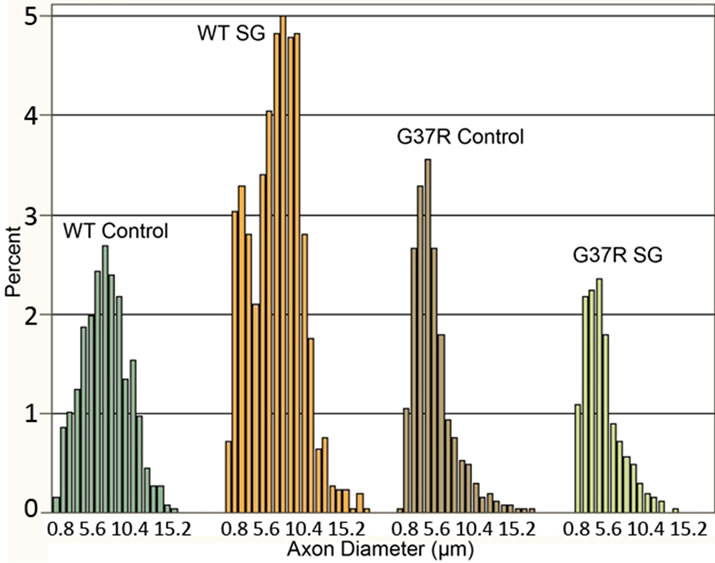
The axon diameter distribution histogram showed a normal distribution of toluidine blue stained motor axon diameters for the controls (Kolmogorov-Smirnov test, p > 0.01) while distribution of axonal diameters for other groups did not show a normal distribution (Kolmogorov-Smirnov test, p < 0.01). The frequency distributions of axon diameters were different between wild type and G37R mice (Figure 8(a)). In controls, motor axons have a wide distribution of axon diameters, with the greatest number of axons having a diameter between 6 and 9 μm. SG-fed wild type mice showed a comparable wide distribution of axon diameters, with the greatest number of axons having a diameter between 6 and 10 mm. The mean axon diameter was 6.4 μm for both wild type groups, with SG-fed wild types showing a greater number of small diameter axons. The mean axon diameter was 4.4 and 4.6 μm for SGand control-fed G37R groups, respectively. SG-fed wild types also showed a greater number of motor axons <10 μm in diameter than
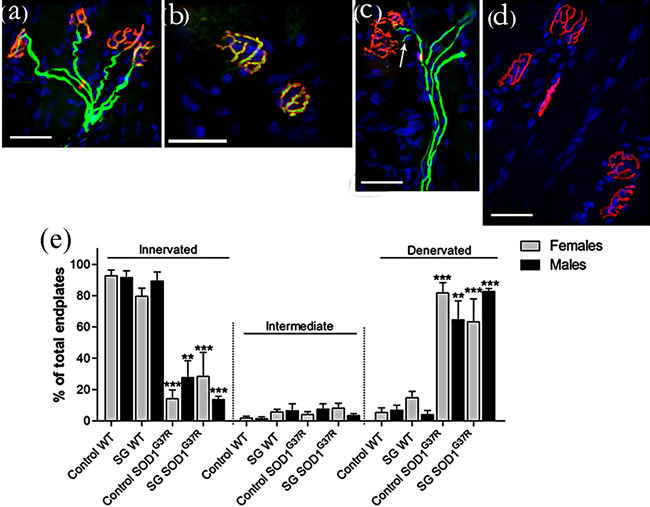
Figure 7. Motor end plates were identified with rhodamine-conjugated α-bungarotoxin (red) and axons were identified with neurofilament and SV2 (green). Intermediate filaments represented >10% of wild type control mice and approximately 10% of the other groups, showing an axon in the vicinity of a motor end plate but with no overlap (c). Graph in (e) expressed as mean ± S.D. Scale bar 40 μm. (**p < 0.001; ***p < 0.0001).
 (a)
(a)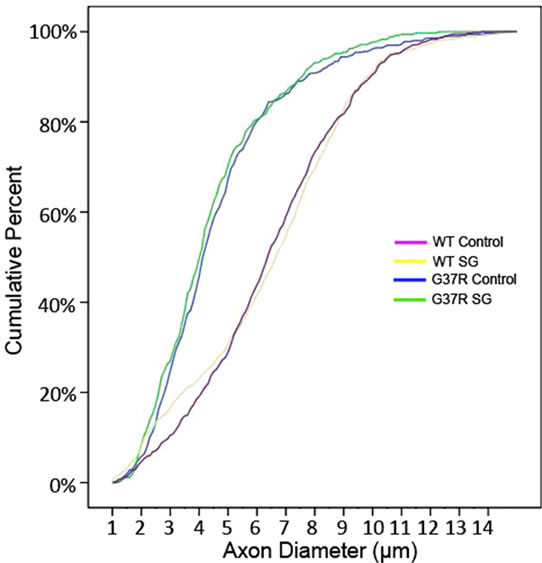 (b)
(b)
Figure 8. Distribution of motor axon diameters. The steeper initial slope of the histogram corresponding to both G37R groups shows greater numbers of motor axons belonging to the smallest diameter range.
the controls. Motor axons from SG-fed wild types did not show any changes in diameter compared to wild type controls. Both G37R groups showed a similar wide distribution range, although skewed toward smaller axon diameters compared to wild types.
The reduced proportion of large diameter motor axons in the lumbar ventral root of both G37R groups and the consequent significant reduction in axon diameter range are further illustrated in the cumulative distribution functions (Figure 8(b)). A significant leftward shift of the cumulative distribution function in SG-fed G37R (p < 0.05), control-fed G37R (p < 0.05) indicates a decline in axon caliber in these groups. No significant shifts of the cumulative frequency histogram were observed in SGfed wild types compared to controls (p > 0.05). In addition to a leftward shift in the normal distribution for G37R groups, a steeper slope for the smallest diameters was observed for these groups. This observation is consistent with the frequency distribution histogram that shows greater numbers of axons in the smaller diameter ranges.
The current results provide some of the first evidence in relation to ALS that a gene-toxin interaction may be part of interlocking etiologies for the disease. In the present case, a toxin was imposed on top of a genetic mutation that already can induce a profound ALS phenotype. In spite of this, toxin exposure exacerbated the mutant gene toxic gain of function impact by adding to and accelerating the series of events leading to motor neuron death. Given that over 90% of all ALS cases are sporadic, it may be reasonable to postulate that the opposite also occurs, namely that primarily toxin etiologies act upon genetic susceptibility factors to induce the disease state. In this view, sporadic cases might arise in some fraction f the population containing such susceptibility genes in context to a relatively ubiquitous toxic burden.
The present data suggest that a determined search for such susceptibility genes might be of great benefit for pre clinical screening of potential ALS patients.
4. Discussion
The results of the present study demonstrate the contribution of an identified neurotoxin linked to some forms of ALS to the progression of motor deficits and neurodegenerative processes of a mouse model of ALS. Chronic dietary administration of this toxic SG also induced significant reductions in motor function during behavioral tests as reported in previous studies [21,30]. These studies showed that motor coordination and grip endurance were impaired from 8 weeks of chronic SG exposure in males and from 18 and 38 weeks, respectively, in females. In addition, hindlimb extension showed deficits by 12 weeks of SG feeding in males, and 26 weeks in females. There was a non-significant trend towards motor neuron loss and increased gliosis in the lumbar ventral horn at disease end-stage, and there was significant gene × diet interaction effect on gliosis. At disease end stage, when degenerative changes in motor neurons and cell death are well underway, marked synaptic loss in motor endplates and reduction in axon caliber occur in mutant mice. Chronic treatment with SG had no effect on furthering these degenerative changes in peripheral motor components in G37R mice. Although in vitro studies have shown that synthetic cycad steryls act directly on neural cells [18,20], SG appears to be primarily involved in inflammatory reactions and motor neuron pathology in the spinal cord. The fact that SG-mediated neuropathology was only noted in the spinal cord where neuronal cell death mainly occurs indicates that it could contribute to cell dysfunction leading to neurodegeneration in SOD1 mutant mice. Thus, our data suggest that environmental toxins initiate neural pathogenesis by triggering inflammation-mediated neurodegeneration with an additive effect on the processes triggered by mutant SOD1.
Our results are in agreement with our earlier behavioral [21,23] and histological [24,34] studies on the effects of chronic cycad exposure on motor impairments in mice. Data have also been reported for synthetic cycad toxins, where significant motor dysfunction is evident following 30 weeks of chronic treatment, and the onset of motor neuron death was observed from 15 weeks [21]. We have previously reported some parallels between the time of appearance of these pathologies and the progression of motor deficits in cycad-fed male mice [30]. Here, our results demonstrate declines in rotarod performance in G37R male mice by 30 weeks of age, the maximum age at which behavioral results are available for these mice, corresponding to 15 weeks of age with SG exposure. Earlier reports have shown late (40 - 50 weeks of age) declines in rotarod performance of G37R mice [35,36]. In contrast, preferential motor unit loss from fast-twitch muscles [4,37] and the initiation of the denervation process of motor endplates [2] start earlier, before the onset of disease symptoms in G93A mice. Considering that SOD1 mice present marked deficits in the compensatory sprouting capacity of their motor neurons [38], it is likely that these deficits lead to the presentation of locomotor dysfunction.
The results of this study showed significant leftward shifts in the cumulative histogram of soma diameter distribution in non-SG-fed and SG-fed G37R cords of both sexes. Studies in G93A mice reported preferential loss of the most forceful motor units paralleled by denervation of large type IIB (fast-fatigable) muscle fibers and indicate conversion to motor units innervated by smaller motor axons during the presymptomatic stage [38]. Observations of a significant reduction in motor neuron diameter at disease end stage in this study support the possibility of activity-dependent conversion to smaller motor axons innervating type IIA (fatigue resistant) muscle fibers.
Prolonged dietary exposure to SG elicited a significant astrocytic response in the ventral lumbar horn of both sexes that was more pronounced in males than females (58% increase in males compared to 20% in females). This finding is consistent with previous studies of toxin administration to male mice [23,30], and provides novel data for glial responses in females. G37R expression elicited a prominent microglial and astroglial response, some of which showed morphological changes reminiscent of activation. Prominent hypertrophic astrocytes and irregular amoeboid shaped microglia are predominantly located in the anterior horn of symptomatic G37R mice [39,40]. Enhanced gliosis as measured by increased microglial cell numbers and GFAP staining intensity was observed in other studies of this line of symptomatic G37R mouse [41]. Prolonged SG exposure in G37R mice showed similar widespread distribution of microglia and astrocytes, all of which became hypertrophic with retracted processes. This is a novel finding demonstrating that SG targets the type of glia (resting or activated) even in the absence significant increases in gliosis, as in the case of the microglial response. Although the effects of SG on eliciting a glial response are small compared to the genetic effects, significant diet × genotype interactions were observed in both sexes. The effects of SG alone on increasing glial infiltration and motor neuron loss do not reach significance, although there appears to be increased gliosis and cell loss in SG-fed mice. Hence the overall effect of SG is not greater in combination with SOD mutation because the effect of interest is saturated by the mutation alone. Another likely explanation is the high variability of data between animals in the SGtreated groups.
Synaptic loss at motor end plates of the gastrocnemius muscle of mutant SOD1 mice was consistent with the remarkable decline in motor function and paralysis of the hind limbs. Numerous other studies show early vulnerability of fast-type neuromuscular synapses and functional motor unit losses [3] in SOD1 ALS models. Atkin and colleagues reported no detectable muscle pathology in presymptomatic SOD1 G93A mice and selective denervation of a subset of fast twitch muscle fibers at disease end stage [42]. Other studies detected skeletal muscle denervation in SOD1 G93A mice as early as 47 days [2,43], and still other studies reported denervation occurring later at 10 weeks [43]. The diagnosis of neuromuscular junction pathology is not limited to denervation, and may include other individual features such as neurofilament accumulation, pathological involvement of terminal Schwann cells and/or their neighboring neuromuscular junction capping cells, or pathology of the postsynaptic components of the neuromuscular junction that includes motor end plates. Hence an important question is what features should be considered as essential or relevant aspects of synaptic pathology.
Another major finding demonstrated here is a significant reduction in motor axon caliber in G37R mice that is unaffected by chronic SG dietary administration. The numbers of large caliber axons is significantly lower in G37R ventral roots compared with wild types, while the number of small caliber axons is increased. This finding is consistent with increased numbers of small axon fibers and greater frequency of axonal degeneration in the ventral spinal root of ALS patients [44]. Other studies in the same line of G37R mice reported significant reductions in axonal proteins before disease onset and massive axonal loss in L5 ventral roots at disease end stage [40,41, 45]. Large myelinated fibers undergo atrophy, while myelin sheaths increase in thickness and show various irregularities [46]. The degree of demyelination (or abnormalities in myelination) has not been described in this G37R mouse line, but it is possible that mutant SOD1 triggers an advanced aging process on the large fibers of spinal motor neurons. A marked increase in small caliber axons at disease end stage may indicate new growth rather than persistent axons, occurring in the form of thin branches that emanate primarily from axons as opposed to terminal sprouts. Motor neurons innervating type I and type IIA muscle fibers retain sprouting competence compared to the loss of sprouting competence in motor neurons innervating the fast-type-fatigable type IIB fibers [3,4]. However, in the present study it was impossible to distinguish between thin axons that are refractory to degeneration from new (reinnervating) thin axons that are compensatory. Alternatively, the identity of these small caliber axons may be gamma efferent fibers, which innervate the intrafusal muscle fibers.
5. Acknowledgements
We wish to thank Drs. A. Eisen, I. Mackenzie, and C. Seow for their valuable comments and advice. We are grateful to Dr. N. Cashman for the SOD1G37R breeders and Dr. H. Stewart for advice with animal breeding and husbandry. The authors wish to thank D. Sommerfeld and B. Hilton for help with behavioural monitoring and data collecting. Special thanks to A. Kam for his support and encouragement. We acknowledge financial support from the National Institutes of Health (NIH5R01N6SO51723), ALS Association, Canadian Institutes of Health Research, and Scottish Rite Charitable Foundation of Canada (G.L.).
REFERENCES
- D. R. Rosen, T. Siddique, D. Patterson, D. A. Figlewicz, P. Sapp, A. Hentati, et al., “Mutations in Cu/Zn Superoxide-Dismutase Gene are Associated with Familial Amyotrophic-Lateral-Sclerosis,” Nature, Vol. 362, No. 6415, 1993, pp. 59-62. doi:10.1038/362059a0
- L. R. Fischer, D. G. Culver, P. Tennant, A. A. Davis, M. Wang, A. Castellano-Sanchez, et al., “Amyotrophic Lateral Sclerosis is a Distal Axonopathy: Evidence in Mice and Man,” Experimental Neurology, Vol. 185, No. 2, 2004, pp. 232-240. doi:10.1016/j.expneurol.2003.10.004
- D. Frey, C. Schneider, L. Xu, J. Borg, W. Spooren and P. Caroni, “Early and Selective Loss of Neuromuscular Synapse Subtypes with Low Sprouting Competence in Motoneuron Diseases,” The Journal of Neuroscience, Vol. 20, No. 7, 2000, pp. 2534-2542.
- S. Pun, A. F. Santos, S. Saxena, L. Xu and P. Caroni, “Selective Vulnerability and Pruning of Phasic Motoneuron Axons in Motoneuron Disease Alleviated by CNTF,” Nature Neuroscience, Vol. 9, No. 3, 2006, pp. 408-419. doi:10.1038/nn1653
- P. N. Leigh, “Amyotrophic lateral sclerosis,” In: A. Eisen and P. J. Shaw, Eds., Handbook of Clinical Neurology, Elsevier, Amsterdam, 2007, pp. 249-278.
- C. E. Shaw, V. Arechavala-Gomeza and A. Al-Chalabi, “Familial Amyotrophic Lateral Sclerosis,” In: A. Eisen and P. J. Shaw, Eds., Handbook of Clinical Neurology, Elsevier, Amsterdam, 2007, pp. 279-300.
- L. K. Kwong, M. Neumann, D. M. Sampathu, V. M. -. Lee and J. Q. Trojanowski, “TDP-43 Proteinopathy: The Neuropathology Underlying Major Forms of Sporadic and Familial Frontotemporal Lobar Degeneration and Motor Neuron Disease,” Acta Neuropathologica, Vol. 114, No. 1, 2007, pp. 63-70. doi:10.1007/s00401-007-0226-5
- I. R. A. Mackenzie, E. H. Bigio, P. G. Ince, F. Geser, M. Neumann, N. J. Cairns, et al., “Pathological TDP-43 Distinguishes Sporadic Amyotrophic Lateral Sclerosis from Amyotrophic Lateral Sclerosis with SOD1 Mutations,” Annals of Neurology, Vol. 61, No. 5, 2007, pp. 427-434. doi:10.1002/ana.21147
- J. Robertson, T. Sanelli, S. Xiao, W. Yang, P. Horne, R. Hammond, et al., “Lack of TDP-43 Abnormalities in Mutant SOD1 Transgenic Mice shows Disparity with ALS,” Neuroscience Letters, Vol. 420, No. 2, 2007, pp. 128-132. doi:10.1016/j.neulet.2007.03.066
- C. A. Shaw and G. U. Hoglinger, “Neurodegenerative Diseases: Neurotoxins as Sufficient Etiologic Agents?” NeuroMolecular Medicine, Vol. 10, No. 1, 2008, pp. 1-9. doi:10.1007/s12017-007-8016-8
- D. R. Koerner, “Amyotrophic Lateral Sclerosis on Guam: A Clinical Study and Review of the Literature,” Annals of Internal Medicine, Vol. 37, No. 6, 1952, pp. 1204.
- L. T. Kurland and D. W. Mulder, “Epidemiologic Investigations of Amyotrophic Lateral Sclerosis. 1. Preliminary Report on Geographic Distribution, with Special Reference to the Mariana Islands, Including Clinical and Paologic Observations,” Neurology, Vol. 4, No. 5, 1954, pp. 355-378. doi:10.1212/WNL.4.5.355
- D. W. Mulder and L. T. Kurland, “Amyotropnic Lateral Sclerosis in Micronesia,” Mayo Clinic Proceedings, Vol. 29, No. 26, 1954, pp. 666-670.
- J. A. Brody, J. M. Stanhope and L. T. Kurland, “Patterns of Amyotrophic Lateral Sclerosis and Parkinsonism-Dementia on Guam,” Contemporary Neurology Series, Vol. 12, 1975, pp. 45-70.
- J. M. Stanhope, J. A. Brody and C. E. Morris, “Epidemiologic Features of Amyotropic Lateral Sclerosis and Parkinsonism-Dementia in Guam, Mariana Islands,” International Journal of Epidemiology, Vol. 1, No. 3, 1972, pp. 199-210. doi:10.1093/ije/1.3.199
- A. Hirano, N. Malamud, T. S. Elizan and L. T. Kurland, “Amyotrophic Lateral Sclerosis and Parkinsonism-Dementia Complex on Guam: Further Pathologic Studies,” Archives of Neurology, Vol. 15, No. 1, 1966, p. 35. doi:10.1001/archneur.1966.00470130039004
- M. G. Whiting, “Toxicity of Cycads,” Economic Botany, Vol. 17, No. 4, 1963, pp. 270-302. doi:10.1007/BF02860136
- I. Khabazian, J. S. Bains, D. E. Williams, J. Cheung, J. M. Wilson, B. A. Pasqualotto, et al., “Isolation of various Forms of Sterol Beta-D-Glucoside from the Seed of Cycas Circinalis: Neurotoxicity and Implications for ALSParkinsonism Dementia Complex,” Journal of Neurochemistry, Vol. 82, No. 3, 2002, pp. 516-528. doi:10.1046/j.1471-4159.2002.00976.x
- C. A. Shaw, J. M. B. Wilson, R. Cruz-Aguado, S. Singh, E. L. Hawkes, V. Lee, et al., “Cycad-Induced Neurodegeneration in a Mouse Model of ALS-PDC: Is the Culprit Really BMAA or Is a Novel Toxin to Blame,” Botanical Review, Vol. 33, No. 9, 2006, pp. 857-862.
- P. T. T. Ly, S. Singh and C. A. Shaw, “Novel Environmental Toxins: Steryl Glycosides as a Potential Etiological Factor for Age-Related Neurodegenerative Diseases,” Journal of Neuroscience Research, Vol. 85, No. 2, 2007, pp. 231-237. doi:10.1002/jnr.21147
- R. C. Tabata, J. M. B. Wilson, P. Ly, P. Zwiegers, D. Kwok, J. M. Van Kampen, et al., “Chronic Exposure to Dietary Sterol Glucosides is Neurotoxic to Motor Neurons and Induces an ALS-PDC Phenotype,” Neuromolecular Medicine, Vol. 10, No. 1, 2008, pp. 24-39. doi:10.1007/s12017-007-8020-z
- J. M. Wilson and C. A. Shaw, “Evidence for an Excitotoxicity in Murine Model of ALS-PDC,” Journal of Neurochemistry, Vol. 96, 2006, pp. 87-87.
- J. M. Wilson, I. Khabazian, M. C. Wong, A. Seyedalikhani, J. S. Bains, B. A. Pasqualotto, et al., “Behavioral and Neurological Correlates of ALS-Parkinsonism Dementia Complex in Adult Mice Fed Washed Cycad Flour,” NeuroMolecular Medicine, Vol. 1, No. 3, 2002, pp. 207-221. doi:10.1385/NMM:1:3:207
- J. M. B. Wilson, M. S. Petrik, S. C. Grant, S. J. Blackband, J. Lai, and C. A. Shaw, “Quantitative Measurement of Neurodegeneration in an ALS-PDC Model using MR Microscopy,” Neuroimage, Vol. 23, No. 1, 2004, pp. 336-343. doi:10.1016/j.neuroimage.2004.05.026
- M. S. Petrik, J. M. Wilson, S. C. Grant, S. J. Blackband, R. C. Tabata, X. Shan, et al., “Magnetic Resonance Microscopy and Immunohistochemistry of the CNS of the Mutant SOD Murine Model of ALS Reveals Widespread Neural Deficits,” NeuroMolecular Medicine, Vol. 9, No. 3, 2007, pp. 216-229.
- H. Kang, L. Tian and W. Thompson, “Terminal Schwann Cells Guide the Reinnervation of Muscle after Nerve Injury,” Journal of Neurocytology, Vol. 32, No. 5-8, 2003, pp. 975-985. doi:10.1023/B:NEUR.0000020636.27222.2d
- Y. J. Son and W. J. Thompson, “Schwann-Cell Processes Guide Regeneration of Peripheral Axons,” Neuron, Vol. 14, No. 1, 1995, pp. 125-132. doi:10.1016/0896-6273(95)90246-5
- F. Love, Y. Son and W. Thompson, “Activity Alters Muscle Reinnervation and Terminal Sprouting by Reducing the Number of Schwann Cell Pathways that Grow to Link Synaptic Sites,” Journal of Neurobiology, Vol. 54, No. 4, 2003, pp. 566-576. doi:10.1002/neu.10191
- A. Eisen and M. Weber, “The Motor Cortex and Amyotrophic Lateral Sclerosis,” Muscle Nerve, Vol. 24, No. 4, 2001, pp. 564-573. doi:10.1002/mus.1042
- G. Lee, T. Chu and C. A. Shaw, “The Primary Locus of Motor Neuron Death in an ALS-PDC Mouse Model,” Neuroreport, Vol. 20, No. 14, 2009, pp. 1284-1289. doi:10.1097/WNR.0b013e32833037ae
- F. Coppede, M. Mancuso, G. Siciliano, L. Migliore and L. Murri, “Genes and the Environment in Neurodegeneration,” Bioscience Reports, Vol. 26, No. 5, 2006, pp. 341-367. doi:10.1007/s10540-006-9028-6
- C. E. McOmish and A. J. Hannan, “Environments: Exploring Gene-Environment Interactions to Identify Therapeutic Targets for Brain Disorders,” Expert Opinion on Therapeutic Targets, Vol. 11, No. 7, 2007, pp. 899-913. doi:10.1517/14728222.11.7.899
- P. C. Wong, C. A. Pardo, D. R. Borchelt, M. K. Lee, N. G. Copeland, N. A. Jenkins, et al., “An Adverse Property of a Familial Als-Linked Sod1 Mutation Causes MotorNeuron Disease Characterized by Vacuolar Degeneration of Mitochondria,” Neuron, Vol. 14, No. 6, 1995, pp. 1105-1116. doi:10.1016/0896-6273(95)90259-7
- J. M. B. Wilson, I. Khabazian, D. V. Pow, U. K. Craig and C. A. Shaw, “Decrease in Glial Glutamate Transporter Variants and Excitatory Amino Acid Receptor Downegulation in a Murine Model of ALS-PDC,” Neuromocular Medicine, Vol. 3, No. 2, 2003, pp. 105-117. doi:10.1385/NMM:3:2:105
- M. Urushitani, S. Abou Ezzi and J. Julien, “Therapeutic Effects of Immunization with Mutant Superoxide Dismutase in Mice Models of Amyotrophic Lateral Sclerosis,” Proceedings of the National Academy of Sciences of the USA, Vol. 104, No. 7, 2007, pp. 2495-2500. doi:10.1073/pnas.0606201104
- C. Haenggeli, J. Julien, R. L. Mosley, N. Perez, A. Dhar, H. E. Gendelman, et al., “Therapeutic Immunization with a Glatiramer Acetate Derivative Does Not Alter Survival in G93A and G37R SOD1 Mouse Models of Familial ALS,” Neurobiology of Disease, Vol. 26, No. 1, 2007, pp. 146-152. doi:10.1016/j.nbd.2006.12.013
- J. Hegedus, T. Putman and T. Gordon, “Progressive Motor Unit Loss in the G93A Mouse Model of Amyotrophic Lateral Sclerosis is Unaffected by Gender,” Muscle Nerve, Vol. 39, No. 3, 2009, pp. 318-327. doi:10.1002/mus.21160
- A. Schaefer, J. Sanes and J. Lichtman, “A Compensatory Subpopulation of Motor Neurons in a Mouse Model of Amyotrophic Lateral Sclerosis,” Journal of Comparative Neurology, Vol. 490, No. 3, 2005, pp. 209-219. doi:10.1002/cne.20620
- D. J. Graber, W. F. Hickey and B. T. Harris, “Progressive Changes in Microglia and Macrophages in Spinal Cord and Peripheral Nerve in the Transgenic Rat Model of Amyotrophic Lateral Sclerosis,” Journal of Neuroinflammation, Vol. 7, 2010, p. 8. doi:10.1186/1742-2094-7-8
- J. Kriz, M. Nguyen and J. Julien, “Minocycline Slows Disease Progression in a Mouse Model of Arnyotrophic Lateral Sclerosis,” Neurobiology of Disease, Vol. 10, No. 3, 2002, pp. 268-278. doi:10.1006/nbdi.2002.0487
- S. Abou Ezzi, R. Lariviere, M. Urushitani and J. Julien, “Neuronal Over-Expression of Chromogranin A Accelerates Disease Onset in a Mouse Model of ALS,” Journal of Neurochemistry, Vol. 115, No. 5, 2010, pp. 1102-1111. doi:10.1111/j.1471-4159.2010.06979.x
- J. D. Atkin, R. L. Scott, J. M. West, E. Lopes, A. K. J. Quah and S. S. Cheema, “Properties of Slowand FastTwitch Muscle Fibres in a Mouse Model of Amyotrophic Lateral Sclerosis,” Neuromuscular Disorders, Vol. 15, No. 5, 2005, pp. 377-388. doi:10.1016/j.nmd.2005.02.005
- J. Zhang, G. Zhang, B. Morrison, S. Mori and K. A. Sheikh, “Magnetic Resonance Imaging of Mouse Skeletal Muscle to Measure Denervation Atrophy,” Experimental Neurology, Vol. 212, No. 2, 2008, pp. 448-457. doi:10.1016/j.expneurol.2008.04.033
- B. Stephens, R. J. Guiloff, R. Navarrete, P. Newman, N. Nikhar and P. Lewis, “Widespread Loss of Neuronal Populations in the Spinal Ventral Horn in Sporadic Motor Neuron Disease. A Morphometric Study,” Journal of the Neurological Sciences, Vol. 244, No. 1-2, 2006, pp. 41-58. doi:10.1016/j.jns.2005.12.003
- C. A. Farah, M. D. Nguyen, J. P. Julien and N. Leclerc, “Altered Levels and Distribution of Microtubule-Associated Proteins before Disease Onset in a Mouse Model of Amyotrophic Lateral Sclerosis,” Journal of Neurochemistry, Vol. 84, No. 1, 2003, pp. 77-86. doi:10.1046/j.1471-4159.2003.01505.x
- P. K. Thomas, R. H. M. King and A. K. Sharma, “AgeChanges in the Peripheral-Nerves of the Rat,” Gerontology, Vol. 27, No. 1-2, 1981, pp. 116-117.