Open Journal of Applied Sciences
Vol.3 No.1(2013), Article ID:29502,8 pages DOI:10.4236/ojapps.2013.31013
The Role of CeO2-Doping of Fe2O3/Co3O4 System on Its Structural Characteristics
1Physical Chemistry Department, National Research Center, Cairo, Egypt
2Physical Chemistry Department, Center of Excellence for Advanced Science, Renewable Energy Group, National Research Center, Cairo, Egypt
Email: *gamil_elshobaky@yahoo.com
Received September 27, 2012; revised November 8, 2012; accepted November 16, 2012
Keywords: Cobalt Ferrite; CeO2-Dopant; HR Coprecipitation
ABSTRACT
The role of ceria doping (0.75 - 3 mol%) on solid-solid interactions between ferric and cobaltic oxides was investigated. The investigated solids were characterized by TGA, DTA, XRD and HRTEM. The results revealed that ceria much enhanced the formation of nanosized CoFe2O4 (10 - 30 nm). The stimulation effect of ceria towards cobalt ferrite formation was evidenced from analysis of DTA and XRD investigations. In fact, the area of endothermic peak located at 575˚C - 680˚C relative to solid-solid interaction between ferric and cobaltic oxide increased by increasing the dopant concentration. This treatment decreased the activation energy of formation of the produced ferrite from 33 - 9.2 kJ/mol upon doping with 3 mol% CeO2. HRTEM analysis revealed the formation of homogenous nanosized CoFe2O4. The formation effect of ceria dopant towards the formation of CoFe2O4 has been tentatively attributed to an effective increase in the mobility of the reacting cations.
1. Introduction
Transition metal ferrites are commonly prepared by ceramic and chemical methods. The ceramic method requires heating ferric oxide with a transition metal oxides or carbonates at elevated temperatures above 900˚C [1-11]. While, the chemical method requires thermal treatment at moderate temperatures (400˚C - 600˚C) of iron and transition metals mixed hydroxides or carbonates prepared by coprecipitation [12,13]. The ferrites prepared by chemical method might exist as active catalysts because of their existences as finely divided metal ferrites.
The solid-solid interactions between Fe2O3 and the transition metal oxide to produce the corresponding ferrite is normally controlled by the thermal diffusion of the reacting cations through the whole mass of each solid as well as the initially formed ferrite film covering the surfaces of the grains of each oxide [8,9]. Ferrites are important components in the latest electronic products such as cellular phones, video cameras, notebook computers, hard and floppy drives etc and those that require small dimensions, light weight and better functions [14-16]. These ferrites have found application as contrast agents for magnetic resonance imaging (MRI) due to enhancement of relaxivity [17],in ferrofluid technology for MRI monitoring in hypothermia [18,19], and in cancer tumor detection via superconducting quantum interference device (SQUID) magnetometry [20-23].
The solid-solid interactions between ferric oxide and transition metal oxide to produce the corresponding ferrite could be enhanced or stimulated via doping with certain foreign oxides. The role of doping with Li2O, Na2O, ZnO, Al2O3, La2O3, and ZrO2 in the enhancement of the ferrite formations made the object of several investigations carried out by El-Shobaky et al. [1-12]. The stimulation effect of the dopant added on the ferrite formation has been suggested for due to an effective increase in the mobility of the reacting cations involved in the ferrite formation.
The stimulation effect of various dopants in the enhancement of formation of transition metal ferrite has been monitored by calculating the activation energy of formation of these ferrites. This method has been suggested earlier by El-Shobaky et al. [8] by making use of XRD results. These results included the peak area of the main diffraction peaks of the investigated ferrite as being influenced by dopant concentration and calcination temperatures. The validity of this method has been confirmed later by following up the magnetic properties of pure and ZnO-doped CdO and Fe2O3 yielding CdFe2O4
[15].
It is well known that CeO2-dopant for a variety of catalytic systems promotes oxygen vacancies. This vacancies increased oxygen storage capacity of the doped solids. So, CeO2-doping increase the mobility of reacting cations involved in the solid-solid interaction between different components of solids [23].
The present work aimed at investigating the solid-solid interactions between ferric oxide and cobaltic oxide as being influenced by doping with small amounts of CeO2 and calcination at temperatures within 500˚C - 700˚C. Ferric and cobaltic mixed oxides were prepared by thermal decomposition at 500˚C - 700˚C of their mixed carbonates obtained by coprecipitation. Pure and variously CeO2-doped solids were characterized by using XRD, TGA, DTA and HRTEM.
2. Experimental
2.1. Materials
All chemicals employed were of analytical grade and supplied by BDH company. Cobalt ferrites CoFe2O4 were prepared using wet chemical coprecipitation route.
The nitrates of cobalt  and iron
  were dissolved in distilled water at the designated molar ratio
 . Aqueous solution of 1M Na2CO3 was used as the precipitating agent. The metal nitrate solutions and the Na2CO3 solution were added dropwise from three separate burettes into a reaction vessels containing 1 L of distilled water under mechanical stirring. The mode of coprecipitation was carried out by taking 25 ml of ferric nitrate solution followed by dropwise addition of Na2CO3 solution till complete coprecipitation of the ferric carbonate. This process was followed by dropwise addition of 50 ml of cobalt nitrate solution and 25 ml of ferric nitrate solution with vigorous stirring till complete coprecipitation of all mixed carbonates. The rate of addition was controlled in order to maintain a constant pH = 8 during the co-precipitation process. Coprecipitation was thermostated at the desired temperature (70˚C). The precipitate was washed till free from
  and Na+ ions. It was then filtered, dried at 100˚C overnight then calcined at 500˚C, 600˚C and 700˚C for 5 h to achieve transformation into spinel phase.
Samples doped with cerium were obtained by treating a known mass of finely powdered mixed carbonates prepared by coprecipitation with a calculated amount of cerium ammonium nitrate dissolved in the least amounts of distilled water necessary to make a paste. The paste was dried at 100˚C to constant weight and then calcined at 500˚C, 600˚C and 700˚C for 5 h. The nominal concentration of cerium in the doped samples expressed as mol% CeO2 was 0.75, 1.5 and 3, respectively.
2.2. Techniques
Differential Thermal Analysis (DTA) of pure and doped uncalcined solids was carried out using Perkin-Elmer DTA thermal analyzer. A 10 mg solid specimen was taken in each experiment. The rate of heating was kept at 10˚C/min. Thermogravimetry (TGA) was carried out using Perkin-Elmer (TGA7) thermogravimetric analyzer, the rate of heating was kept at 10˚C·min–1. A 10 mg sample of solid specimen was used in each case. DTA and TGA curves of various uncalcined samples were determined by heating in a current of pure nitrogen flowing at rate of 20 cc/min in a temperature ranged between room temperature to 1000˚C.
X-ray powder diffractograms of various investigated samples calcined at 400˚C, 500˚C and 600˚C were determined using a Brukerdiffractometer (Bruker D 8 advance target). The patterns were run with copper Kα with secondly monochromator (l = 1.5405 Å) at 40 kV and 40 mA. The scanning rate was 8˚ and 0.8˚ in  for phase identification and line broadening profile analysis, respectively. The crystallite size of the phases present in pure and variously CeO2-doped solids was determined using the Scherrer equation [24]:
where d is the mean crystallite diameter, λ is the X-ray wave length of the incident beam, K is the Scherrer constant (0.89),  is the full width at half maximum (FWHM) of the main diffraction peaks of the investigated phases, in radian and θ is the diffraction angle.
The nano structure of the samples was examined using very dilute suspensions in water by the aid of JEOL- 2100 high resolution transmission electron microscope (HRTEM) with accelerating voltage up to 200 kV. The microscopy probes of the sample was prepared by adding a small drop of the water dispersions onto a lacey carbon film-coated copper grid and allowed to dry initially in air then by applying high vacuum.
3. Results and Discussion
3.1. Thermal Behavior of Pure and Variously Doped Uncalcined Solids
The thermograms (TGA, DTA) of pure and variously doped solids are shown in Figure 1. TGA curves of various investigated uncalcined solids consisted of six weight loss processes. The first process extends between 78˚C - 98˚C, the second extends between 112˚C - 162˚C, the third extends between 184˚C - 282˚C, the forth extends between 550˚C - 600˚C and the last peak extends between 625˚C - 720˚C. These processes are accompanied by weight losses of 2.2 - 4.2, 1.5 - 2.3, 5.5 - 7.6, 5.2
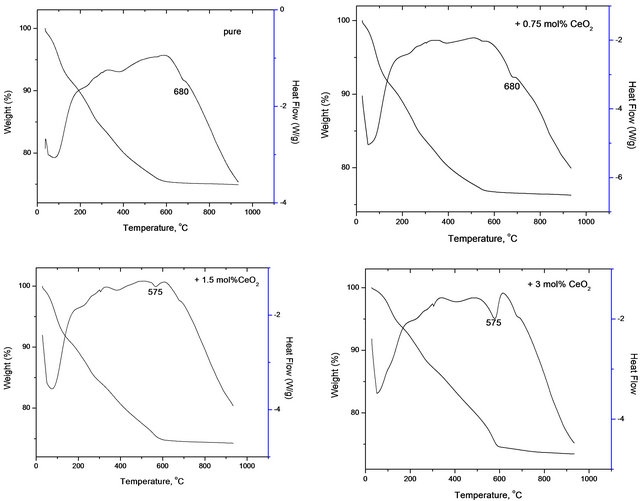
Figure 1. Thermograms (TGA, DTA) of pure and variously doped solids.
- 13.8, 0.5 - 7.3 and 0.3 - 1.2 wt% for the six processes, respectively.
The DTA curves of various solids composed of six endothermic peaks most of them are weak and broad having their maxima located at 77˚C - 85˚C, 95˚C - 130˚C, 220˚C - 305˚C, 380˚C - 410˚C, 550˚C - 580˚C and 670˚C - 690˚C. The first DTA and TGA processes taking place at temperature below 100˚C correspond to removal of physisorbed water and water of crystallization. The other processes taking place at temperatures 162 - 550 indicate a progressive thermal decomposition of ferric and cobaltic carbonates yielding their oxides. The last endothermic peak taking place at 575˚C - 680˚C might correspond to the solid-solid interaction between the produced cobalt and ferric oxides yielding cobalt ferrite. This speculation will be confirmed later in the present work by XRD investigation. The cobalt ferrite formation process took place according to:

The last endothermic peak corresponding to cobalt ferrite formation showed its maximum at temperatures that decreased by increasing the dopant concentration. In fact, the maximum of this particular peak is located at 680˚C for pure mixed solids and that doped with 0.75 mol% CeO2 falling to 575˚C for the other doped mixed solids. Furthermore, the area of this peak increased progresssively as a function of the dopant concentration.
So, it can be deduced from the observed progressive increase in the area of the last endothermic peak relative to cobalt ferrite formation that ceria enhanced the solidsolid interaction between cobalt and ferric oxides leading to the formation of CoFe2O4. This conclusion will be confirmed later in the next section of the present work through XRD analysis of various solids.
3.2. X-Ray Investigation of Various Solids
X-ray diffractograms of pure and variously CeO2-doped solids being calcined at 500˚C - 700˚C were determined. The diffractograms of the investigated solids are given in Figures 2-4 corresponding to pure and variously doped
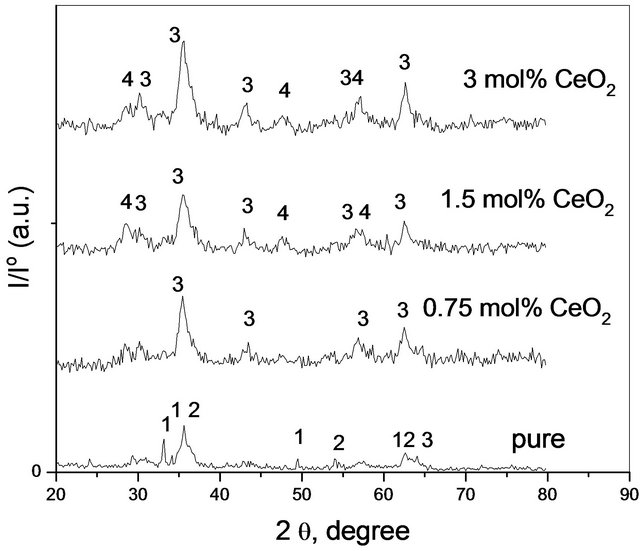
Figure 2. X-ray diffractograms of pure and treated solids calcined at 500˚C, Lines 1 refer to Fe2O3, Lines 2 refers to Co3O4, Lines 3 refers to CoFe2O4 and Lines 4 refers to CeO2.

Figure 3. X-ray diffractograms of pure and treated solids calcined at 600˚C, Lines 1 refer to Fe2O3, Lines 2 refers to Co3O4, Lines 3 refers to CoFe2O4 and Lines 4 refers to CeO2.
solids calcined at 500˚C, 600˚C and 700˚C, respectively. It is clear from these figures that the diffractograms of pure  calcined at 500˚C consisted of all diffraction peaks of CoFe2O4 [79-1744-JCPDS-ICDD, Copyright 2001] as a major phase together with all diffraction peaks of unreacted α-Fe2O3 phase [87-1166- JCPDS-ICDD, Copyright 2001] and Co3O4 phase [74- 1657-JCPDS-ICDD,Copyright 2001]. This finding shows clearly that heating a mixture of pure Fe2O3 and Co3O4 at 500˚C for 5 h was not sufficient for their complete conversion into the ferrite phase as been shown in our previous work [12]. It can also be seen from Figure 1 that
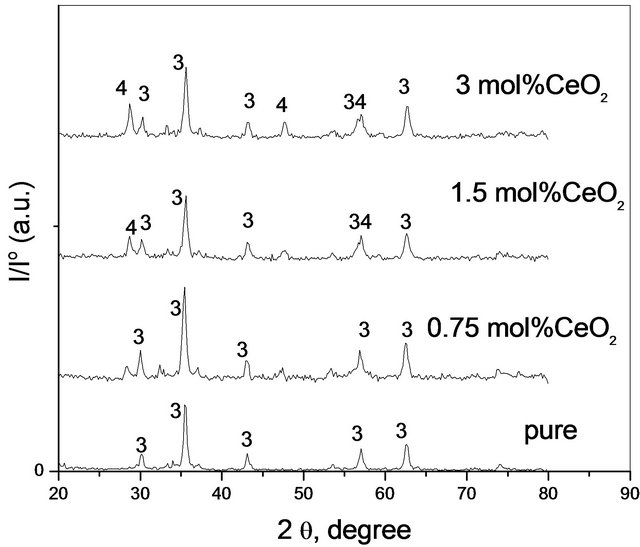
Figure 4. X-ray diffractograms of pure and treated solids calcined at 700˚C, Lines 1 refer to Fe2O3, Lines 2 refers to Co3O4, Lines 3 refers to CoFe2O4 and Lines 4 refers to CeO2.
the presence of the smallest amount of CeO2 (0.75 mol%) in mixed solids calcined at 500˚C led to the complete disappearance of α-Fe2O3 and Co3O4 as separate phases indicating their complete conversion into CoFe2O4. So, cerium oxide much enhanced the cobalt ferrite formation.
The different diffraction data including relative intensity of the main diffraction lines of crystalline phases present and their crystallite size (determined from the Scherrer’s equation) are given in Tables 1 and 2.
Examination of Tables 1 and 2 reveals the following: 1) Pure mixed solids calcined at 500˚C consisted of CoFe2O4 together with un-reacted portion of α-Fe2O3 and Co3O4 phases; 2) Solid-solid interaction between ferric and cobaltic oxides took place at temperature starting from 500˚C yielding nanosized cobalt ferrite; 3) Increasing the calcination temperature within 500˚C - 700˚C led to complete conversion of the reacting ferric and cobaltic oxides producing cobalt ferrite having a crystallite size in the nano range (10 - 30 nm); 4) The disappearance of all diffraction peaks of un-reacted oxides (α-Fe2O3 and Co3O4) in all CeO2-doped solids being calcined at 500˚C might reflect the role of CeO2 in the enhancement of the solid-solid interaction between iron and cobalt oxides; 5) The appearance of some diffraction peaks of CeO2 [75- 0076-JCPDS-ICDD, Copyright 2001] in the solids doped with 1.5 and 3 mol% ceria might reflect the dissolution of a portion of the ceria added and the other portion remained as a separate phase.
The observed enhancement of cobalt ferrite formation, by doping with CeO2, can be investigated by determining the activation energy of formation of cobalt ferrite  for pure and variously CeO2-doped mixed solids. This has been tentatively achieved from the results given in
Table 1. Phases present and their crystallite size of the solids being calcined at 500˚C - 700˚C.
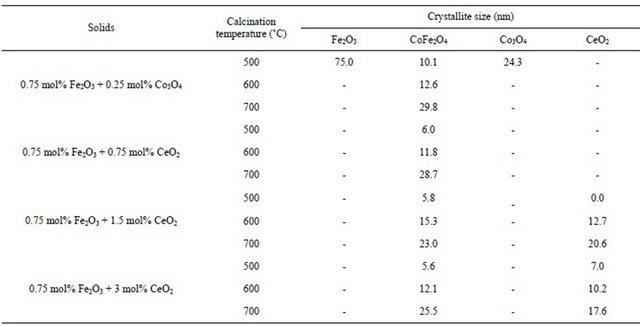
Table 2. The relative intensities of pure and variously doped samples being calcined at 500˚C - 700˚C.
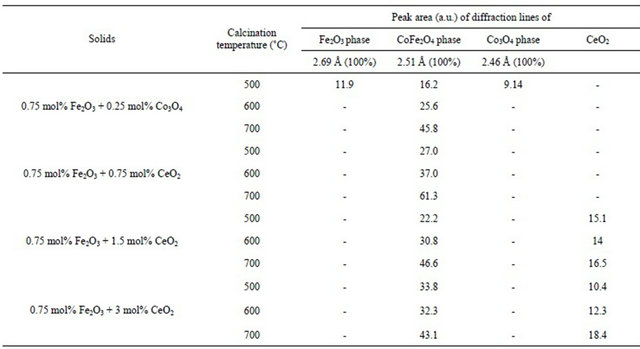
Table 2 adopting the method proposed by El-Shobaky et al. [9] by assuming that the peak area of the main diffraction line of CoFe2O4 at 2.51 Å as a measure of the amount of CoFe2O4 present in a given mixed solids at definite temperature. By plotting the peak area of the main diffraction peak of CoFe2O4 (d = 2.51 Å) Vs. precalcination temperature for pure and CeO2-doped solids, a straight line is obtained whose slope determines the ΔE value by direct application of the Arrhenius equation. This trail has been successfully carried out at temperatures between 500˚C - 700˚C, and the plots obtained are given in Figure 5. The computed ΔE values, obtained from the diffraction peak at d spacing of 2.51 Å, are 33, 26, 23.4 and  for pure mixed solids and those doped with 0.75, 1.5 and 3 mol% CeO2, respecttively. The suggested method used in the calculation of
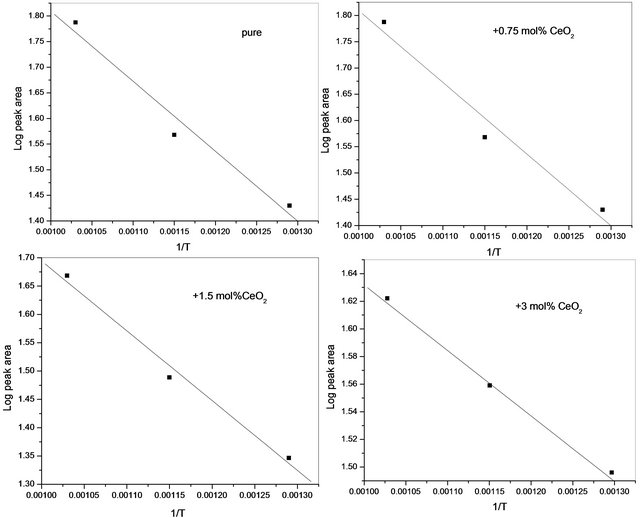
Figure 5. Change of Log peak height of the diffraction line of CoFe2O4 (2.51 Å) as a function of pure and CeO2-doped mixed solids.
the activation energy of formation from the observed increase in the area of the main diffraction peak of CoFe2O4 by increasing the calcination temperature of pure and variously doped mixed oxides assumed that the observed increase in peak area of the diffraction peak at 2.51 Å is a measure of the abundance of the produced ferrite [9].
The computed values of activation energy of formation of cobalt ferrite were found to decrease progressively as a function of the amount of ceria added. This finding suggested clearly that an effective stimulation of cobalt ferrite was reached at by doping with small amount of ceria. The decrease in ΔE values, due to CeO2-doping ran parallel to the amount of CeO2 present which reflects an effective increase in the mobility of thermal diffusion of the reacting cations through the whole mass of the reacting oxides and through the early produced CoFe2O4 film.
The observed stimulation effect of ceria towards cobalt ferrite formation might reflect the role of the dopant in increasing the mobility of the reacting cations (Co2+ and Fe3+). It is well known that ceria containing solids [23, 25-27] acted as oxygen storage via creation of anionic vacancies. The presences of these vacancies increased the mobility of reacting cations increasing thus their reactivity towards the ferrite formation.
It has been reported by one of the authors that the activation energy of formation of pure CoFe2O4 prepared by ceramic method measured values between 47.3 and 100 kJ/mol [3,4]. The comparison between these two values and values presented in the present work (33 - 9.2 kJ/mol) pointed out to the fact that the ferrites prepared by ceramic method are more difficult to be formed as compared to those prepared by chemical method via thermal treatment of mixed carbonates or hydroxides prepared by coprecipitation.
3.3. HRTEM Investigations of Various Solids
The crystallinity of the particles was investigated by high resolution TEM (Figure 6). In the HRTEM images of the
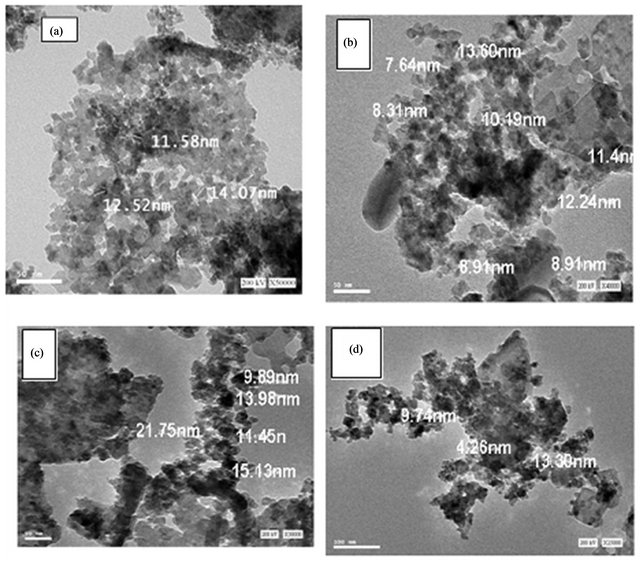
Figure 6. HRTEM images of pure and doped mixed solids calcined at 500˚C: (a) Pure mixed oxides; (b) 0.75 mol% CeO2; (c) 1.5 mol% CeO2; (d) 3 mol% CeO2.
particles made of pure and variously doped samples. HRTEM micrographs in Figure 6 shows that the particles have nano-spherical morphology and relatively uniform with diameter ranged from 7.6 nm to 21.3 nm. This finding is in a good agreement with the results obtained by XRD investigation.
4. Conclusions
The following are the main conclusions that may be drawn from the obtained results:
1) Nanosized cobalt ferrite phase was produced upon heating ferric and cobaltic mixed oxides at temperatures starting from 500˚C.
2) The produced ferrite existed as nanosized compound measuring crystallite size between 10 - 30 nm as being evidenced from the values calculating from the Scherer’s equation.
3) Ceria doping (0.75 - 3 mol%) enhanced the solidsolid interaction between the reacting oxides to yielding CoFe2O4.
4) The activation energy of formation (∆E) of CoFe2O4 for pure and variously doped mixed solids was determined from XRD measurements. The computed ∆E values were 33, 26, 23.4 and 9.2 kJ/mol for pure mixed solids and those treated with 0.75, 1.5, 3 mol% CeO2, respectively.
5) HRTEM analysis revealed the formation of homogenous nanosized CoFe2O4.
REFERENCES
- G. A. El-Shobaky, A. N. Al-Noaimi, A. Abd El-Aal and A. M. Ghozza, “Effect Of Lithium Oxide Doping On SurFace And Catalytic Properties Of Nio, Fe2O3 Solids,” Materials Letters, Vol. 22, No. 1, 1995, pp. 39-45. doi:10.1016/0167-577X(94)00223-1
- G. A. El-Shobaky, F. H. A. Abdalla and A. A. Fouad Zikry, “Effect of Lithium Oxide Doping on Zinc Ferrite Formation,” Thermochimica Acta, Vol. 289, No. 1, 1996, pp. 81-89. doi:10.1016/S0040-6031(96)03028-6
- G. A. El-Shobaky, F. H. A. Abdalla and A. M. Ghozza, “Investigation of Solid-Solid Interactions between Pure and Li2O-Doped Cobalt and Ferric Oxides,” Thermochimica Acta, Vol. 292, No. 1-2, 1997, pp. 123-133. doi:10.1016/S0040-6031(96)03073-0
- N. R. E. Radawn and H. G. El-Shobaky, “Solid-Solid Interactions between Ferric and Cobalt Oxides as Influenced by Al2O3-Doping,” Thermochimica Acta, Vol. 360, No. 2, 2000, pp. 147-156. doi:10.1016/S0040-6031(00)00565-7
- M. S. Selim, G. Turky, M. A. Shouman and G. A. ElShobaky, “Effect of Li2O Doping on Electrical Properties of CoFe2O4,” Solid State Ionics, Vol. 120, No. 1-4, 1999, pp. 173-181. doi:10.1016/S0167-2738(99)00008-9
- G. A. El-Shobaky, N. R. E. Radawn and F. M. Radwan, “Investigation of Solid-Solid Interactions between Pure and Li2O-Doped Magnesium and Ferric Oxides,” Thermochimica Acta, Vol. 380, No. 1, 2001, pp. 27-35. doi:10.1016/S0040-6031(01)00632-3
- N. A. Deraz and G. A. El-Shobaky, “Solid-Solid Interaction between Ferric Oxide and Manganese Carbonate as Influenced by Lithium Oxide Doping,” Thermochimica Acta, Vol. 375, No. 1-2, 2001, pp. 137-145. doi:10.1016/S0040-6031(01)00512-3
- G. A. El-Shobaky and A. A. Mostafa, “Solid-Solid Interactions in Fe2O3/MgO System Doped with Aluminium and Zinc Oxides,” Thermochimica Acta, Vol. 408, No. 1- 2, 2003, pp. 75-84. doi:10.1016/S0040-6031(03)00323-X
- G. A. El-Shobaky and A. A. Ibrahim, “Effects of Li2O Doping on Thermal Solid-Solid Interaction between Ferric Oxide and Nickel Carbonate,” Thermochimica Acta, Vol. 132, 1988, pp. 117-126. doi:10.1016/0040-6031(88)87101-6
- G. A. El-Shobaky and A. A. Ibrahim, “Thermal SolidSolid Interaction between Ferric Oxide and Al2O3-Doped Nickel Oxide Solid,” Bulletin de la Société Chimique de France, Vol. 28, No. 1, 1989, pp. 24-29.
- G. A. El-Shobaky, A. M. Turky, N. Y. Mostafa and S. K. Mohamed, “Effect of Preparation Conditions on Physicochemical, Surface and Catalytic Properties of Cobalt Ferrite Prepared by Coprecipitation,” Journal of Alloys and Compounds, Vol. 493, No. 1-2, 2010, pp. 415-422. doi:10.1016/j.jallcom.2009.12.115
- G. A. Fagal, A. A. Badawy, N. A. Hassan and G. A. ElShobaky, “Effect of La2O3-Treatment on Textural and Solid-Solid Interactions in Ferric/Cobaltic Oxides System,” Journal of Solid State Chemistry, Vol. 194, 2012, pp. 162-167. doi:10.1016/j.jssc.2012.04.032
- T. Ogawa, T. Kumagai, T. Suzuki and S. Okuma, “Implementation of Vibration Suppression Control on FWL Processor,” Japan Electricity Engineering, Vol. 128, No. 1, 1999, pp. 45-52.
- T. Nomura and A. Nakno, “New Evolution of Ferrite for Multilayer Chip Components,” Proceedings of the 6th International Conference on Ferrites (ICF6), Kyoto, 29 September 1992, pp. 1198-1201.
- A. A. Mostafa, G. A. El-Shobaky and E. Girgis, “Effect of ZnO-Doping on Structural and Magnetic Properties of CdFe2O4,” Journal of Physics D: Applied Physics, Vol. 39, No. 10, 2006, pp. 2007-2011. doi:10.1088/0022-3727/39/10/004
- Z. X. Tang, C. M. Sorensen and K. J. Klabunde, “SizeDependent Curie Temperature in Nanoscale MnFe2O4 Particles,” Physical Review Letters, Vol. 68, No. 25, 1991, pp. 3602-3605. doi:10.1103/PhysRevLett.67.3602
- H. M. Reinl, M. Peller and M. Hagmann, “Ferrite-Enhanced MRI Monitoring in Hyperthermia,” Magnetic Resonance Imaging, Vol. 23, No. 10, 2005, pp. 1017-1020. doi:10.1016/j.mri.2005.09.008
- R. Hergt, R. Hiergeist and I. Hilger, “Maghemite Nanoparticles with Very High AC-Losses for Application in RF-Magnetic Hyperthermia,” Journal of Magnetism and Magnetic Materials, Vol. 270, No. 3, 2004, pp. 345-357. doi:10.1016/j.jmmm.2003.09.001
- G. G. Kenning, R. Rodriguezand V. S. Zotev, “Detection of Magnetically Enhanced Cancer Tumors Using SQUID Magnetometry: A Feasibility Study,” Review of Scientific Instruments, Vol. 76, No. 1, 2005, Article ID: 014303. doi:10.1063/1.1834696
- M. D. Shultz, S. Calvin, P. P. Fatouros, S. A. Morrison and E. E. Carpenter, “Enhanced Ferrite Nanoparticles as MRI Contrast Agents,” Journal of Magnetism and Magnetic Materials, Vol. 311, No. 1, 2007, PP. 464-468. doi:10.1016/j.jmmm.2006.10.1188
- H. Yang, C. Zhang, X. Shi, H. Hua, X. Du, Y. Fang, Y. Ma, H. Wu and S. Yang, “Water-Soluble Superparamagnetic Manganese Ferrite Nanoparticles for Magnetic Resonance Imaging,” Biomaterials, Vol. 31, No. 13, 2010, pp. 3667-3673. doi:10.1016/j.biomaterials.2010.01.055
- M. Hashim, A. Muddin, S. Kumar, B. H. Koo, S. E. Shirsath, E. M. Mohammed, J. Shahe, R. K. Kotnalae, H. K. Choib, H. Chungf and R. Kumarg, “Structural, Electrical and Magnetic Properties of Co-Cu Ferrite Nanoparticles,” Journal of Alloys and Compounds, Vol. 518, No. 1, 2012, pp. 11-18. doi:10.1016/j.jallcom.2011.12.017
- G. A. El-Shobaky, H. M. A. Hassan, N. S. Yehia and A. A. Badawy, “Effect of CeO2 -Doping on Surface and Catalytic Properties of CuO-ZnO System,” Journal of NonCrystalline Solids, Vol. 356, No. 1, 2010, p. 32. doi:10.1016/j.jnoncrysol.2009.09.024
- B. D. Cullity, “Publishing Cos,” 2nd Edition, AddisonWesley, Reading, 1978, pp. 102-105.
- A. Bueno-Lopez, K. Krishna and M. Makkee, “Oxygen Exchange Mechanism between Isotopic CO2 and Pt/CeO2,” Applied Catalysis A: General, Vol. 342, No. 1-2, 2008, pp. 144-149. doi:10.1016/j.apcata.2008.03.013
- L. Jia, M. Shen, J. Hao, T. Rao and J. Wang, “Dynamic Oxygen Storage and Release over Mn0.1Ce0.9Ox and Mn0.1Ce0.6Zr0.3Ox Complex Compounds and Structural Characterization,” Journal of Alloys and Compounds, Vol. 454, No. 1-2, 2008, pp. 321-326. doi:10.1016/j.jallcom.2006.12.040
- O. Adamopoulos, E. Bjorkman, Y. Zhang, M. Mamoun, S. B. Ta and M. Lother, “A Nanophase Oxygen Storage Material: Alumina-Coated Metal-Based Ceria,” Journal of the European Ceramic Society, Vol. 29, No. 4, 2009, pp. 677-689. doi:10.1016/j.jeurceramsoc.2008.07.017
NOTES
*Corresponding author.