Open Journal of Endocrine and Metabolic Diseases
Vol.3 No.1(2013), Article ID:28058,10 pages DOI:10.4236/ojemd.2013.31013
The Role of Renal Regulatory Mechanisms in the Evolution and Treatment of Pediatric Diabetic Ketoacidosis
1Department of Pediatrics, Division of Pediatric Critical Care, Tulane University Medical Center, New Orleans, USA
2Department of Pediatrics, Division of Pediatric Nephrology, Tulane University Medical Center, New Orleans, USA
3Department of Pediatrics, Division of Pediatric Endocrinology, Tulane University Medical Center, New Orleans, USA
Email: *oakingbo@tulane.edu
Received December 4, 2012; revised January 5, 2013; accepted February 6, 2013
Keywords: Diabetic Ketoacidosis; Pediatrics; Hyperosmolar; Cerebral Edema; Hyperglycemia; Hyperkalemia
ABSTRACT
Diabetic ketoacidosis (DKA) is a life threatening complication of diabetes mellitus in pediatric patients with new onset insulin dependent diabetes. Despite advances in therapy mortality from DKA, especially in children less than two years, remains high. This review highlights the role of obligatory renal defense mechanisms in the evolution of DKA and its implication for therapy: to accomplish this goal the review starts with a cursory description of the pathogenesis and pathophysiology of metabolic derangements in DKA as a basis for understanding the renal compensatory mechanisms geared towards restoration of acid-base balance; then, the next section of the review describes how alterations in fluid and electrolyte balance at the onset of DKA and the extent of renal regulatory defense mechanisms geared towards its restoration can predispose to cerebral edema at the beginning of therapy. We conclude by suggesting that restoration of fluid and electrolyte balance should be based on the severity of metabolic acidosis as determined by the extent of renal impairment at the onset and during the course of DKA rather than strictly by protocols.
1. Introduction
About half a million children worldwide are estimated to have diabetes mellitus [1] and the incidence of insulin dependent diabetes mellitus (IDDM) is increasing by about 3% (range 2% - 5%) per year with a higher incidence in children less than four years [1]. Data from a United States study showed that youngest children (less than 2 years) were at greatest risk, with over 37.3% presenting with diabetic ketoacidosis (DKA) compared to 14.7% in those aged 15 - 19 years [2]. A multicenter European study showed widely varying incident rate of 26% - 67% in patients with IDDM [3]. Worldwide, newly diagnosed cases of IDDM with DKA occur predominantly among children in the most deprived communities especially ethnic minorities with poor access to health care [3,4]. Despite advances in management over the past 20 years the incidence of mortality associated with DKA remains unacceptably high compared to the general population particularly in the age group 1 - 4 years [5]. Recent reported mortality rate in national population-based studies is 0.31% in United Kingdom [5] and 0.15% in United States [6]. In developing countries mortality rates are higher due to higher rates of infection, protein-energy malnutrition and delay in seeking medical care [7]. The objectives of this review are: 1) to acquaint the reader with the pathogenesis and pathophysiology of IDDM as a basis for understanding the fluid and electrolyte derangements in DKA; 2) to discuss the role of renal regulatory mechanisms in the evolution DKA and the predisposition to cerebral edema at the onset of therapy.
Pathogenesis of IDDM. The etiology of IDDM is thought to be autoimmune, possibly through interplay of genetic predisposition and environmental factors like viral infections. Autoimmune destruction of insulin producing beta cells of the pancreas can be initiated by infection of any cell in the body by a virus whose proteins share an amino acid sequence with a beta cell protein or by direct viral infection of a beta cell with subsequent release of cytokines (e.g. interferon-α) and the adhesion of leukocytes within the pancreatic islets [8]. In a recent study 17.8% of children (less than 21 years of age) with DKA have presumed viral infection and 12.9% had bacterial infection [9]. Once the autoimmune process is triggered by infection, destruction of beta cells occurs via various effector mechanisms like antibody dependent cellular cytotoxicity, delayed hypersensitivity and complement activation. Factors regulating the speed of autoimmune destruction of beta-cells include genetic predisposition (HLA subtype), increased metabolic activity of beta cells (pubertal growth spurt) and the age at which the child encountered the precipitating event. Histological studies suggest that 80% reduction in volume of beta cells is required to develop symptomatic IDDM from pancreatic beta cell failure [10].
Pathophysiology. The two events that can precipitate DKA are either absolute lack of insulin due to pancreatic beta cell failure or relative insulin deficiency from excess counter regulatory hormone secretion in response to stress [11,12]. In the absence of insulin, a catabolic state ensues in the liver, adipose tissues and skeletal muscle cells. Insulin regulates production of ketones through its action on hepatic, adipose and peripheral tissues. Insulin inhibits lipolysis in adipose tissues, while it enables esterification of free fatty acids in the liver and stimulates oxidation of ketones in muscle cell [11,12]. Insulin deficiency initiates metabolic derangements resulting in hyperketonemia due to both overproduction and decreased utilization of ketones. Ketogenesis is further stimulated by glucagon through oxidation of fatty acids in the liver. Severe dehydration due to osmotic diuresis and other metabolic changes in DKA leads to release of counterregulatory hormones like catecholamines, renin, aldosterone, arginine vasopressin in order to restore intravascular volume [12]. The resulting hormonal imbalance leads to insulin resistance and stimulation of gluconeogenesis, ketogenesis, and lipolysis [12].
Hyperglycemia. Results from impaired glucose utilization by most tissues and increased hepatic glucose production due to insulin deficiency and increased level of glucagon. An elevated glucagon/insulin ratio causes a drop in fructose 2,6-biphosphate concentration, resulting in inactivation of phosphofructokinase and activation of fructose 1-6-biphosphatase; the end result is enhanced gluconeogenesis and clinical hyperglycemia [12]. Hyperglycemia leads to osmotic diuresis and glycosuria in patients with DKA.
2. Fluid and Electrolyte Losses
Extracellular Fluid Compartment. Hyperglycemia causes increased effective osmotic pressure of the extracellular fluid (ECF) compartment leading to osmotic shift of water out of skeletal muscle cells [13]. The increased filtered load of glucose from hyperglycemia exceeds renal tubular reabsorptive capacity leading to significant glycosuria and osmotic diuresis [13]. However ECF volume expansion from hyperglycemia is transient because vomiting and osmotic diuresis ultimately leads to volume depletion. Progressive rise in serum osmolality occurs in DKA because urinary water losses and extra renal fluid losses exceed electrolyte losses [13]. Pre-renal azotemia due to volume depletion is a classic finding in DKA and levels of blood urea nitrogen (BUN), creatinine, total proteins, uric acid, hematocrit and hemoglobin are elevated in severe DKA due to ECF volume contraction [13]. The typical water and electrolyte deficits in DKA and their therapeutic implications are outlined in (Table 1).
Sodium & Chloride Losses. Serum sodium may be normal, high or low on presentation in patients with DKA. High serum sodium and chloride may result from ECF volume contraction because osmotic diuresis due to hyperglycemia counterbalances dilution of these electrolytes that could result from movement of water into the ECF from the intracellular fluid (ICF) compartment [13]. Urinary losses of sodium from osmotic diuresis exceed chloride losses because most of the urinary anions are ketones rather than chloride but vomiting may magnify chloride losses (13). Low serum sodium usually results from the following mechanisms: 1) water movement into the ECF from ICF because of hyperglycemia; movement of sodium from ECF to ICF in replacement of potassium losses; 2) reduced ability to excrete ingested water because vasopressin is released in response to ECF volume contraction [13,14]. Absence of hyponatremia in a child with severe DKA in the presence of significant hyperglycemia implies low intake of water due to a decreased ability to obtain or ingest water as a result of impaired sensorium or coma [14]. Persistent hyponatremia in DKA after correcting for hyperglycemia is usually the result of excessive administration of fluid [15]. Also, serum sodium is spuriously low in presence of hyperlipidemia because the aqueous phase of blood in which sodium predominantly resides is decreased in extreme lipemia [16,17]. True plasma sodium can be calculated from the formula: True (Na) (0.021[T] + 0.994) where T equals the triglyceride level in g/dL and sodium is expressed in mEq/L [17,18].
Potassium Losses. Serum potassium levels in DKA may range from normal to high and occasionally attaining lethal levels. Varying degrees of total body potassium depletion occurs mainly from massive kaliuresis, decreased intake and frequent vomiting [19-21]. Because potassium is the principal cation in the ICF compartment, it is retained intracellularly by an electrical negative voltage created by Na+-K+, ATPase [20,21]. This voltage is diminished in an insulin-deficient state therefore K+ is redistributed from ICF to ECF compartment in DKA. Increased effective serum osmolality characteristic of DKA contributes to hyperkalemia due to translocation of potassium rich fluid from the ICF to ECF compartment [20,21]. However, critical hypokalemia following insulin
Table 1. Typical deficits in a patient with diabetic ketoacidosis.
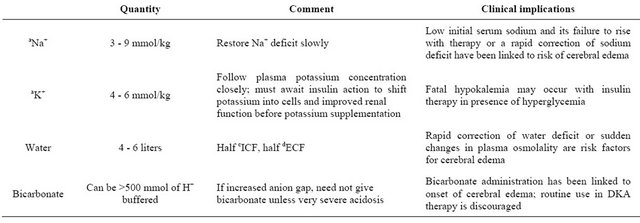
aNa+, sodium; bK+, potassium; cICF, intracellular fluid; dECF, extracellular fluid. Adapted with permission from authors, Dubose & Hamm [62].
administration can occur in DKA because of existing total body deficit of K+ from vomiting and increased renal losses [22].
Phosphate Losses. Serum phosphate levels fluctuate widely in patients with DKA despite overall depletion in body phosphate stores [23]. Initially, the apparently high or normal phosphate levels on admission correlate positively with the serum effective osmolality, serum glucose concentration and degree of acidosis because academia induces release of phosphate from cells. However, a drop in phosphate level usually occurs with insulin and fluid therapy; renal mechanisms of hypophosphatemia in DKA include: 1) inhibition of phosphate reabsorption from the proximal tubule by high glucose concentration in the filtrate; 2) decrease filtrate concentration of sodium, low urinary pH and osmotic diuresis [23,24]. Hypocalcemia and hypomagnesemia are potential complications resulting from routine administration of phosphate in DKA patients with hypophosphatemia [24].
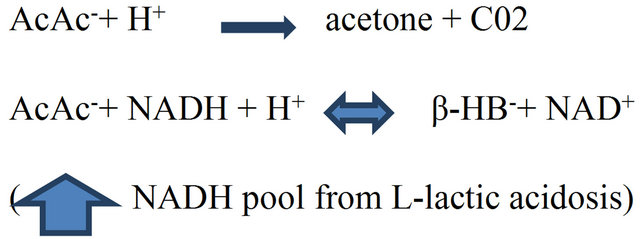
Acid-Base Changes. Increased fatty acid pool in DKA [25] leads to over production of acetoacetate (H.AcAc) and B-hydroxybutyric acid (H.B-HB) in the liver. Hydrogen ions (H+) are consumed by conversion of H.AcAc to acetone which is eliminated via the lungs and is in part responsible for removal of ketoacids [26]. A high redox potential (nicotinamide adenine dinucleotide; NADH-toNAD+) from hypoperfusion and lactic acidosis during DKA leads to the body’s inability to eliminate ketoacids by the acetone route; as a result, a shift in the equilibrium between H.AcAc and H.B-HB towards H.B-HB production occurs as shown in the equation below.
The resultant accumulation of H.β-HB in excess of H.AcAc (3:1 molar ratio) leads to increased plasma unmeasured anions [27] or anion gap (AG). The AG (normal, 12 ± 2 mEq/L.) refers to plasma anions other than chloride and bicarbonate that balance the positive charges of sodium and potassium. Ketoacids anions are buffered by bicarbonate resulting in an increased AG metabolic acidosis [28,29]. Also, a mixture of AG metabolic acidosis and hyperchloremic acidosis (HCA) can occur in DKA because of significant urinary losses of ketone salts of sodium and potassium with retention of chloride [30, Figure 1]. HCA can also result from: 1) excessive use of chloride rich isotonic fluids; 2) correction of potassium deficits with potassium chloride; in the latter case, uptake of potassium in exchange for ICF hydrogen ions (H+) result in net increase in ECF chloride because of bicarbonate buffering of the H+ [30].
Issues for Management. DKA can be diagnosed purely on clinical grounds (weight loss, polyuria, polydipsia, lethargy or coma) and with the aid of the laboratory tests shown in (Table 2). In order to avoid treatment related errors in DKA the following issues must be considered: 1) accuracy of the clinical estimates of dehydration; 2) rate of fluid repletion; 3) the extent of renal impairment and its implication for fluid and insulin therapy in DKA; 4) risk of cerebral edema resulting from fluid repletion and insulin therapy especially in the setting of renal impairment.
Estimation and Replacement of Fluid Losses. Clinical assessment of fluid deficits and its rate of repletion are diverse in DKA depending on the specialty training and bias of the treating physician [31]. Evidence from recent studies revealed an overestimation of fluid deficits in most patients with DKA [32,33]. In a study by Fagan et al. [32] data from 33 episodes of DKA showed that majority of patients had moderate (4% - 8%) dehydration using percent loss of body weight but by clinical assessment the degree of dehydration was overestimated in 67% of patients in the study. In a study by Koves et al. [33], there was a significant difference between assessed and measured dehydration: while the median absolute measure of dehydration calculated by patients’ weight gain in their study was 8.7% fluid deficit was overestimated in 24% of their patients [33]. The authors concluded that clinical assessment of dehydration in DKA is complicated by the extent of water deficit in ICF and ECF compartments, the overall catabolic state of the patient and the effects of metabolic acidosis on the clinical signs of dehydration. Moreover, weight loss (a valid measure of dehydration) could result from increased catabolism due to insulin deficiency and not solely from severe dehydration [32-34]. Apart from inaccurate assessment of the degree of dehydration, published reports indicate that physicians do not always follow established guidelines on fluid repletion and are apt to giving large volumes of fluid during treatment for DKA [35,36].
Renal Impairment in DKA. Hypovolemia causes varying degrees of renal impairment in DKA due to reduction in renal blood flow (RBF) and glomerular filtration rate (GFR) [37,38]; BUN and plasma creatinine varies inversely with GFR, increasing as the GFR falls in severe hypovolemia [39]. Volume depletion leads to passive reabsorption of urea along with sodium in the proximal tubules. The net effect is a fall in urea excretion and elevation in BUN and BUN/plasma creatinine ration [39]. Concomitant reduction in plasma volume from dehydration is associated with elevation in hematrocrit and plasma albumin concentrations since both red cells and albumin are limited to the vascular space [39]. The effective osmolality of the plasma (Posm) is determined to a large extent by renal regulation of solutes (sodium, potassium, glucose, and urea) and water [39]. Insulin therapy and the extent of renal impairment can determine the extent of changes in Posm with dire consequences in DKA. For ease of management, DKA patients can be categorized into two groups (Figure 2) based on renal indices and the pattern of acid-base disturbances on admission [40]: 1) those with significant renal impairment, as shown by higher elevations of BUN, creatinine, albumin and hematocrit; 2) those with mild renal impairment, as shown by slight elevations in BUN, creatinine, albumin and hematocrit [40]. Typical patterns of acidbase disorders in DKA include AG metabolic acidosis and or HCA. While HCA is due to urinary excretion of ketone salts (loss of bicarbonate precursors) and retention of chloride in patients with relatively preserved renal function, AG acidosis, on the other hand, occurs in those with severe DKA and renal insufficiency [40]. In order to determine severity of metabolic acidosis as a guide to subsequent therapy, a distinction between the two subsets of DKA patients can be made by initial assessment of the ratio of excess AG to bicarbonate (∆/∆ ratio): where excess AG (mEq/L) equals measured AG minus normal AG (∆AG); and bicarbonate deficit (mEq/L) equals normal plasma bicarbonate minus measured plasma bicarbonate (∆Hc03). Expected ∆/∆ ratio is 1.0 since the bicarbonate deficit is the result of its titration by ketoacids ([40], Table 3). Values above unity indicate severe ECF volume deficit and renal impairment as seen in DKA patients with pure AG acidosis compared to those with HCA [40]. The adequacy of renal function is an important determinant of rise in AG from ketoacidosis. In DKA patients without renal impairment, there is a minimal rise in anion gap and the ∆/∆ ratio is <1 because filtered ketoacids
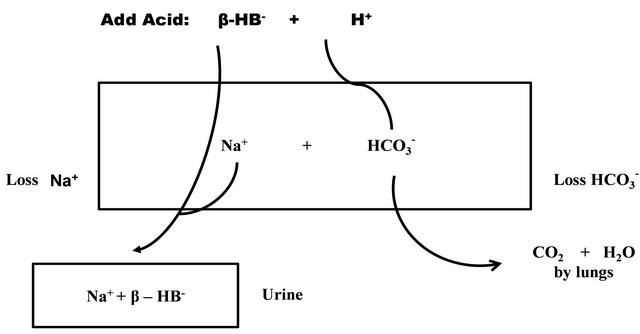
Figure 1. Development of hyperchloremic metabolic acidosis (non anion gap) in DKA from indirect loss of bicarbonate precursors as sodium salts of ketoacids. The rectangle depicts the body, and it contains Na+ and HCO3− ions. When β-hydroxybutyric acid (H.AβHB) is added, its H+ is removed by reacting with HCO3−. The anion (βHB−) is excreted along with Na+ for electroneutrality. This excretion occurs when the urine contains more βHB− than NH4+. Patients with relatively normal *GFR excretes ketoacids load (βHB− anion) that exceeds renal tubular reabsorptive capacity thereby minimizing rise in anion gap (AG). AG is higher when renal function is impaired because of retention of βHB−. *GFR; glomerular filtration rate. Reproduced with permission from Dubose & Hamm [62].
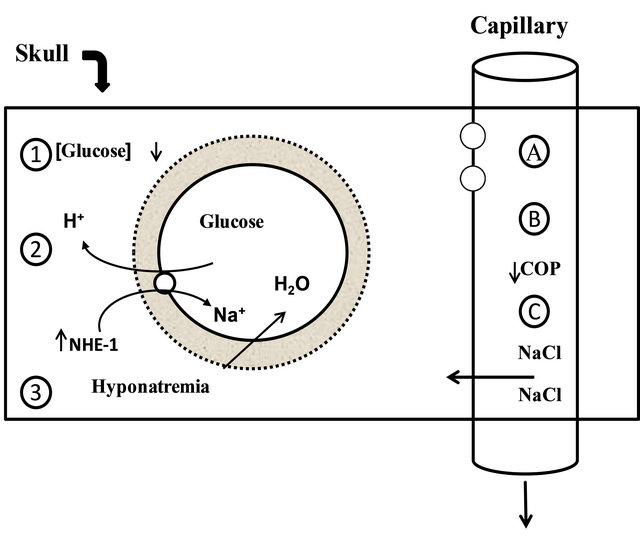
Figure 2. Risk factors for cerebral edema: the solid rectangle represents the skull. The three risk factors for swelling of brain cells are shown on the left and include a higher concentration of glucose or its metabolites in the brain due to rapid lowering of the blood glucose level (site 1), activation of the Na+:H+ exchanger-1 (NHE-1) by insulin (site 2), and the development of hyponatremia (site 3). The factors causing expansion of the extracellular fluid volume of the brain are shown on the right and could be the result of less restrictive blood brain barrier (site A), a fall in the colloid osmotic pressure (COP) in plasma (siteB), or excessive administration of saline (site C). Reproduced with permission from Dubose and Hamm [62].
exceeds tubular reabsorptive capacity with resultant excretion of large quantities of ketoacids anions [40]. This is in sharp contrast to DKA patients with low GFR from renal impairment in whom retention of β-hydroxybutyric acid leads to increased AG and a rise in ∆/∆ ratio above unity because elevation in aniongap exceeds fall in plasma bicarbonate concentration ([40], Table 3). Therefore, DKA patients with pure AG acidosis are prone to more complications compared to patient with HCA [40]. The longer the duration of acid-base stress and the extent of renal and other regulatory defense mechanisms geared towards its restoration, the higher the risks of cardiorespiratory and central nervous system (CNS) complications in DKA. Complications arise as a result of dehydration, hyperosmolality and metabolic acidosis: for example, compensatory hyperventilation in severe metabolic acidosis is associated with increased respiratory work load and risk of respiratory failure in DKA [41]. Also, a higher risk of cerebral edema and hypoxic-ischemic CNS injury in DKA has been linked to the severity of hypocarbia on admission due to reduction in cerebral blood flow from vasoconstriction [42].
Implications for Therapy. Majority of protocols for management of DKA in children are based on the assumption of a normal renal function [43]. Recent consensus guidelines allude to renal impairment in DKA without recommending changes in fluid management to reflect decreased renal function [44,45]. Clinicians must be cognizance of the association between occurrence of cerebral edema in DKA (CE-DKA) and factors like rate of fluid administration and changes in effective osmolality of plasma (Posm) during DKA therapy [45]. CEDKA occurs in 0.5% - 1% of DKA patients especially in those less than 5 yrs old and it is associated with a high mortality rate of 20% - 90% [46,47]. Though studies [48, 49] have shown evidence of subclincal CE-DKA even before commencement of therapy, results of animal and human studies [50,51] demonstrate increased intracranial pressure (ICP) as fluids are administered in DKA. Other authors have postulated existence of a possible association between occurrence of symptomatic CE-DKA and a drop in effective Posm within 4 - 12 hrs of fluid therapy [52,53]. To underscore the association of CE-DKA with institution of fluid therapy, factors determining changes in Posm prior to admission and at beginning of therapy must be considered based on the relationship between plasma sodium concentration and total body water. This relationship is expressed in the following equation as: Plasma (Na+) = Nae+ + Ke+/TBW; Nae+ and Ke+ refers to the osmotically active quantities of sodium and potassium; TBW refers to total body water [54]. In patients with DKA, factors likely to increase Posm begin prior to admission and at initiation of therapy as outlined in (Table 4). Pre-admission factors lead to dehydration due to reduction in TBW relative to the concentrations of Nae+ and Ke+ in the above equation with resultant increase in Posm. In addition, adaptive response by brain cells to the changes in Posm begins prior to admission and it involves accumulation of electrolytes (Na+ and K+), amino acids and idiogenic osmoles in the CNS [54,55]. Therefore, increased Posm and adaptive CNS changes occurs prior to admission for DKA as a result of ongoing metabolic derangements typical of this condition. However, a drop in Posm post-admission could result from alteration in the ratio of Nae+ + Ke+/TBW as a result of therapy with fluid and insulin (Table 4), thus setting the stage for complications like CE-DKA. In the study by Hoorn et al. [56], a drop in Posm occurred in 12 patients with CE-DKA who received and retained more fluid compared to controls. The CE-DKA patients in their study also had significantly lower levels (<135 mEq/L) of serum sodium (![]() ) before onset of treatment. Reviewing their study, Sema et al. [57,58] suggested that low pre-treatment
) before onset of treatment. Reviewing their study, Sema et al. [57,58] suggested that low pre-treatment ![]() is dilutional due to water retention from osmotic effects
is dilutional due to water retention from osmotic effects
Table 2. Laboratory abnormalities on admission for diabetic ketoacidosis.
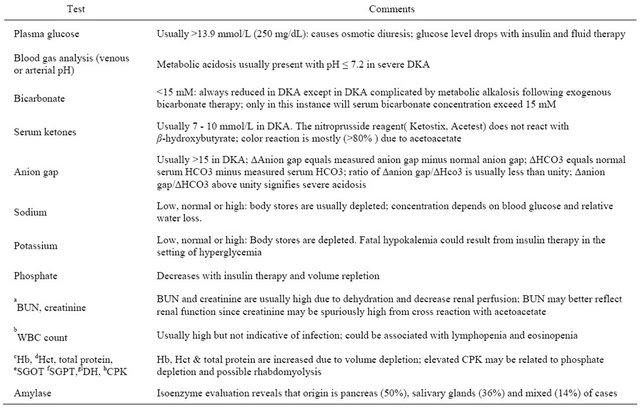
aBUN, blood urea nitrogen; bWBC count, white blood cell count; cHb, hemoglobin; dHct, hematocrit; eSGOT, serum glutamic oxaloacetic transaminase; fSGPT, serum glutamic pyruvic transaminase; glDH, lactate dehydrogenase; hCPK, creatine phosphokinase; Adapted with kind permission from Springer Science + Business Media, B. V. Adrogue et al. [40].
Table 3. Ratio of excess plasma anion gap over bicarbonate deficit in diabetic ketoacidosis.
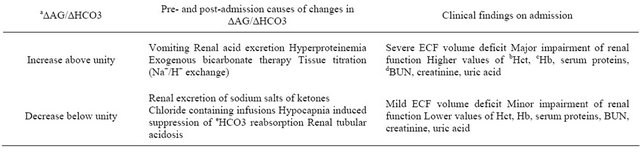
a∆AG/∆HCO3; ∆AG (mEq/L) equals measured anion gap (AG) minus normal AG; ∆HCO3, equals normal plasma bicarbonate minus measured plasma bicarbonate; expected value of this ratio is 1.0 since the bicarbonate deficit is the result of its titration by ketoacids; bHct, hematocrit; cHb, hemoglobin; dBUN, blood urea nitrogen; eHc03, bicarbonate; Adapted with kind permission from Springer Science + Business Media, B. V. Adrogue et al. [40].
Table 4. Factors associated with changes in effective serum osmolality (Posm) before and after therapy in diabetes ketoacidosis.
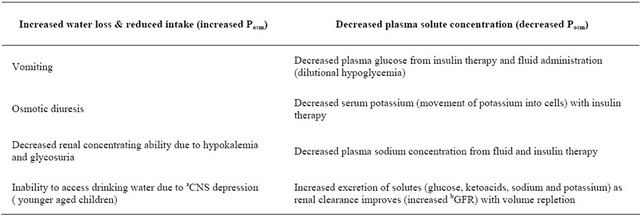
Effective plasma osmolality (Posm) is determined by the ratio of exchangeable sodium (Na+) and potassium (K+) to total body water (TBW). These variables, Na+ + K+/TBW( mEq/L) can be altered by concentration of sodium relative to free water administered. Increasing Na+ content of administered fluid elevates Posm by increasing plasma Na+ concentration; increasing TBW decreases Posm by decreasing plasma Na+ concentration. Use of isotonic fluid has no effect on Posm as ratio of Na++K+/TBW remains unchanged. aCNS, central nervous system; bGFR, glomerular filtration rate.
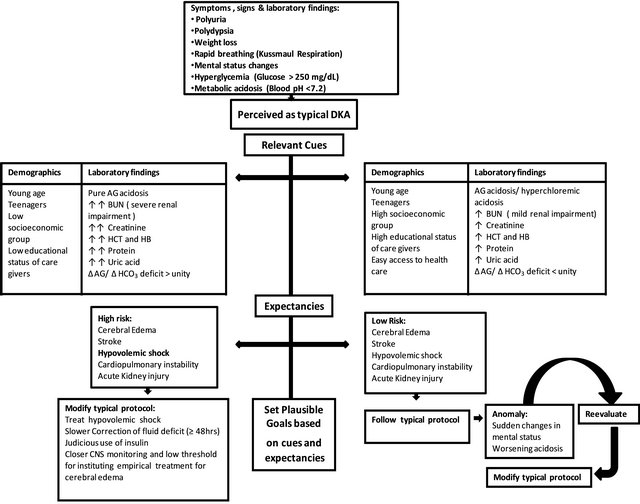
Figure 3. Pattern recognition of severity of DKA based on indices of renal function and other laboratory findings on admission. A pattern of relevant cues and expectancies can guide the clinician in setting plausible therapeutic goals. The algorithm shows the dynamic nature of clinical decision making in a complex metabolic disease like diabetic ketoacidosis.
of retained ketoacids and hyperglycemia in DKA patients with low GFR and reduced clearance of ketoacids and blood glucose. Thus DKA patients with renal insufficiency and severe metabolic acidosis on admission are at higher risk of CE-DKA from reduction in Posm at commencement of therapy. Also, a drop in Posm can result from the net reduction in ECF K+ resulting from insulin therapy and kaliuresis as GFR improves following fluid repletion: movement of K+ out of cells leads to a corresponding movement of Na+ into cells, with the attendant drop in plasma Na+ ultimately leading to reduced Posm and osmotically mediated CNS swelling [59,60]. Also, the activation of Na+-H+ exchanger with insulin therapy (Figure 3) has been linked to changes in Posm because insulin causes translocation of H+ from ICF into ECF and a corresponding movement of Na+ from ECF into ICF compartment to maintain electroneutrality; thus, CEDKA could result from reduction in ECF Na+ concentration and drop in Posm at beginning of insulin therapy [61-64]. However, recent data from the study by Glaser et al. [65] did not show any association between onset of CE-DKA and osmotic fluctuations from therapeutic interventions because neither the rates of fluid, sodium and insulin administration, nor changes in serum glucose were associated with CE-DKA in their study; only a higher BUN, severe hypocapnia (marker of renal impairment and AG acidosis) at presentation and a slow rise in serum sodium (![]() ) after therapy were associated with CE-DKA in their study [65]: Glaser et al. [65] attributed absence of post-treatment rise in
) after therapy were associated with CE-DKA in their study [65]: Glaser et al. [65] attributed absence of post-treatment rise in ![]() to CNS salt wasting rather than to dilutional hyponatremia from hyperglycemia or excessive fluid administration. Regardless of the cause, a low glucose corrected
to CNS salt wasting rather than to dilutional hyponatremia from hyperglycemia or excessive fluid administration. Regardless of the cause, a low glucose corrected ![]() on admission and failure of
on admission and failure of ![]() to rise after correction of hyperglycemia with insulin have been identified as a central mechanism in the development of CE-DKA [57-66]. Rapid correction of fluid deficits may precipitate or worsen existing CNS injury in DKA, especially in late presenters with severe hyperosmolar dehydration and renal insufficiency [67,68]; therefore, correction of estimated fluid deficits should be accomplished slowly over 48 hours or longer as in cases of non-diabetic hyperosmolar dehydration and renal failure, once hypovolemic shock is corrected [67,68].
to rise after correction of hyperglycemia with insulin have been identified as a central mechanism in the development of CE-DKA [57-66]. Rapid correction of fluid deficits may precipitate or worsen existing CNS injury in DKA, especially in late presenters with severe hyperosmolar dehydration and renal insufficiency [67,68]; therefore, correction of estimated fluid deficits should be accomplished slowly over 48 hours or longer as in cases of non-diabetic hyperosmolar dehydration and renal failure, once hypovolemic shock is corrected [67,68].
3. Conclusion
The pattern of acid-base and electrolyte disorders in DKA, patient’s age, duration of symptoms and the degree of renal insufficiency prior to admission are important considerations in the evaluation and management of patients. Fluid therapy goals in pediatric DKA should be dictated by the degree of renal impairment and the severity of metabolic acidosis as determined by the ratio of excess AG to that of bicarbonate deficit on admission [Figure 3].
REFERENCES
- F. Kaufman, “Diabetes—A Pediatric Perspective,” US Endocrine Disease, 2007, pp. 12-14.
- A. Rewers, G. S. Klingen, C. Davis, et al., “Presence of Diabetic Ketoacidosis at Diagnosis of Diabetes Mellitus in Youth: The Search for Diabetes in Youth Study,” Pediatrics, Vol. 121, No. 5, 2008, pp. e1258-e1266. doi:10.1542/peds.2007-1105
- C. P. Smith, D. Firth, S. Benneth, et al., “Ketoacidosis Occurring in Newly Diagnosed and Established Diabetic Children,” Acta Paediatrica, Vol. 87, No. 5, 1998, pp. 537-541. doi:10.1111/j.1651-2227.1998.tb01499.x
- P. B. Koul, “Diabetic Ketoacidosis: A Current Appraisal of Pathophysiology and Management,” Clinical Pediatrics, Vol. 48, No. 2, 2009, pp. 135-144. doi:10.1177/0009922808323907
- J. Edge, M. E. Ford-Adams and D. B. Dunger, “Causes of Death in Children with Insulin Dependent Diabetes 1990- 1996,” Archives of Disease in Childhood, Vol. 81, No. 4, 1999, pp. 318-323. doi:10.1136/adc.81.4.318
- L. Levitsky, E. Ekwo, C. A. Goselink, I. L. Solomon and T. Acete, “Death from Diabetes Mellitus (DM) in Hospitalized Children,” Pediatric Research, Vol. 29, 1991, p. A195.
- M. Jayashree and S. Singhi., “Diabetic Ketoacidosis: Predictors of Outcome in a Pediatric Intensive Care Unit of a Developing Country,” Pediatric Critical Care Medicine, Vol. 5, No. 5, 2004, pp. 427-433. doi:10.1097/01.PCC.0000137987.74235.5E
- M. A. Atkinson and N. K. McLaren, “The Pathogenesis of Insulin Dependent Diabetes Mellitus,” The New England Journal of Medicine, Vol. 331, No. 21, 1994, pp. 1428-1436. doi:10.1056/NEJM199411243312107
- R. G. Flood and V. W. Chiang, “Rate and Prediction of Infection in Children with Diabetic Ketoacidosis,” American Journal of Emergency Medicine, Vol. 19, No. 4, 2001, pp. 270-273. doi:10.1053/ajem.2001.24473
- A. K. Foulis, C. N. Liddle, M. A. Farquharson, J. Richmond, et al., “The Histopathology of the Pancreas in Type 1 (Insulin Dependent) Diabetes Mellitus: A 25-Year Review of Deaths in Patients under 20 Years of Age in the United Kingdom,” Diabetologia, Vol. 29, No. 5, 1986, pp. 267-274. doi:10.1007/BF00452061
- M. Silink, “Practical Management of Diabetic Ketoacidosis in Childhood and Adolescence,” Acta Paediatrica, Vol. 425, Suppl. s425, 1998, pp. 63-66. doi:10.1111/j.1651-2227.1998.tb01255.x
- W. T. Cefalu, “Diabetic Ketoacidosis,” Critical Care Clinics, Vol. 7, No. 1, 1991, pp. 89-108.
- H. J. Adrogue, G. Eknoyam and W. K. Suki, “Diabetic Ketoacidosis: Role of Kidney in the Acid-Base Homeostatis Re-Evaluated,” Kidney International, Vol. 25, 1984, pp. 591-598. doi:10.1038/ki.1984.62
- J. M. Roscoe, M. L. Halperin, F. S. Rolleston, et al., “Hyperglycemia-Induced Hyponatremia: Metabolic Considerations in Calculation of Serum Sodium Depression,” Canadian Medical Association Journal, Vol. 112, No. 4, 1975, pp. 452-453.
- H. J. Adrogue, J. Barrero and G. M. Dolson, “Diabetic Ketoacidosis,” In: W. N. Suki and S. G. Massry, Eds., Therapy of Renal Diseases and Related Disorders, Kluwer Academic Publishers, Norwell, pp. 194-206.
- J. D. Bagdade, D. Porte Jr. and E. L. Dierman, “Diabetic Lipemia,” The New England Journal of Medicine, Vol. 276, 1967, pp. 427-433. doi:10.1056/NEJM196702232760802
- B. M. Frier, C. R. Steer, J. D. Baird and S. Bloomfield, “Misleading Plasma Electrolytes in Diabetic Children with Severe Hyperlipidaemia,” Archives of Disease in Childhood, Vol. 55, No. 10, 1980, pp. 771-775. doi:10.1136/adc.55.10.771
- M. H. Goldman and M. Kashani, “Spurious Hyponatremia in Diabetic Ketoacidosis with Massive Lipid Elevations,” The Journal of the Medical Society of New Jersey, Vol. 3, No. 79, 1982, pp. 591-592.
- M. L. Halperin, D. Z. I. Cherney and K. S. Kamel, “Ketoacidosis,” In: T. D. Dubose and L. Hamm, Eds., AcidBase and Electrolyte Disorders, Elsevier, Philadelphia, 2002, pp. 67-82.
- H. J. Adrogue, E. D. Lederer, W. N. Suki and G. Eknoyan, “Determination of Plasma Potassium Levels in Diabetic Ketoacidosis,” Medicine, Vol. 65, 1986, pp. 163-172.
- S. Goldfarb, M. Cox, I. Singer and M. Goldberg, “Acute Hyperkalemia Induced by Hyperglycemia: Hormonal Mechanisms,” Annals of Internal Medicine, Vol. 84, No. 4, 1976, pp. 426-432.
- T. Clausen and P. G. Kohn, “The Effect of Insulin on the Transport of Sodium and Potassium in Rat Soleus Muscle,” The Journal of Physiology, Vol. 265, No. 1, 1977, pp. 18-42.
- D. J. Becker, D. R. Brown, B. H. Steranka, et al., “Phosphate Replacement during Treatment of Diabetic Ketoacidosis: Effects on Calcium and Phosphorous Homeostasis,” American Journal of Diseases of Children, Vol. 137, No. 3, 1983, pp. 241-246.
- T. Clerbaux, M. Reynaert, E. Willems, et al., “Effect of Phosphate on Oxygen-Hemoglobin Affinity, Disphosphoglycerate and Blood Gases during Recover from Diabetic Ketoacidosis,” Intensive Care Medicine, Vol. 15, No. 8, 1989, pp. 495-498. doi:10.1007/BF00273559
- M. A. Sperling, “Diabetic Ketoacidosis,” Pediatric Clinics of North America, Vol. 31, 1984, pp. 591-610.
- O. E. Owen, V. E. Trapp, C. L. Skutches, et al., “Acetone Metabolism during Diabetic Ketoacidosis,” Diabetes, Vol. 31, No. 3, 1982, pp. 242-248. doi:10.2337/diabetes.31.3.242
- M. Halperin, R. A. Bear, M. C. Hannaford, et al., “Selected Aspect of the Pathophysiology of Metabolic Acidosis in Diabetes Mellitus,” Diabetes, Vol. 30, No. 9, 1981, pp. 781-787. doi:10.2337/diabetes.30.9.781
- H. J. Adrogue, H. Wilson, A. E. Boyd, W. N. Suki and G. Eknoyan, “Plasma Acid-Based Patterns in Diabetic Ketoacidosis,” The New England Journal of Medicine, Vol. 307, No. 26, 1982, pp. 1603-1610. doi:10.1056/NEJM198212233072603
- D. M. Kydd, “Salt and Water in the Treatment of Diabetic Acidosis,” The Journal of Clinical Investigation, Vol. 12, No. 6, 1993, pp. 1169-1183.
- H. J. Adrogue, G. Eknoyan and W. K. Suki, “Diabetic Ketoacidosis: Role of the Kidney in the Acid-Base Homeostasis Re-Evaluated,” Kidney International, Vol. 25, No. 4, 1984, pp. 591-598. doi:10.1038/ki.1984.62
- N. S. Glaser, N. Kuppermann, C. K. Yee, et al., “Variation in the Management of Pediatric Diabetic Ketoacidosis by Specialty Training,” Archives of Pediatrics & Adolescent Medicine, Vol. 151, No. 11, 1997, pp. 1125-1132. doi:10.1001/archpedi.1997.02170480055008
- M. J. Fagan, J. Avner and H. Khine, “Initial Fluid Resuscitation for Patients with Diabetic Ketoacidosis: How Dry Are They?” Clinical Pediatrics, Vol. 47, No. 9, 2008, pp. 851-855. doi:10.1177/0009922808319960
- I. H. Koves, J. Neutze, S. Donath, W. Lee, et al., “The Accuracy of Clinical Assessment of Dehydration during Diabetic Ketoacidosis,” Diabetes Care, Vol. 27, No. 10, 2004, pp. 2485-2487. doi:10.2337/diacare.27.10.2485
- M. Y. Linares, J. E. Schunk and R. Lindsay, “Laboratory Presentation in Diabetic Ketoacidosis and Duration of Therapy,” Pediatric Emergency Care, Vol. 12, No. 5, 1996, pp. 347-351. doi:10.1097/00006565-199610000-00006
- R. K. Singh, P. Perros and B. M. Frier, “Hospital Management of Diabetic Ketoacidosis: Are Clinical Guidelines Implemented Effectively?” Diabetes Medicine, Vol. 14, No. 6, 1977, pp. 482-486. doi:10.1002/(SICI)1096-9136(199706)14:6<482::AID-DIA371>3.0.CO;2-A
- J. Rutledge and R. Couch, “Initial Fluid Management of Diabetic Ketoacidosis in Children,” American Journal of Emergency Medicine, Vol. 18, No. 6, 2000, pp. 658-660. doi:10.1053/ajem.2000.16298
- O. E. Owen, J. H. Licht and D. G. Sapir, “Renal Function and Effects of Partial Rehydration during Diabetic Ketoacidosis,” Diabetes, Vol. 30, No. 6, 1981, pp. 510-518.
- L. M. Bernstein, E. F. Foley and W. S. Hoffman, “Renal Function during and after Diabetic Coma,” Journal of Clinical Investigation, Vol. 31, No. 7, 1952, pp. 711-716. doi:10.1172/JCI102653
- B. D. Rose and T. W. Post, “Hypovolemic States,” In: Clinical Physiology of Acid-Base and Electrolyte Disorders, McGraw Hill, New York, 2001, pp. 415-446.
- H. J. Adrogue, J. Barrero and G. M. Dolson, “Diabetic Ketoacidosis,” In: W. N. Suki and S. G. Massry, Eds., Therapy of Renal Diseases and Related Disorders, Kluwer Academic Publishers, Norwell, 1991, pp. 194-205.
- W. H. Hoffman, J. P. Locksmith, E. M. Burton, et al., “Interstitial Pulmonary Edema in Children and Adolescents with Diabetic Ketoacidosis,” Journal of Diabetes and Its Complications, Vol. 12, No. 6, 1988, pp. 314-320. doi:10.1016/S1056-8727(98)00012-9
- N. Glaser, P. Barnett, I. McCaslin, D. Nelson, et al., “Risk Factors for Cerebral Edema in Children with Diabetic Ketoacidosis,” The New England Journal of Medicine, Vol. 344, No. 4, 2001, pp. 264-269. doi:10.1056/NEJM200101253440404
- A. C. Argent, “What Determines the Outcome of Children with Diabetic Ketoacidosis Admitted to the Pediatric Intensive Care Unit of a Developing Country,” Pediatric Critical Care Medicine, Vol. 5, No. 5, 2004, pp. 492-493. doi:10.1097/01.PCC.0000137990.24227.80
- D. B. Dunger, M. A. Sperling, C. L. Acerini, et al., “Management Issues. ESPE/LEPES Consensus Statement on DKA in Children and Adolescents,” Archives of Disease in Childhood, Vol. 89, No. 2, 2004, pp. 188-194. doi:10.1136/adc.2003.044875
- J. Edge, “Fluid Management in Diabetic Ketoacidosis,” Archives of Disease in Childhood, Vol. 86, No. 6, 2002, pp. 443-445. doi:10.1136/adc.86.6.443
- N. Glaser, P. Barnett, I. McCaslin, D. Nelson, et al., “Risk Factors for Cerebral Edema in Children with Diabetic Ketoacidosis,” The New England Journal of Medicine, Vol. 344, No. 4, 2001, pp. 364-269. doi:10.1056/NEJM200101253440404
- J. A. Edge, M. M. Hawkins, D. L. Winter, et al., “The Risk and Outcome of Cerebral Edema Developing during Diabetic Ketoacidosis,” Archives of Disease in Childhood, Vol. 85, No. 1, 2001, pp. 16-22. doi:10.1136/adc.85.1.16
- E. J. Krane, M. A. Rockoff, J. K. Wallman and J. I. Wolfsdorf, “Subclinical Brain Swelling in Children during Treatment of Diabetic Ketoacidosis,” The New England Journal of Medicine, Vol. 312, No. 18, 1985, pp. 1147- 1151. doi:10.1056/NEJM198505023121803
- I. V. Glaser, P. Barnett, I. McCaslin, et al., “Risk Factors for Cerebral Edema in Children with Diabetic Ketoacidosis. The Pediatric Emergency Medicine Collaborative Research Committee of the American Academy of Pediatrics,” The New England Journal of Medicine, Vol. 344, No. 4, 2001, pp. 264-269. doi:10.1056/NEJM200101253440404
- G. D. Harris, I. Fiordalasi and C. Yu, “Maintaining Normal Intracranial Pressure in Rabbit Model during Treatment of Severe Diabetic Ketoacidemia,” Life Science, Vol. 59, No. 20, 1996, pp. 1695-1702. doi:10.1016/S0024-3205(96)00505-X
- R. S. Clements Jr., S. A. Blumenthal, A. D. Morrison, et al., “Increased Cerebrospinal Fluid Pressure during Treatment of Diabetic Ketosis,” Lancet, Vol. 298, No. 7726, 1971, pp. 671-675. doi:10.1016/S0140-6736(71)92245-8
- R. M. Shastry and V. Bhatia, “Cerebral Edema in Diabetic Ketoacidosis,” Indian Pediatrics, Vol. 43, 2006, pp. 701-708.
- C. D. Inward and T. L. Chambers, “Fluid Management in Diabetic Ketoacidosis,” Archives of Disease in Childhood, Vol. 86, No. 6, 2002, pp. 443-445. doi:10.1136/adc.86.6.443
- I. S. Edelman, J. Leibman, M. P. O’Meara, et al., “Interrelations between Serum Sodium Concentration, Serum Osmolarity and Total Exchangeable Potassium and Total Body Water,” Journal of Clinical Investigation, Vol. 37, No. 9, 1958, pp. 1236-1256. doi:10.1172/JCI103712
- K. Strange, “Regulation of Solute and Water Balance and Cell Volume in the Central Nervous System,” Journal of the American Society of Nephrology, Vol. 3, No. 1, 1992, pp. 12-27.
- E. Hoorn, A. Carlotti, L. Costa, et al., “Preventing a Drop in Effective Plasma Osmolality to Minimize the Likelihood of Cerebral Edema during Treatment of Children with Diabetic Ketoacidosis,” Journal of Pediatrics, Vol. 150, No. 5, 2007, pp. 467-473. doi:10.1016/j.jpeds.2006.11.062
- A. Sema and J. M. Puliyel, “Cerebral Edema in Diabetic Ketoacidosis with Serum Sodium < 135 mEq/L,” Journal of Pediatrics, Vol. 152, No. 1, 2008, pp. 145-146.
- J. M. Puliyel and V. Bhambhani, “Ketoacid Levels May Alter Osmotonicity in Diabetic Ketoacidosis and Precipitate Cerebral Edema,” Archives of Disease in Childhood, Vol. 88, No. 4, 2003, p. 366. doi:10.1136/adc.88.4.366-a
- B. D. Rose and T. W. Post, “Introduction to Disorders of Osmolality,” In: Clinical Physiology of Acid-Base and Electrolyte Disorders, McGraw Hill, New York, 2001, pp. 682-695.
- [61] B. D. Rose, “New Approach to Disturbances in the Plasma Sodium Concentration,” American Journal of Medicine, Vol. 81, No. 6, 1986, pp. 1033-1040. doi:10.1016/0002-9343(86)90401-8
- [62] D. W. Seldin and R. Tarail, “The Metabolism of Glucose and Electrolytes in Diabetic Acidosis,” Journal of Clinical Investigation, Vol. 29, No. 5, 1950, pp. 552-565. doi:10.1172/JCI102293
- [63] T. D. Dubose and L. Hamm, “Ketoacidosis,” In: T. D. Dubose and L. Hamm, Eds., Acid-Base and Electrolyte Disorders, Philadelphia, Saunders, Elsevier, 2002, pp. 67- 82.
- [64] M. Soleimani and G. Singh, “Physiologic and Molecular Aspects of the Na+/K+ Exchangers in Health and Disease Processes,” Journal of Investigative Medicine, Vol. 43, 1995, pp. 419-430.
- [65] R. D. Moore, “Stimulation of Na+/K+ Exchanger by Insulin,” Biophysical Journal, Vol. 33, 1981, pp. 203-210.
- [66] N. Glaser, P. Barnett, I. McCaslin, D. Nelson, et al., “Risk Factors for Cerebral Edema in Children with Diabetic Ketoacidosis,” The New England Journal of Medicine, Vol. 344, No. 4, 2001, pp. 264-249.
- [67] A. Durward, L. P. Ferguson, D. Taylor, et al., “The Temporal Relationship between Glucose corrected Serum Sodium and Neurological Status in severe Diabetic Ketoacidosis,” Archives of Disease in Childhood, Vol. 96, No. 1, 2011, pp. 50-57.
- [68] G. D. Harris, L. Fiordalisi, W. L. Harris, et al., “Minimizing Risk of Brain Herniation during Treatment for Diabetic Ketoacidemia: A Retrospective and Prospective Study,” Journal of Pediatrics, Vol. 117, No. 1, 1990, pp. 22-31.
- [69] H. Adrogue, J. Barrero and G. Eknoyan, “Salutary Effects of Modest Fluid Replacement in Treatment of Adults with Ketoacidosis,” JAMA, Vol. 262, No. 15, 1989, pp. 2108- 2013.
NOTES
*Corresponding author.