Open Journal of Civil Engineering
Vol.08 No.04(2018), Article ID:89392,11 pages
10.4236/ojce.2018.84038
Sixth Scale Model Studies of Masonry Arch Rib Behaviour at Different Eccentricities
Abbagana Mohammed1*, T. G. Hughes2
1Department of Civil Engineering, Abubakar Tafawa Balewa University, Bauchi, Nigeria
2School of Engineering, Cardiff University, Cardiff, UK

Copyright © 2018 by authors and Scientific Research Publishing Inc.
This work is licensed under the Creative Commons Attribution International License (CC BY 4.0).
http://creativecommons.org/licenses/by/4.0/


Received: August 30, 2018; Accepted: December 22, 2018; Published: December 25, 2018
ABSTRACT
This paper reports a validation study involving sixth scale masonry model to replicate prototype tests carried out on five unit high masonry prisms. In order to test the applicability of small masonry models to real life problems, an investigation into masonry behaviour relevant to the serviceability requirement of masonry arch bridges was chosen as prototype test to validate the small scale masonry tests. Only representative masonry specimens were considered in the study; this corresponded to parts of an arch ring in a complete masonry arch. Two mortar designations; designation iv and designation v were used. These weak mortars tend to conform better to existing old structures. Loads were applied at four eccentricities of 0, 5, 9, and 14 mm from the centre of the specimens. This corresponds to e/d ratios of 0, 0.14, 0.25, and 0.39, where e is the eccentricity of the load and d the length of the transverse section of the specimens. The result shows that validation study corresponds with prototype study for low eccentricities; therefore, strength enhancement is seen over the concentric compressive strength. However, this does not apply at higher eccentricities as specimens were noticed to fail by elastic instability characterised by tension debonding of the top mortar joint.
Keywords:
Masonry, Arch Bridge, Prototype, Eccentricity

1. Introduction
In order to test the applicability of small masonry models to real life problems, an investigation by Roberts et al. [1] into masonry behaviour relevant to the serviceability requirement of masonry arch bridges was chosen as prototype test to validate the small scale masonry tests by Mohammed [2].
In masonry arches, the arch barrel, which is the main structural component, carries the applied load principally through the induced axial compressive thrust. However, as traffic moves over the bridge, the arch barrel may also be subjected to significantly reversed bending and shear forces. This may result in the arch barrel being subjected to considerable cyclic stress ranges, which could affect the use of the bridge adversely [3].
Recently there has been interest in the establishment of serviceability limits for masonry bridges, BD 21/97 [4] and Boothby et al. [5]. In BD 21/97 (1997), it is suggested that the service load should be limited to 50% of the predicted ultimate load. This conclusion is based on the results of numerous large and full scale tests, which show that the load deflection response of masonry arch bridges remains approximately linear up to 50% of the ultimate load. However, because of the uncertainties in the material properties of masonry due to environmental effects, theoretical predictions of the ultimate loads of masonry arch bridges are usually not reliable [3].
In masonry arches the compressive force will generally be eccentric and in approaching failure; the force on some units will be highly eccentric and these forces will generally be concentrated on a small part of the surface area of the unit and form a so called hinge [6]. Various prototype studies [7] [8] have shown that the compressive stress at failure under eccentric loading is greater than under axial loading and further enhancement to the apparent compressive strength has been established under highly concentrated loads by other studies [6] [9].
Therefore, the main objective of the application study was to investigate the effect of eccentric concentrated loading on sixth scale masonry with a view to comparing it to the prototype study by using static tests as a tool for the understanding of the overall behaviour of masonry arches.
2. Materials and Methods
2.1. Masonry Specimens
Only representative masonry specimens were considered in the study, this corresponded to parts of an arch ring in a complete masonry arch. For the purpose of this study a five unit high, sixth scale masonry specimen as shown in Figure 1 was used. Two mortar designations; designation iv and designation v were used. These weak mortars tend to conform better to existing old structures. The proportions of the constituent elements used in the mortar are as given in BS 5628 [10] and the dry mass proportions in BS 4551 [11] were used and are shown in Table 1. All mortars were made using HST 95 sand. All the specimens were allowed to cure normally in the laboratory after preparation and tested at or shortly after 28 days of curing.
Other specimen formats were also used in the original study [1] , but for the purpose of the application study, only the five unit high stack bonded specimen was used. This was because the objective was to see if it was feasible to conduct such tests at sixth scale.
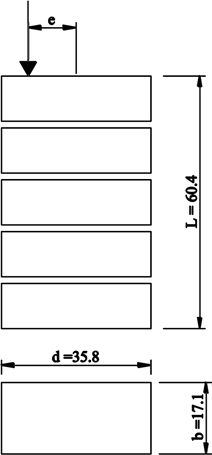
Figure 1. Dimensions of specimens in mm.

Table 1. Mortar proportions.
2.2. Tests
Testing was carried in a 20 kN capacity testing machine under constant rate of displacement of 0.25 mm/min. Load was applied via an arrangement of 6 mm steel plates and 6mm steel bars as shown in Figure 1. The specimens were also supported on similar arrangement of plates and bars as used in applying the loads in order to ensure uniform eccentricity from the centre of the specimens. Loads were applied at four eccentricities of 0, 5, 9, and 14 mm from the centre of the specimens. This corresponds to e/d ratios of 0, 0.14, 0.25, and 0.39, where e is the eccentricity of the load and d the length of the transverse section of the specimens as defined in Figure 1. Test set up for the e/d ratio = 0.25 is shown in Figure 2.
2.3. Calculation
The assumed stress blocks used in calculations are shown in Figure 3. For concentric and eccentric loading within the middle third of the section the stress distribution is as shown in Figure 3(a). In this case the maximum compressive
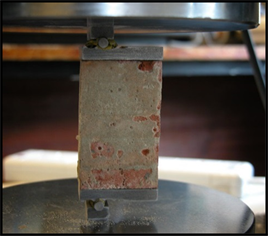
Figure 2. Set up of model test at an eccentricity of 0.25.
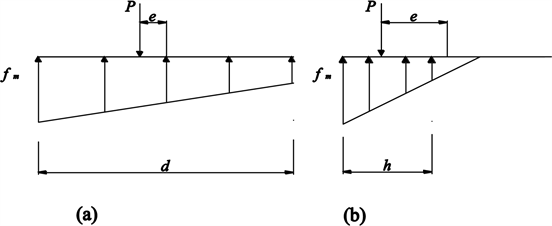
Figure 3. Assumed stress distributions for eccentric loading (a) no tension (b) linear cracked.
stress is given by (1)
(1)
where P is the applied compressive force and bd is the loaded cross-section area (width × depth).
When the eccentricity of load is beyond the middle third of the cross-section the cracked triangular stress block in Figure 3(b) was assumed. For this distribution, equilibrium of external and internal forces entails that Equations (2) and (3) applies
(2)
(3)
Substituting for P in (3) gives (4) and (5)
(4)
(5)
The cracked triangular no tension distribution was chosen for this solution because it gave an upper bound solution rather than the cracked parabolic no tension distribution (not presented here).
3. Discussion of Results
In the prototype test failure of the specimens was initiated by crushing and squeezing of the mortar from the mortar joints followed by vertical splitting of the bricks as shown in Figure 4.
Figure 5 and Figure 6 show the variation of compressive strength with load eccentricity for mortar designation v. Both of the figures show that the compressive strength is increased as the eccentricity is increased in line with findings by most authors, notably Page and Hendry [12] who have even suggested design rules for concentrated loads with varying eccentricities on masonry. The reason for the enhancement as suggested by Drysdale and Hamid [7] is due to the strain
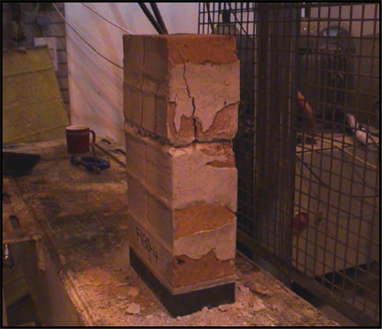
Figure 4. Typical failure pattern in prototype tests.
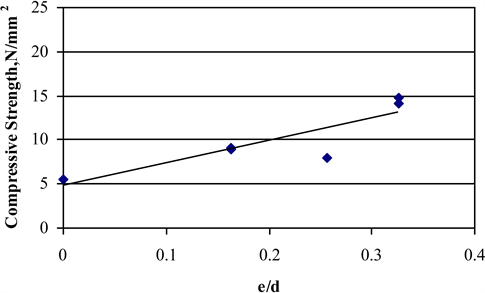
Figure 5. Variation of compressive strength with e/d ratio for prototype test 1.
gradient effect on the compressive strength. They argued that the gradient of vertical compression strain across a brick due to eccentricity of a load will be accompanied by a corresponding tensile strain gradient in the lateral direction. But because the tensile strength of masonry units are affected by strain gradient (as shown by the greater flexural tensile strength in comparison to the direct axial tensile strength), they concluded that the apparent compressive strength should be higher for eccentrically loaded brickwork.
Typical failure of the specimens in the model study was usually characterised by vertical splitting cracks under the load point as well as at the sides of the specimens. This was followed by crushing of the loaded point in some cases. Figure 7 shows a typical failure in one of the tests. In the case of the specimens with e/d of 0.39 there were cases in which tension debonding was noticeable at the edge furthest from the load point just before failure, in specimens made with both designation iv and designation v mortar. Figure 8 shows the debonding on the tensile side in one of the tests. This type of failure represents an elastic instability
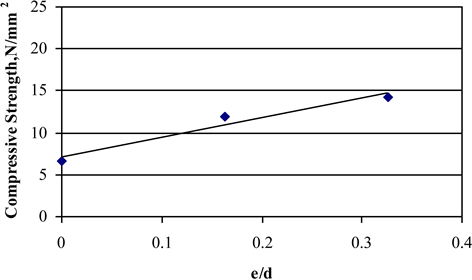
Figure 6. Variation of compressive strength with e/d ratio for prototype test 2.
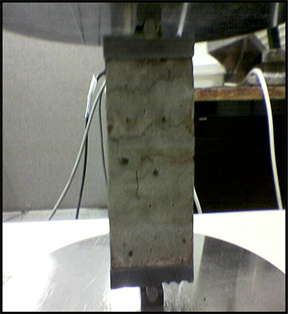
Figure 7. Typical failure pattern in model tests.
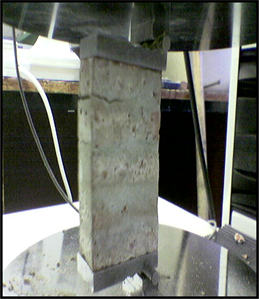
Figure 8. Bond failure in top bed joint of model specimen at e/d of 0.39.
characterised by debonding on the tensile side for loads with high eccentricity according Sahlin [13].
The results as tabulated in Table 2 and Table 3 for tests using mortar designations iv (test; S4) and v (test; S5) show a mixed picture as seen in Figure 9 and Figure 10, which show the variation of maximum compressive strength with e/d ratio for tests using mortar designations iv and v, respectively. In Figure 9, it is seen that there is an initial increase in strength from the point of zero eccentricity to point e/d = 0.14. Followed by a decrease in strength from this point up to the last point e/d = 0.39. While in Figure 10, there is an increase in strength from the point of zero eccentricity up to the point e/d = 0.25 before decreasing at the last point e/d = 0.39. Therefore, as seen from the trend lines in both figures there is only a marginal increase in compressive strength as the eccentricity is increased for the eccentricities considered (neglecting e/d = 0.39). But the actual compressive strength in the model tests was higher because of the higher model unit compressive strength, which is about 57% higher than the prototype unit strength.
Figure 11 shows a comparison of the effect of eccentricity in the prototype and model scale for the same mortar type. The vertical axis has been made dimensionless by normalising it with respect to their (both prototype and model) respective compressive strengths at zero eccentricity. It is seen from the figure that the fitted trend line for the prototype test is significantly steeper than that for the model test. The ratio of their gradients is 5.4 which is nearly equal to their scale ratio. From the foregoing, it therefore seems that in the S4 model test for e/d ratios of 0.25 and 0.39 (outside the middle third of the section), the expected enhancement in compressive strength is not seen while in the S5 model test strength enhancement does not hold for the e/d of 0.39. However, since in the prototype tests the highest eccentricity used was 0.33 it can still be argued that there is some agreement of the S5 test to the prototype test since there is strength increase with load eccentricity within their comparable range of eccentricities. The reason for the greater enhancement in the prototype over the model scale is not certain, but it could to be due to the elastic instability characterised by the cracking on the tension side of the model specimens before material failure in the units. But since the geometries of the test specimens and load eccentricities for the prototype and model tests are similar, the expectation was for a comparable enhancement factor in the model test. It therefore seems that there is better agreement between the failure mechanics of prototype and model specimens in axial compression than in eccentric loading. This may be because it is difficult to model mortar at very small scales because of the thinness of the joints. Because as reported by Mohammed et al. [14] effects with regards to joint thickness are difficult to model at sixth scale. The reason for this is not certain but it offers a possible area of further investigation in the future.
Table 2. Test results for specimens made with designation iv mortar, S4, with COV in brackets.
Table 3. Test results for specimens made with designation v mortar, S5, with COV in brackets.
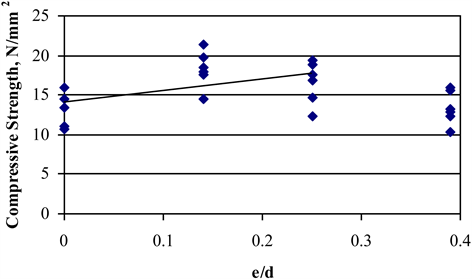
Figure 9. Variation of stress at failure with e/d ratio for S4 specimens.
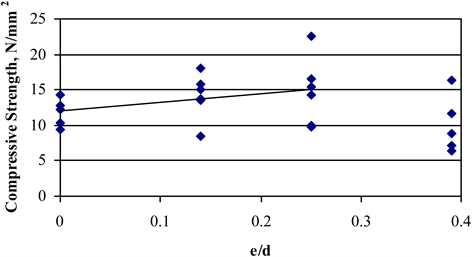
Figure 10. Variation of compressive strength with e/d ratio for S5 specimens.
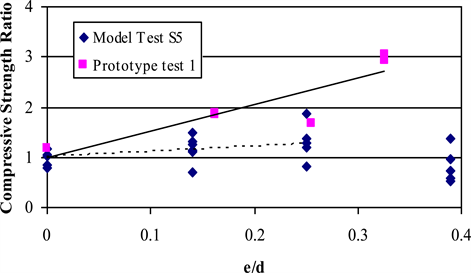
Figure 11. Comparison of the effect of eccentricity in prototype and model test.
4. Conclusion
The application study somewhat agrees with the prototype study for low eccentricities; therefore, strength enhancement is seen over the concentric compressive strength. However, this does not apply at higher eccentricities as specimens were noticed to fail by elastic instability characterised by tension debonding of the top mortar joint.
Conflicts of Interest
The authors declare no conflicts of interest regarding the publication of this paper.
Cite this paper
Mohammed, A. and Hughes, T.G. (2018) Sixth Scale Model Studies of Masonry Arch Rib Behaviour at Different Eccentricities. Open Journal of Civil Engineering, 8, 533-543. https://doi.org/10.4236/ojce.2018.84038
References
- 1. Roberts, T.M, Hughes, T.G. and Dandamudi, V.R. (2004) Progressive Damage to Masonry Arch Bridges Caused by Repeated Traffic Loading—Phase 2. Cardiff University, Cardiff.
- 2. Mohammed, A. and Hughes, T.G. (2011) Prototype and Model Masonry Behaviour under Different Loading Conditions. Materials and Structures, 44, 53-65. https://doi.org/10.1617/s11527-010-9608-6
- 3. Roberts, T.M., Hughes, T.G. and Goutis, G. (2003) Progessive Damage to Masonry arch Bridges Caused by Repeated Traffic Loading. Cardiff University, Cardiff.
- 4. Department of Transport (1997) BD 21/97 Design Manual for Roads and Bridges. Vol. 3: Sect 4: Part 3: The Assessment of Highway Bridges and Structures.
- 5. Boothby, T.E, Domalik, D.E. and Dalal, V.A., (1998) Service Load Response of Masonry Arch Bridges. Journal of Structural Engineering, 124, 17-23. https://doi.org/10.1061/(ASCE)0733-9445(1998)124:1(17)
- 6. Hendry, A.W. (1990) Masonry Properties for Assessing Arch Bridges. Transport and Road Research Laboratory.
- 7. Drysdale, R.C. and Hamid, A.A. (1982) Effect of Eccentricity on the Compressive Strength of Brickwork. Journal of British Ceramic Society, 30,140-48.
- 8. Martinez, J.L, Martin-Caro, J.A. and Leon, J. (2004) Masonry Compressive Strength Enhancement under Eccentric Axial Load. Arch Bridges IV, Barcelona.
- 9. Arora, S.K. (1988) Performance of Masonry Walls under Concentrated Load. Proceedings of the British Masonry Society, No. 2, London.
- 10. British Standards Institution (1995) Code of Practice for Use of Masonry: Part 2: Structural Use of Unreinforced Masonry. B.S.I, BS 5628, London.
- 11. British Standards Institution (1998) Part 1: Methods of Testing Mortars, Screeds and Plasters. 1998, B.S.I, BS 4551, London.
- 12. Page, A.W. and Hendry, A.W. (1988) Design rules for Concentrated Loads on Masonry. The Structural Engineer, 66, 273-281.
- 13. Sahlin, S. (1971) Structural Masonry. Prentice-Hall, Upper Saddle River.
- 14. Mohammed, A., Hughes, T.G. and Mustapha, A. (2011) The Effect of Scale on the Structural Behaviour of Masonry under Compression. Construction and Building Materials, 25, 303-307. https://doi.org/10.1016/j.conbuildmat.2010.06.025