Theoretical Economics Letters
Vol. 2 No. 2 (2012) , Article ID: 19294 , 6 pages DOI:10.4236/tel.2012.22033
Education and Electoral Outcomes
1Bayesian and Interdisciplinary Research Unit, Indian Statistical Institute, Kolkata, India
2NSHM Business School, Kolkata, India
Email: *digantam@hotmail.com, rajlakshmi.mallik@gmail.com
Received January 10, 2012; revised February 6, 2012; accepted February 15, 2012
Keywords: Election; Education; Party Image; Candidate Efficiency; Macro vs Local Concerns
ABSTRACT
This paper develops a model of the electoral process for analyzing the voters’ choice faced with two parties. A typical voter is concerned with both local governance issues and macro issues. The relative importance attached by a voter to local and macro concerns is governed by the level of education of the voter. The voter must exercise his choice based on two sets of information—the first pertains to the candidate’s efficiency level and the other pertains to the efficiency of the party as a whole. The model focuses on the case where the party with the better image has been forced to put up a less efficient candidate, as this is sufficient to analyse the trade-off involved. The model shows how the election outcomes may be influenced by the education level of the electorate and the design of election campaigns. This has implications for the design of education policy in the long run and measuring social efficiency of education.
1. Introduction
There exists a large literature documenting the private returns to education. In addition, education also creates non-monetary benefits to society. An important example of the positive externality of education is enlightened political behavior. Social scientists argue that a more educated electorate enhances the quality of democracy ([1] and others). Such benefits of education accrue through enhanced quality of participation as well as higher range of participation. In the first, education equips citizens with increased ability to select able leaders, understand the issues upon which to vote and act as a critique. There are several theoretical models which suggest a link between education and civic participation. See [2,3] among others. This is difficult to investigate empirically as objective measures of “quality of decisions” is hard to find. Our paper focuses on this aspect from a novel theoretical perspective.
The second channel is through an increased interest in political issues and higher involvement in the process (see [4]). Reference [5] provides a very interesting empirical verification of this in the context of the UK and USA. To assess the empirical estimates of the effect of education on social and political participation, [6] performs a meta-analysis, synthesizing 268 evaluations on social participation. The means of the study weighted population effect sizes are 0.055 for social participation per year of schooling (p-value < 0.001) after correcting for publication bias. Through further analysis they confirm the existence of a relative effect of education on participation.
The uninterrupted left wing political rule in West Bengal, a state in India, for over three decades has been at the centre stage of debate among social scientists and policy makers in recent years. It has acted as a catalyst for a whole range of new issues and questions being asked and is being cited as an iconic example to prove and illustrate myriad theories and hypotheses. Among the issues that have already been addressed in this context is the question: what are the possible reasons—economic, political, anthropological, sociological, historical, cultural or ideological—that enabled the party to stay in power through voters’ mandate in spite of the at best moderate performance of the government in terms of public finance and several socio-economic indicators.1 One of the commonly cited reasons for this is the party’s design of education policy and delivery mechanism with its thrust on basic education and universal literacy while diluting the quality of higher education.
The question that we specifically address in this paper is the following: what would be the electorate’s mandate faced with two candidates, one from each party, based on candidates’ individual efficiency and the perceived average efficiency of the party. If suffices to consider a situation where the more efficient candidate is from the party with lower average efficiency (and the reverse scenario by analogy). The other cases where both individual and party efficiencies are low of high simultaneously will lead to obvious outcomes.
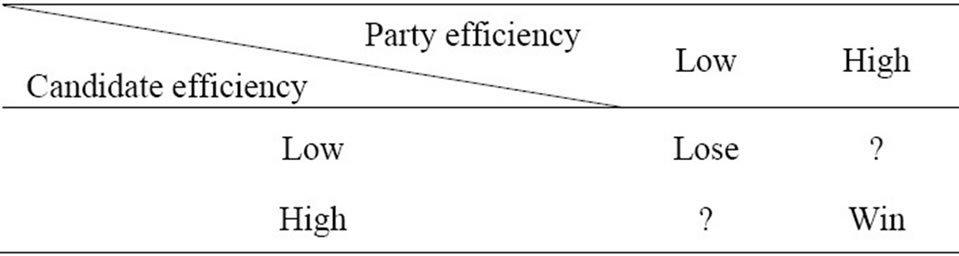
Such an analysis will help to predict the likely outcome of an electoral process and also have important implications for the campaigning strategy of a party.
The plan of the paper is as follows. Section 2 sets up the model of voting that is influenced by several concerns which in turn are affected by education level of the voter. Section 3 details the choice problem of an individual voter while Section 4 discusses the aggregation issue and several policy and strategic considerations. We briefly comment on the implications of our model in a multi-tier democracy in Section 5. Finally, Section 6 concludes.
2. The Model
We consider a set up with two political parties 1 and 2, whose average efficiencies are  and
and  respectively. The two contesting candidates representing the two parties have efficiency levels
  and
and  respectively. Our focus is on the electoral process within a constituency.
  are all exogenously given and are public information. We do not consider the case of “ideological beliefs” where in a voter affiliation to a party is dogmatic rather than based on practical and governance concerns.2
A voter deciding on the candidate of choice considers two factors. One, the efficiency of local governance which directly impacts the quality of his/her daily life; through factors such as regularity and quality of water supply, cleanliness, law and order etc. This depends more on the candidate’s individual efficiency and less on the efficiency of the party. The second factor on the other hand reflects the efficiency of the party at the national or state level. National security concerns, foreign policy, investments, trade policy, law and order situation, public finance, tax policy, interest rates, employment scenario, inflation and growth rate, monetary and fiscal policy—all these affect a voter’s quality of life indirectly. We refer to these as macro issues or concerns, as opposed to the local governance concerns.
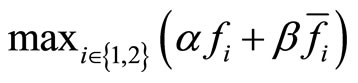
Now, an individual voter will factor in both local as well as macro concerns when deciding on the candidate of his choice. Denoting by α and β the weights  attached to local governance and macro concerns by a voter, the voter’ decision will be given by:
 (1)
(1)
Thus a voter, given his α and β, will vote for the candidate i = 1 or 2 for whom  is greater. We assume, for the sake of simplicity, that everybody votes.
The importance attached to local governance issues and macro concerns, i.e. α and β depend on the education level e. normalized in the interval [0,1], of a person. With more education, a voter is likely to become more aware of his civic, social, political and legal rights (such as right of access to health services, clear water supply, electricity, roads and secure environment etc.) as also issues of public concern at international, national and state level (child labour, mobility of labour, nuclear non-proliferation etc.). However, while even an illiterate person will have a minimum awareness of his rights (personal security concerns such as whether it is safe to walk down the neighbourhood without being mugged, being forced to pay bribe to local musclemen for running any business, water supply, electricity etc.), concerns about national issues will require a minimum level of education and exposure. So it is reasonable to expect that only a well educated person (with ) will have a positive β.
Further we assume that concern for macro issues increases at a faster rate than local concerns. This is justified on the grounds that in this era of globalization and information technology higher education and exposure brings geographical mobility. Thus while β > 0 only above a threshold level of education, it reaches its maximum value of 1 at a relatively lower level of education than does α. As local issues usually involve more minute details, the awareness reaches its maximum only at the highest level of education.3
Accordingly we consider the following two functional forms representing the behavior of individual voter’s concern with local and macro issues with an increase in the level of education
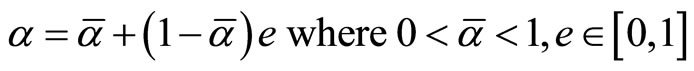 (2)
(2)
and
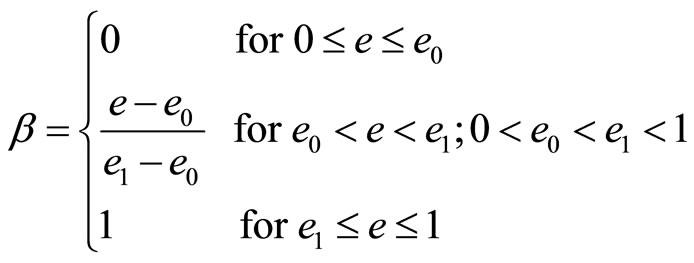 (3)
(3)
Figure 1 below illustrates the α and β functions as in
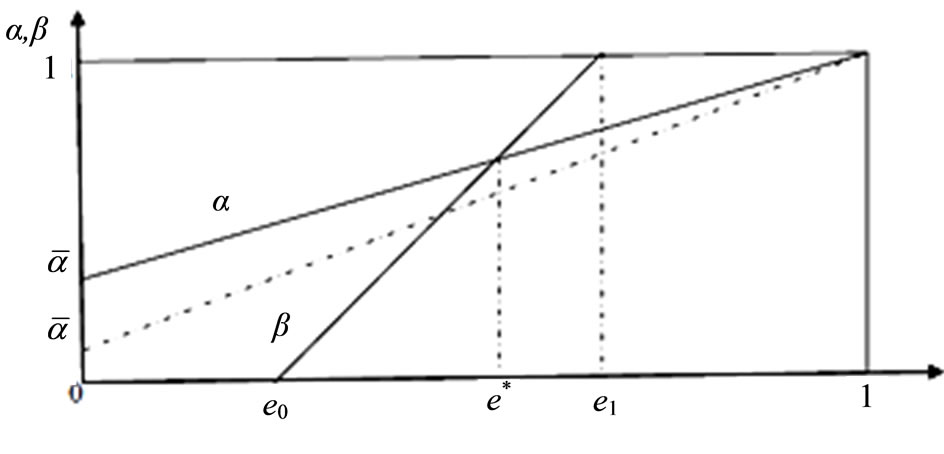
Figure 1. Shape of the functions α and β.
(2) and (3).
3. The Mandate
3.1. Choice by Individual Voter
Without loss of generality we assume . A voter will vote for candidate 1 if and only if
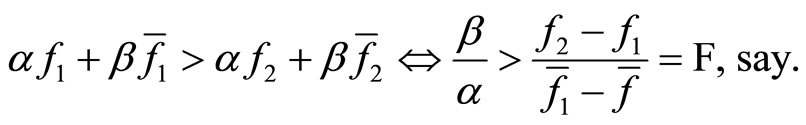 (4)
(4)
This has interesting implications.
1) Suppose the difference between the individual efficiency levels of the candidates is stronger than the difference in party images, i.e.
 .
.
Then a voter will vote for candidate 1, that is vote to power the less efficient candidate from the party with a better image, if 1) voter’s global or macro concerns dominate local concerns (β > α) and 2) the importance of global concern vis-à-vis local concern is much stronger than the individual efficiency difference vis-à-vis party image difference .
.
2) The outcomes will be similar if
 .
.
3) If however the difference in candidates’ individual efficiency levels is less marked compared to the difference in party image (F < 1), then candidate 1 will be voted to power irrespective of whether voters are more concerned with macro issues or local governance issues (β> or <α) as long as .
.
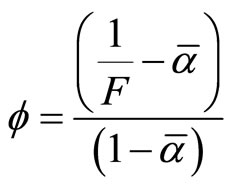
3.2. The  Function
We now consider the implications of how educated a society is, for the election mandate. Figure 2 below shows the behaviour of the ratio  with increase in the level of education, e, for an individual voter.
Let
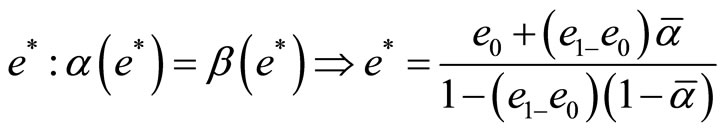 . (5)
. (5)
Using the above definition of e* and Equations (2) and
(3) we observe that  Further since
  and
and  for
for , so
, so  in that range. Between e0 and e*,
  and increasing in e as
  in that range (so that slope of expression in the numerator = 1 >
  = slope of expression in the denominator).
Beyond e*,  but the relationship between
  and e is non-monotonic.
  increases with e up to e1 and reaches its maximum value,
  , where β attains its maximum value (=1). In this range, that is for
 , α < 1 and increasing in e.
Thus  (as denominator is < 1).
Beyond e1,  decreases as β is constant and α is increasing.
Summarising, the  function may be specified as follows
 (6)
(6)
3.3. The Electorates’ Choice
Case I: We first consider the case
 .
.
In this case, irrespective of the level of education, all the voters will vote for candidate 2, the more efficient candidate from the party with a poorer image. Thus if the difference between the candidates’ efficiency levels is too high then the voters will vote for the candidate rather than the party irrespective of the weights they attach to local and global concerns.
When , then both the candidates will be securing some votes. An individual voter’s choice will depend on their respective weights on local and macro concerns which in turn depend on their education level. Thus now the voters will be segmented by their educations levels.
Case II: F = 1 When the difference in individual candidates’ efficiency level match the difference in party images , then less educated people with
  will vote for the more efficient candidate as for them local concerns dominate macro concerns; whereas more educated people with
 , who are guided more by macro concerns will vote for the more efficient party.
Case III: F < 1 If the differences in candidates’ public image is less marked than differences in party image
 , the less educated people would continue to vote for the more efficient candidate; while the more educated would continue to vote for the party of choice and hence candidate 1. The proportion of people voting in favour of the more efficient candidate will however dwindle as the difference between candidates’ personal efficiency levels start falling. So only those with very strong local concern will vote for the more efficient candidate. Specifically all voters with
  will vote for candidate 1where

which upon simplification yield
 . (7)
. (7)
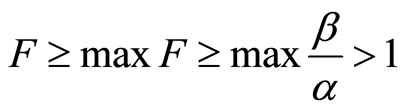
Case IV: 
We finally consider the most interesting case where difference in candidates’ efficiency levels is more marked that the difference in party images, but it is less than
 . Here we have the following proposition Proposition 1: If
  then there will exist two discontinuous intervals of education such that all voters with
  will vote for the more efficient candidate 2, while voters with
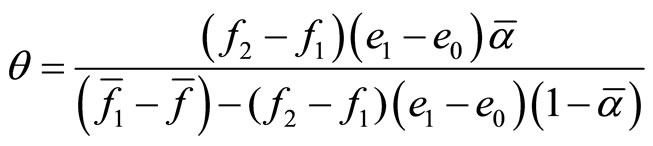
  will vote for the candidate 1 from the more efficient party. Here θ is as defined above and
 (8)
(8)
Proof: A horizontal line at level F on the vertical axis in Figure 2 must intersect the  curve at e > e*. Since the
  curve is inverted U-shaped to the right of e*reaching a maximum value at e1, therefore the line must intersect the curve at two points, one to the left and the other to the right of e1.
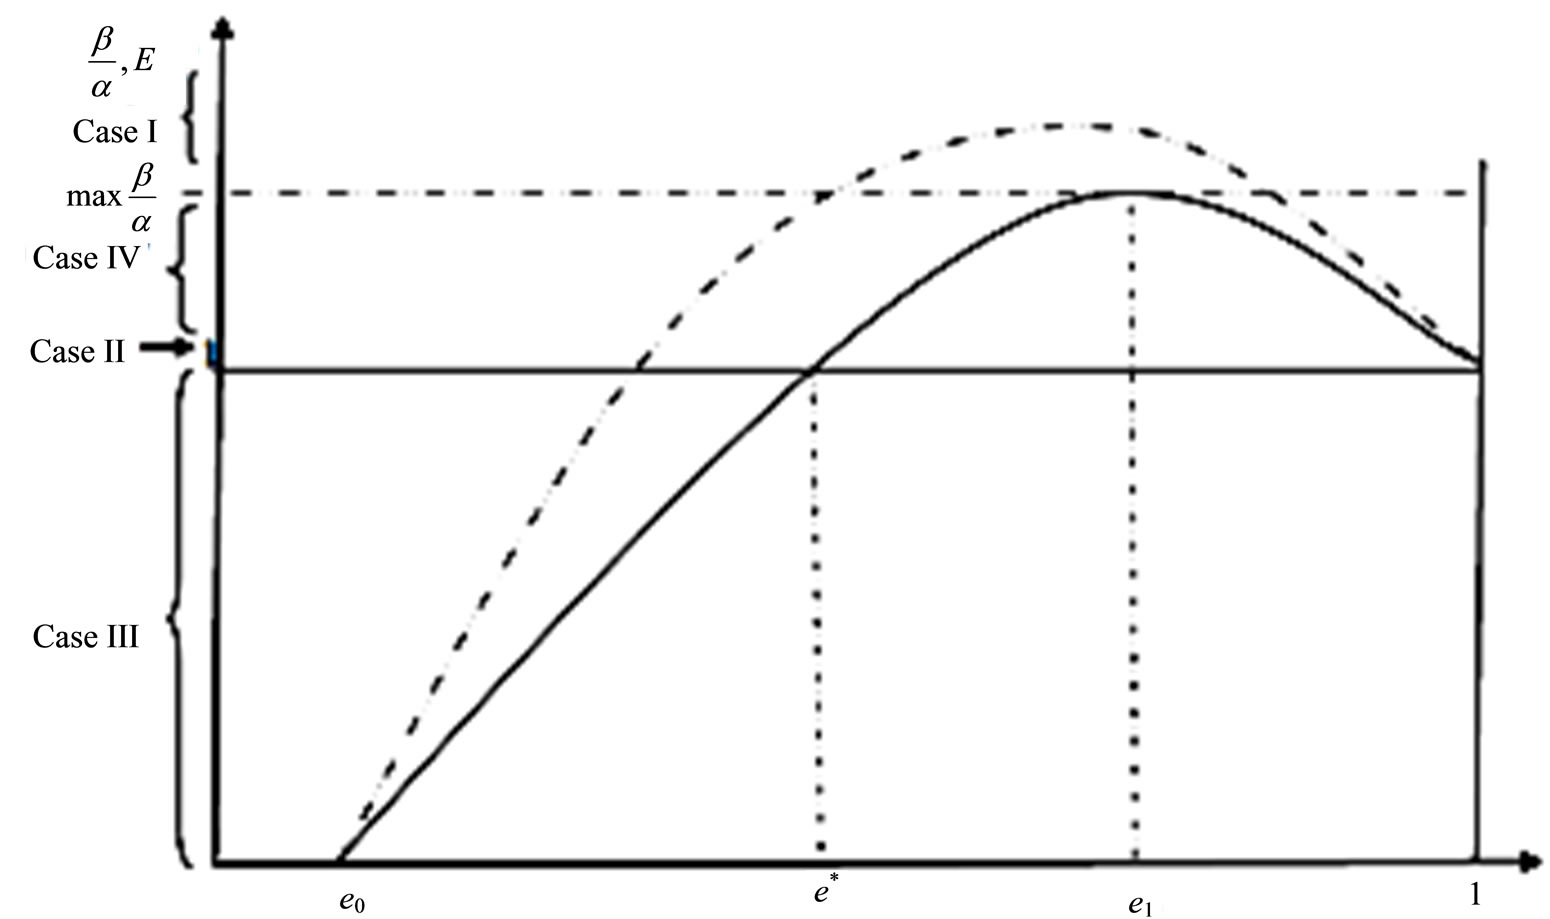
Figure 2. Candidate choice by individual voters.
For e < e1, i.e. ,
,  at e = θ; and for
 ,
,  at e =
  where
where  can be solved from the relation
 .
.
Thus we have  while
while
 . n Thus the highly educated and least educated voters will vote for the more efficient candidate 2, while there will be middle segment with moderate education who will vote for the party of choice rather than the candidate.
Concern with national or macro issues saturate beyond a point. So for the very highly educated, macro concerns, while important, can no longer assume further importance. Concern with local governance issues and rights, although less important than macro concerns, get progressively greater attention as education level increases. Thus there will be a segment among the highly educated aware mass along with the usual less educated mass who will vote for the more efficient candidate rather than the more efficient party.
4. The Distribution of Population by Education
Our findings so far reveal that the level of education of the electorate affect the election outcome. One may expect the density function of education to be downward sloping, with the proportion of population with a given level of education diminishing with the level of education.
The total support for candidate 1 would be given by
 , where g(e) is the density function for the distribution of population by education. Denoting by
  the median level of education we state the following proposition.
Proposition 2: a) The necessary condition for the party with better image (party 1) to win the election is that e0, that is the minimum level of education for awareness and concern about national issues4, is lower than the median education level , i.e.
 .
.
b) Assuming  and F < 1, the necessary and sufficient condition for party 1 to win is
 .
.
Proof: 1) If , then party 2 with poorer image but with stronger candidate always wins. Hence the result follows by complementation.
2) Party 1 will win election iff . n As mentioned earlier, education ha social benefits along with private ones; one particular instance of this being an improvement in electoral choices. Proposition 2(b) highlights one such scenario where a high enough median education level dictates that the more efficient party wins election. Thus we can create a benchmark for political returns to education where, irrespective of individual local candidates’ prowess, the electorate actually favours the party that will be beneficial at the macro level.
4.1. Education Policy and Election Outcomes
Any education policy that has an effect on the education of the medial voter will have an effect on the share of votes for each party. Election outcome depends upon whether the change is significant enough to make  cross over e0. An increase in
  is likely to drive the election results in favour of party with better public image even though its candidate is relatively less efficient.
So question arises whether an education policy targeting primary and secondary education or promoting college and higher education would be beneficial for the party with favourable public image. In a country where a vast majority of the population have received only primary education, the universalisation of primary education (SSA) would be conducive to party 2 emerging victorious as this would have little impact on . However a policy to promote secondary and college education would be crucial in effecting the switch—as a large number of literates gets converted to graduates, the proportion of voters with less than secondary education falls below 50%,
  must cross over e0. Again promoting postgraduate education is less effective in achieving an increase in
 .
.
4.2. Election Campaign Strategy and Education Level of Electorate
We now make some comments on the campaign strategy of the two political parties. The strategy could involve either promoting the individual candidates or the party image as a whole, without emphasizing the individual candidate. These will affect the perceived values of  and thus the ratio F. A low F is favourable for party 1 while a high F is favourable for party 2. The party with the stronger candidate should design a candidate oriented campaign strategy. On the other hand party with better public image should focus on highlighting the party performance rather than the candidate. Thus each party focuses on highlighting its stronger point irrespective of the education level of the electorate.
5. Higher Levels of Election
In this section we briefly discuss the implications of our study, for outcomes of electoral process at different levels—local elections (for Panchayat or Municipality), state level elections (for the Legislative Assembly) or the general elections (Parliament). With an increase in the level of election the direct role of the elected representative in local affairs diminishes. The representative is now more involved with policy making and broader governance issues which are likely to affect a larger population in multiple locations (where we refer to the electoral constituency as the locality).
From the electorates’ point of view the weight attached to local governance issues, i.e. α(e), (which is dependent on the candidate’s individual efficiency) becomes similar to β(e) irrespective of the level of their education. This is because the candidate’s personal efficiency now matter more for issues that are broad based. We envisage this as a decrease in . This will imply that the slope of α(e) increases as
  at e = 1.
Accordingly  will be attained at a lower value of e, i.e. e* will fall, while
  will increase. In terms of Figure 2 we observe that the
  curve will shift upwards and to the left as shown by the dotted line. The shift will be favourable for party 1 as support for candidate 1 will increase. So a situation may arise where a party with high level of efficiency loses a local election while winning the general election.
6. Conclusions
This paper develops a model of the electoral process for analyzing the voters’ choice faced with two parties. A typical voter is concerned with both local governance issues which directly affect his quality of life and more general or macro issues with national or state level implications. The impact of the latter on quality of life of an individual voter is indirect, compared to local issues. The relative importance attached by a voter to local and macro concerns is to a large extent governed by the level of education of the voter. The voter must exercise his choice based on two sets of information—the first pertains to the candidate’s efficiency level and the other pertains to the efficiency of the party as a whole (the average efficiency of all the party members). The model focuses on the case where the party with the better image has been forced to put up a less efficient candidate, as this is sufficient to analyse the trade-off involved.
The model provides some interesting insights regarding possible election outcomes. Specifically it shows how the election outcomes may be influenced by the education level of the electorate and the design of election campaigns. This has implications for the design of electoral campaign strategy in the short run and that of education policy in the long run. Thus education has social benefits over and above the private return and Pigouvian subsidies for education will increase efficiency.
REFERENCES
- M. Friedman, “Capitalism and Freedom,” University of Chicago Press, Chicago, 1962.
- S. Verba and N. H. Nie, “Participation in America: Political Democracy and Social Equality,” Harper and Row, New York, 1972.
- T. J. Feddersen and W. Pesendorfer, “The Swing Voter’s Curse,” American Economic Review, Vol. 86, No. 3, 1996, pp. 408-424.
- E. Hanushek, “Publicly Provided Education,” In: A. Auerbach and M. Feldstein, Eds., The Handbook of Public Economics, Elsevier, Amsterdam, Vol. 3, 2002, pp. 2015- 2141.
- K. Milligan, E. Moretti and P. Oreopoulos, “Does Education Improve Citizenship? Evidence from the United States and the United Kingdom,” Journal of Public Economics, Vol. 88, No. 9-10, 2004, pp. 1667-1695. doi:10.1016/j.jpubeco.2003.10.005
- J. Huang, H. M. van den Brink and W. Groot, “A Meta-Analysis of the Effect of Education on Social Capital,” Economics of Education Review, Vol. 28, No. 4, 2009, pp. 454-464. doi:10.1016/j.econedurev.2008.03.004
- P. Datta, “Devolution of Financial Power to Local Self-Governments: The ‘Feasibility Frontier’ in West Bengal,” South Asia Research, Vol. 27, No. 1, 2007, pp. 105-124. doi:10.1177/026272800602700106
NOTES
*Corresponding author.
1For a survey on the issues and discussions, see [7] and the references cited therein.
2This possibility may be incorporated by assuming  with
with  remaining finite.
3Assuming β = 1 for  is sufficient for a simple presentation of our results but it is not necessary. The results remain qualitatively unchanged if we only assume that β rises faster than α and
  for e above some critical value.
4We could identify this population as those reading newspapers or following national news on Television.