Paper Menu >>
Journal Menu >>
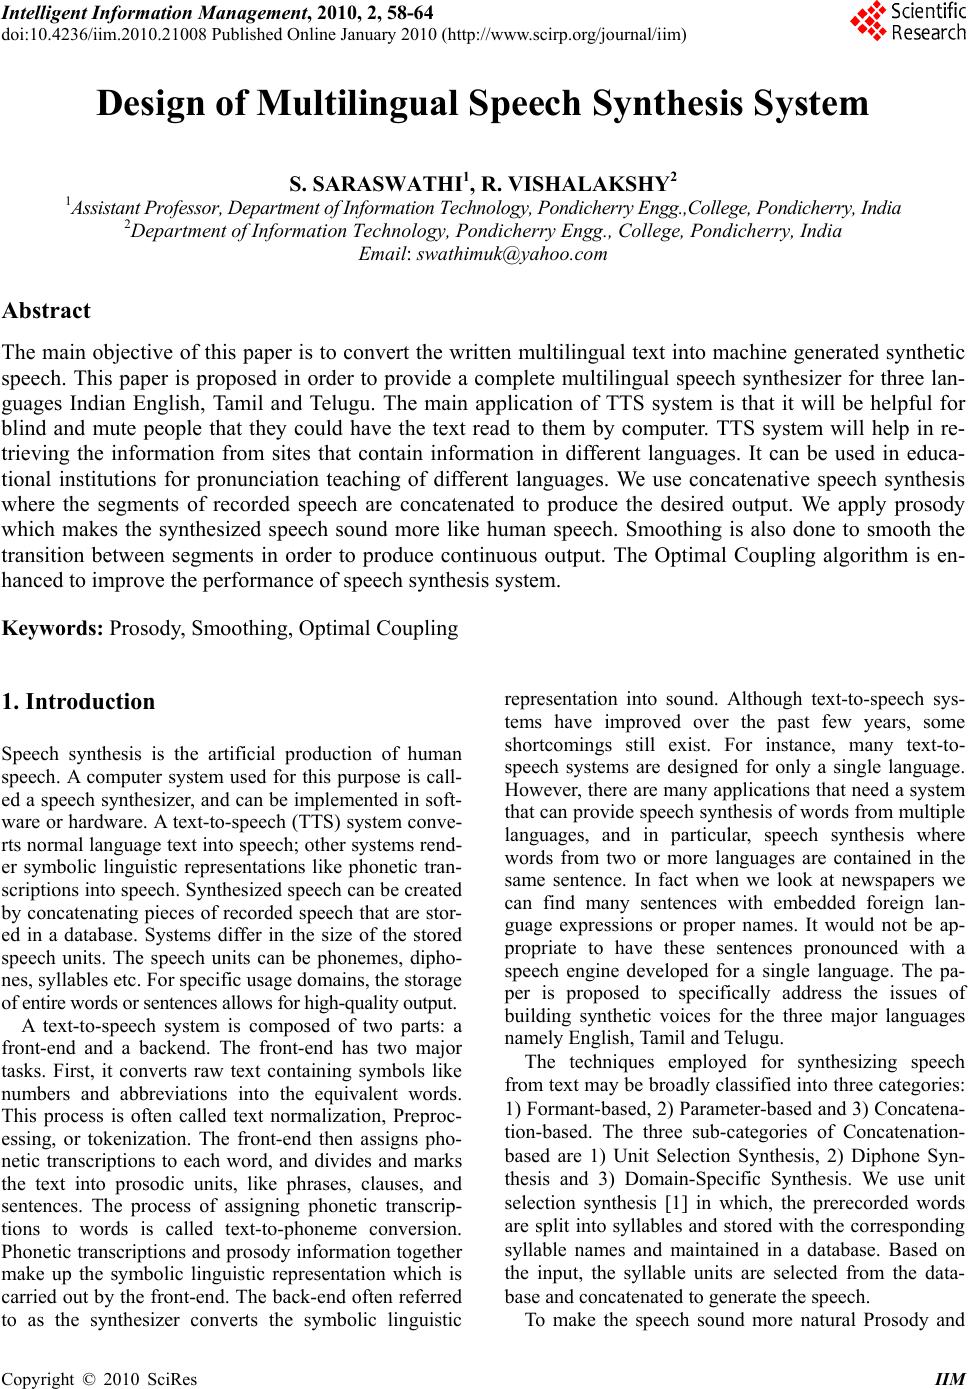 Intelligent Information Management, 2010, 2, 58-64 doi:10.4236/iim.2010.21008 Published Online January 2010 (http://www.scirp.org/journal/iim) Copyright © 2010 SciRes IIM Design of Multilingual Speech Synthesis System S. SARASWATHI1, R. VISHALAKSHY2 1Assistant Professor, Department of Information Technology, Pondicherry Engg.,College, Pondicherry, India 2Department of Information Technology, Pondicherry Engg., College, Pondicherry, India Email: swathimuk@yahoo.com Abstract The main objective of this paper is to convert the written multilingual text into machine generated synthetic speech. This paper is proposed in order to provide a complete multilingual speech synthesizer for three lan- guages Indian English, Tamil and Telugu. The main application of TTS system is that it will be helpful for blind and mute people that they could have the text read to them by computer. TTS system will help in re- trieving the information from sites that contain information in different languages. It can be used in educa- tional institutions for pronunciation teaching of different languages. We use concatenative speech synthesis where the segments of recorded speech are concatenated to produce the desired output. We apply prosody which makes the synthesized speech sound more like human speech. Smoothing is also done to smooth the transition between segments in order to produce continuous output. The Optimal Coupling algorithm is en- hanced to improve the performance of speech synthesis system. Keywords: Prosody, Smoothing, Optimal Coupling 1. Introduction Speech synthesis is the artificial production of human speech. A computer system used for this purpose is call- ed a speech synthesizer, and can be implemented in soft- ware or hardware. A text-to-speech (TTS) system conve- rts normal language text into speech; other systems rend- er symbolic linguistic representations like phonetic tran- scriptions into speech. Synthesized speech can be created by concatenating pieces of recorded speech that are stor- ed in a database. Systems differ in the size of the stored speech units. The speech units can be phonemes, dipho- nes, syllables etc. For specific usage domains, the storage of entire words or sentences allows for high-quality output. A text-to-speech system is composed of two parts: a front-end and a backend. The front-end has two major tasks. First, it converts raw text containing symbols like numbers and abbreviations into the equivalent words. This process is often called text normalization, Preproc- essing, or tokenization. The front-end then assigns pho- netic transcriptions to each word, and divides and marks the text into prosodic units, like phrases, clauses, and sentences. The process of assigning phonetic transcrip- tions to words is called text-to-phoneme conversion. Phonetic transcriptions and prosody information together make up the symbolic linguistic representation which is carried out by the front-end. The back-end often referred to as the synthesizer converts the symbolic linguistic representation into sound. Although text-to-speech sys- tems have improved over the past few years, some shortcomings still exist. For instance, many text-to- speech systems are designed for only a single language. However, there are many applications that need a system that can provide speech synthesis of words from multiple languages, and in particular, speech synthesis where words from two or more languages are contained in the same sentence. In fact when we look at newspapers we can find many sentences with embedded foreign lan- guage expressions or proper names. It would not be ap- propriate to have these sentences pronounced with a speech engine developed for a single language. The pa- per is proposed to specifically address the issues of building synthetic voices for the three major languages namely English, Tamil and Telugu. The techniques employed for synthesizing speech from text may be broadly classified into three categories: 1) Formant-based, 2) Parameter-based and 3) Concatena- tion-based. The three sub-categories of Concatenation- based are 1) Unit Selection Synthesis, 2) Diphone Syn- thesis and 3) Domain-Specific Synthesis. We use unit selection synthesis [1] in which, the prerecorded words are split into syllables and stored with the corresponding syllable names and maintained in a database. Based on the input, the syllable units are selected from the data- base and concatenated to generate the speech. To make the speech sound more natural Prosody and 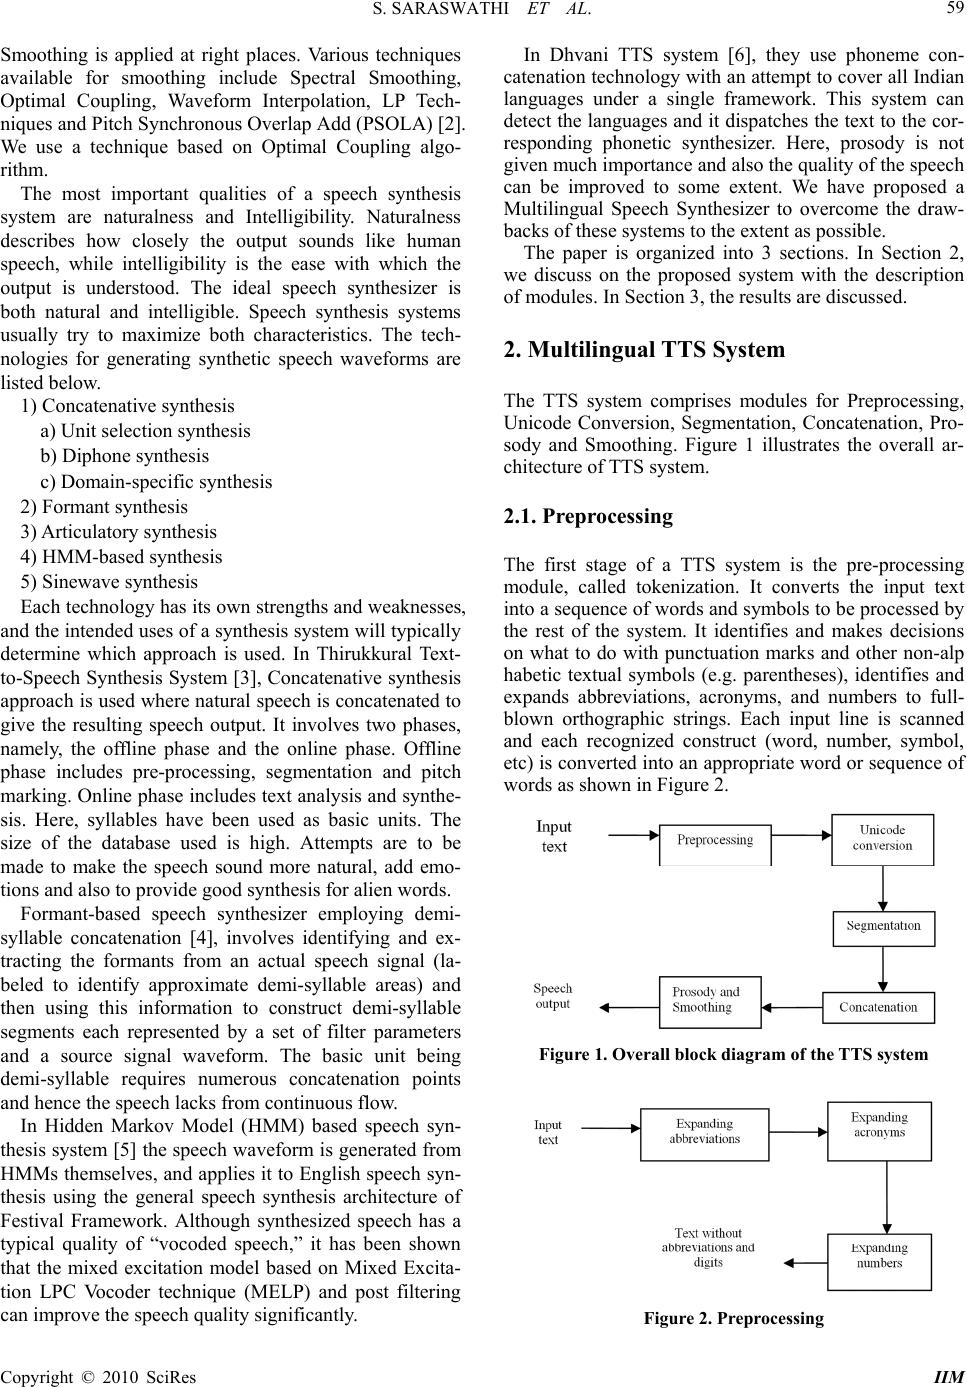 S. SARASWATHI ET AL. 59 Smoothing is applied at right places. Various techniques available for smoothing include Spectral Smoothing, Optimal Coupling, Waveform Interpolation, LP Tech- niques and Pitch Synchronous Overlap Add (PSOLA) [2]. We use a technique based on Optimal Coupling algo- rithm. The most important qualities of a speech synthesis system are naturalness and Intelligibility. Naturalness describes how closely the output sounds like human speech, while intelligibility is the ease with which the output is understood. The ideal speech synthesizer is both natural and intelligible. Speech synthesis systems usually try to maximize both characteristics. The tech- nologies for generating synthetic speech waveforms are listed below. 1) Concatenative synthesis a) Unit selection synthesis b) Diphone synthesis c) Domain-specific synthesis 2) Formant synthesis 3) Articulatory synthesis 4) HMM-based synthesis 5) Sinewave synthesis Each technology has its own strengths and weaknesses, and the intended uses of a synthesis system will typically determine which approach is used. In Thirukkural Text- to-Speech Synthesis System [3], Concatenative synthesis approach is used where natural speech is concatenated to give the resulting speech output. It involves two phases, namely, the offline phase and the online phase. Offline phase includes pre-processing, segmentation and pitch marking. Online phase includes text analysis and synthe- sis. Here, syllables have been used as basic units. The size of the database used is high. Attempts are to be made to make the speech sound more natural, add emo- tions and also to provide good synthesis for alien words. Formant-based speech synthesizer employing demi- syllable concatenation [4], involves identifying and ex- tracting the formants from an actual speech signal (la- beled to identify approximate demi-syllable areas) and then using this information to construct demi-syllable segments each represented by a set of filter parameters and a source signal waveform. The basic unit being demi-syllable requires numerous concatenation points and hence the speech lacks from continuous flow. In Hidden Markov Model (HMM) based speech syn- thesis system [5] the speech waveform is generated from HMMs themselves, and applies it to English speech syn- thesis using the general speech synthesis architecture of Festival Framework. Although synthesized speech has a typical quality of “vocoded speech,” it has been shown that the mixed excitation model based on Mixed Excita- tion LPC Vocoder technique (MELP) and post filtering can improve the speech quality significantly. In Dhvani TTS system [6], they use phoneme con- catenation technology with an attempt to cover all Indian languages under a single framework. This system can detect the languages and it dispatches the text to the cor- responding phonetic synthesizer. Here, prosody is not given much importance and also the quality of the speech can be improved to some extent. We have proposed a Multilingual Speech Synthesizer to overcome the draw- backs of these systems to the extent as possible. The paper is organized into 3 sections. In Section 2, we discuss on the proposed system with the description of modules. In Section 3, the results are discussed. 2. Multilingual TTS System The TTS system comprises modules for Preprocessing, Unicode Conversion, Segmentation, Concatenation, Pro- sody and Smoothing. Figure 1 illustrates the overall ar- chitecture of TTS system. 2.1. Preprocessing The first stage of a TTS system is the pre-processing module, called tokenization. It converts the input text into a sequence of words and symbols to be processed by the rest of the system. It identifies and makes decisions on what to do with punctuation marks and other non-alp habetic textual symbols (e.g. parentheses), identifies and expands abbreviations, acronyms, and numbers to full- blown orthographic strings. Each input line is scanned and each recognized construct (word, number, symbol, etc) is converted into an appropriate word or sequence of words as shown in Figure 2. Figure 1. Overall block diagram of the TTS system Figure 2. Preprocessing Copyright © 2010 SciRes IIM  S. SARASWATHI ET AL. 60 Preprocessing includes, 1) The removal of single and double quotes from the start and end of the token. 2) Expansion of abbreviations, acronyms, and num- bers. 3) In the case of Tamil and Telugu input, if there is any English word, it is replaced by an equivalent word in the corresponding language. 2.2. Unicode Conversion Unicode is an industry standard allowing computers to consistently represent and manipulate text expressed in most of the world's writing systems. In our work, we have used Unicode conversion to accept the input text in multiple fonts. The logic behind Unicode conversion is to identify the font in which the given text is encoded and applying Unicode encoding to the given font. For Tamil, since the input may be in TAM, TAB or TSCII, the encoding techniques for TAM, TAB and TSCII are explored and for each and every character in the input, Unicode encoding is applied to convert the given text into unicode. Similarly for Telugu, the encod- ing technique of shree font is explored and Unicode en- coding is applied to the input. In case of multilingual input, the text to be given is already converted to unicode and saved as a text file containing inputs from all the three languages. If the input is going to be in a single language then the Unicode conversion will be carried out internally as shown in Figure 3. 2.3. Segmentation Speech in Indian language is based on basic sound units which are inherently syllable units made from C, CV, CCV, VC and CVC combinations, where C is a conso- nant and V is a vowel. From perceptual results, it is ob- served that from four different choices of speech units like syllable, diphone, phone and half phone, the syllable unit performs better than all the rest and is a better rep- resentation for Indian languages. In our work, for English, we segment the text into syl- lables using the basic syllable pattern (C) (C) (C) V (C) (C) (C) (C). Hence, the possible syllable patterns are one among V, CV, CCV, CCV, VC, VCC, VCCC, CVC, VVC, CCVC, CCVCC, CCCVC. 2.3.1. Rules for Segmentation of English 1) If a word follows a basic syllable pattern then it is not split into syllables. 2) If a word contains more than one syllable pattern we frame rules based on the pronunciation like, 3) If CV is followed by CCV then split the word as CVC and CV. 4) If CV is followed by VC then split the word as CV and VC. For Tamil and Telugu, the basic syllable pattern is Figure 3. Unicode conversion module Figure 4. Segmentation of text into syllables Table 1. Word count for all the three languages Language No. of Words Syllable count English 4200 2225 Tamil 4213 1120 Telugu 4118 1950 represented in the form of (C) V (C) (C) and the possible syllable patterns are V, CV, CVC, CVCC, VC, VCC [7] 2.3.2. Rules for Segmentation of Tamil and Telugu 1) If characters after CV pattern are of type CV then the syllables are split as CV and CV. 2) If the CV pattern is followed by CCV then syllables are split as CVC and CV. 3) If the CV pattern is followed by CCCV then sylla- bles are split as CVCC and CV. 4) If the VC pattern is followed by V then syllables are split as V and CV. 5) If the VC pattern is followed by CVC then syllables are split as VC and CVC. Based on these rules the text is split into syllables and the location of the corresponding sound files for the syl- lables are written in a text file. 2.3.3. Collection of Syllables (Speech) After segmentation, recording is done at word level and segmented into syllables manually. The recording is done at a frequency of 48 KHz and the channel type is set as Stereo. The syllable count is reduced by finding the syl- lables which are common for Tamil and Telugu. Eg: Consider the following words: “Alochinchadam” in Telugu and “alosanai” in Tamil. The syllables for these words are as follows Alochincha dam–a/lo/chin/cha/dam Alosanai –a/lo/sa/nai. In this case, the syllables ‘a’ and ‘lo’ are common for both the lan- Copyright © 2010 SciRes IIM  S. SARASWATHI ET AL. 61 guages. Hence these syllables are stored only once in the database which can be accessed by both the languages and thereby reduces the size of the database. 2.3.4. Collection of Input Text We collected the input text from different sites Telugu: www.saakshi.com Tamil: www.dinamani.com English: www.hindu.com Domain: Nuclear deal The following table gives details about the count of the words and syllables for the three languages. Syllables common between Tamil and Telugu: 323 2.4. Concatenation In concatenative speech synthesis, the segments of re- corded speech are concatenated to produce the desired output [8]. Generally, this technique produces the most natural-sounding synthesized speech since the number of concatenating points is less. There are three main sub- types of concatenative speech synthesis namely Unit selection synthesis and Diphone synthesis. In our work, we use unit selection synthesis in which, the prerecorded words are split into syllables and are stored with the cor- responding syllable names and maintained in a database. In case of Tamil and Telugu, the syllable units are named using English letters based on the pronunciation in the corresponding language. For eg., the syllables in the word are named as follows: - veeinn - duim Based on the input, the syllable units are selected from the database and concatenated using MATLAB simulator integrated with java to create complete utterances as shown in Figure 5. 2.5. Prosody and Smoothing 2.5.1. Prosody Prosody is the rhythm, stress, and intonation of speech. Prosody may reflect the emotional state of a speaker; whether an utterance is a statement, a question, or a command; whether the speaker is being ironic or sarcas- tic; emphasis, contrast and focus; and other elements of language which may not be encoded by grammar. Hence, applying the concept of prosody to the TTS system makes the synthesis speech sounds more like human speech. There are several techniques used for prosody [9,10]. We make use of the punctuation marks like ‘!’, ‘?’, ‘;’ to give stress. In this method, if the words in the input text are followed by any of these special symbols they are read with intonations. For this method to work, the syllables which are to be read with intonation are main- tained as a separate database and these syllable units are Figure 5. Concatenation using unit selection synthesis Figure 6. Smoothing concatenated when intonation is to be given. 2.5.2. Smoothing Smoothing is used to smooth the transition between segments in order to produce continuous output as that produced by human speech as shown in Figure 6. There are several techniques used for smoothing like Spectral Smoothing, Optimal Coupling, Waveform In- terpolation, LP Techniques and Pitch Synchronous Over- lap Add (PSOLA). Among all these techniques optimal coupling algorithm is easy to implement at low cost. It is common in concatenative synthesis that the boun- daries of speech segments are fixed, but the optimal cou- pling technique allows the boundaries to move to provide the best fit with adjacent segments. A measure of mis- match is tested at a number of possible segment bounda- ries until the closest match is found. While any form of measure may be used, for the sake of improving spectral quality, using a spectral discontinuity measure is appro- priate. Measures considered include melfrequency cep- stral coefficients (MFCC) [11] and the auditory-neural based measure (ANBM) [12]. It is not necessary to im- plement optimal coupling to perform spectral smoothing, but it does provide some improvement at a small cost. We proposed a new technique for Smoothing based on Optimal Coupling algorithm. As shown in Figure 7, ini- tially we set the boundaries to search for the optimal concatenating point. If the given syllable unit is the be- ginning of the word then the boundary is set from 5n/6th position to n where, n is the length of the syllable unit. Otherwise the boundary is set from the beginning to n/3rd position. Then the Hamming windows are formed to process on the selected portions to find the concate- Copyright © 2010 SciRes IIM 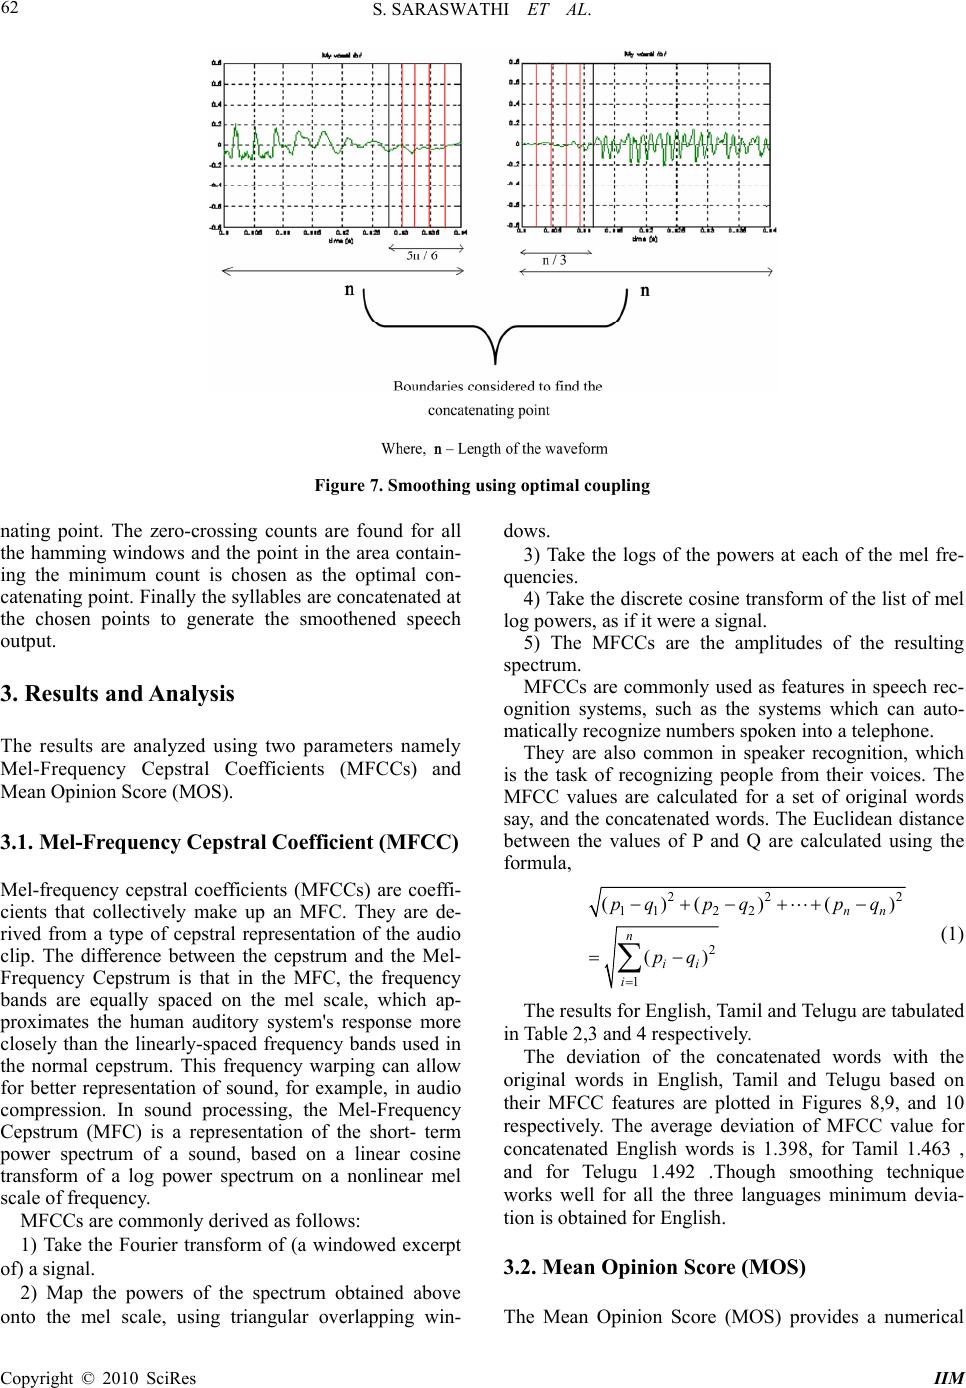 S. SARASWATHI ET AL. Copyright © 2010 SciRes IIM 62 Figure 7. Smoothing using optimal coupling nating point. The zero-crossing counts are found for all the hamming windows and the point in the area contain- ing the minimum count is chosen as the optimal con- catenating point. Finally the syllables are concatenated at the chosen points to generate the smoothened speech output. 3. Results and Analysis The results are analyzed using two parameters namely Mel-Frequency Cepstral Coefficients (MFCCs) and Mean Opinion Score (MOS). 3.1. Mel-Frequency Cepstral Coefficient (MFCC) Mel-frequency cepstral coefficients (MFCCs) are coeffi- cients that collectively make up an MFC. They are de- rived from a type of cepstral representation of the audio clip. The difference between the cepstrum and the Mel- Frequency Cepstrum is that in the MFC, the frequency bands are equally spaced on the mel scale, which ap- proximates the human auditory system's response more closely than the linearly-spaced frequency bands used in the normal cepstrum. This frequency warping can allow for better representation of sound, for example, in audio compression. In sound processing, the Mel-Frequency Cepstrum (MFC) is a representation of the short- term power spectrum of a sound, based on a linear cosine transform of a log power spectrum on a nonlinear mel scale of frequency. MFCCs are commonly derived as follows: 1) Take the Fourier transform of (a windowed excerpt of) a signal. 2) Map the powers of the spectrum obtained above onto the mel scale, using triangular overlapping win- dows. 3) Take the logs of the powers at each of the mel fre- quencies. 4) Take the discrete cosine transform of the list of mel log powers, as if it were a signal. 5) The MFCCs are the amplitudes of the resulting spectrum. MFCCs are commonly used as features in speech rec- ognition systems, such as the systems which can auto- matically recognize numbers spoken into a telephone. They are also common in speaker recognition, which is the task of recognizing people from their voices. The MFCC values are calculated for a set of original words say, and the concatenated words. The Euclidean distance between the values of P and Q are calculated using the formula, 22 112 2 2 1 ()( )( () nn n ii i pqp qp q pq 2 ) (1) The results for English, Tamil and Telugu are tabulated in Table 2,3 and 4 respectively. The deviation of the concatenated words with the original words in English, Tamil and Telugu based on their MFCC features are plotted in Figures 8,9, and 10 respectively. The average deviation of MFCC value for concatenated English words is 1.398, for Tamil 1.463 , and for Telugu 1.492 .Though smoothing technique works well for all the three languages minimum devia- tion is obtained for English. 3.2. Mean Opinion Score (MOS) The Mean Opinion Score (MOS) provides a numerical 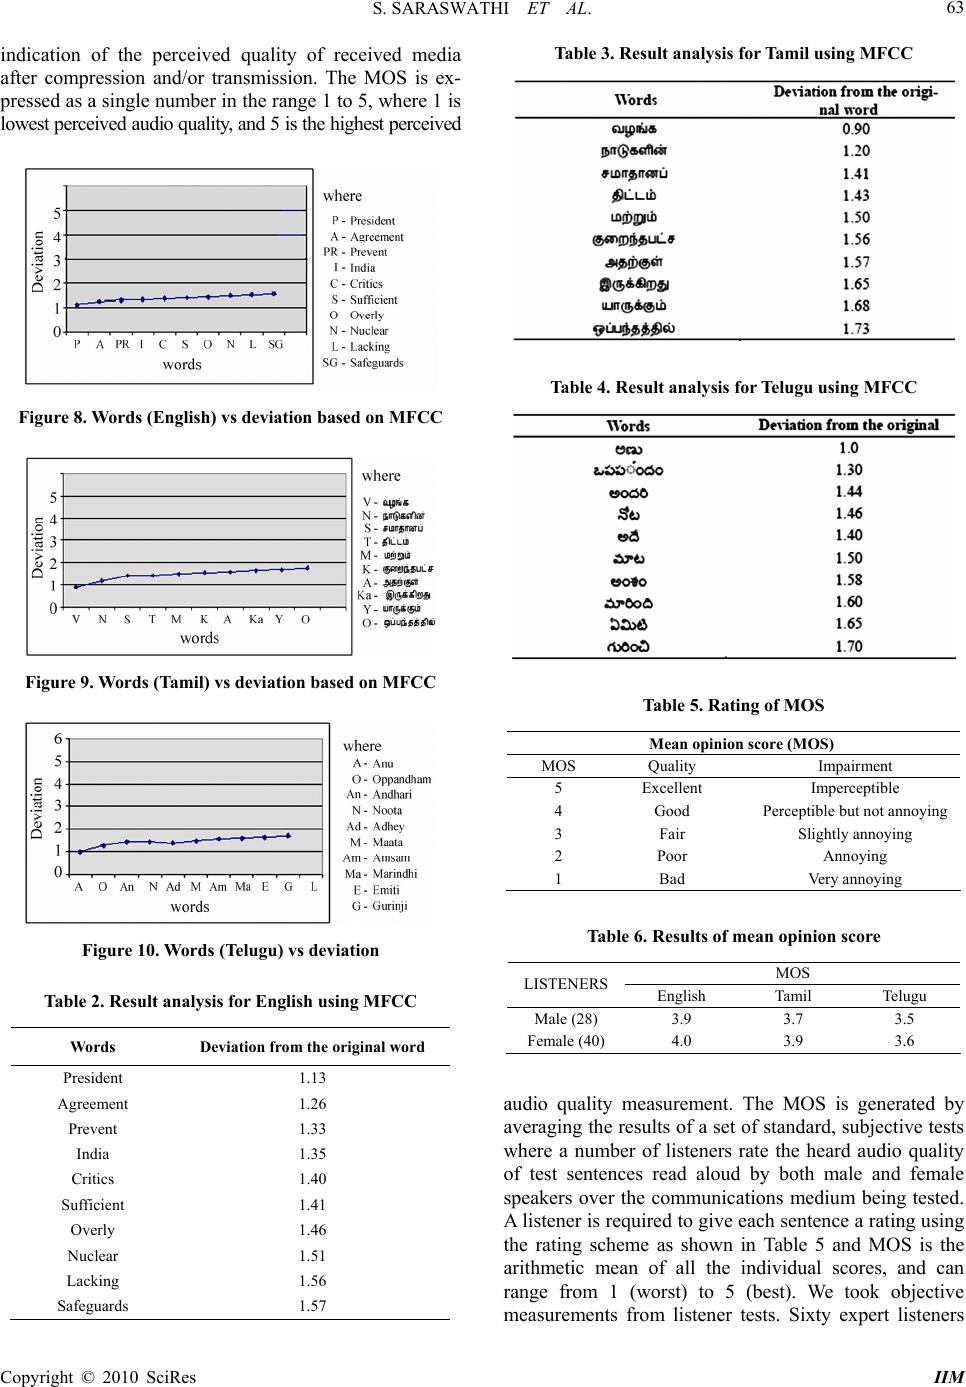 S. SARASWATHI ET AL. 63 indication of the perceived quality of received media after compression and/or transmission. The MOS is ex- pressed as a single number in the range 1 to 5, where 1 is lowest perceived audio quality, and 5 is the highest perceived Figure 8. Words (English) vs deviation based on MFCC Figure 9. Words (Tamil) vs deviation based on MFCC Figure 10. Words (Telugu) vs deviation Table 2. Result analysis for English using MFCC Words Deviation from the original word President 1.13 Agreement 1.26 Prevent 1.33 India 1.35 Critics 1.40 Sufficient 1.41 Overly 1.46 Nuclear 1.51 Lacking 1.56 Safeguards 1.57 Table 3. Result analysis for Tamil using MFCC Table 4. Result analysis for Telugu using MFCC Table 5. Rating of MOS Mean opinion score (MOS) MOS Quality Impairment 5 Excellent Imperceptible 4 Good Perceptible but not annoying 3 Fair Slightly annoying 2 Poor Annoying 1 Bad Very annoying Table 6. Results of mean opinion score MOS LISTENERS English Tamil Telugu Male (28) 3.9 3.7 3.5 Female (40) 4.0 3.9 3.6 audio quality measurement. The MOS is generated by averaging the results of a set of standard, subjective tests where a number of listeners rate the heard audio quality of test sentences read aloud by both male and female speakers over the communications medium being tested. A listener is required to give each sentence a rating using the rating scheme as shown in Table 5 and MOS is the arithmetic mean of all the individual scores, and can range from 1 (worst) to 5 (best). We took objective measurements from listener tests. Sixty expert listeners Copyright © 2010 SciRes IIM 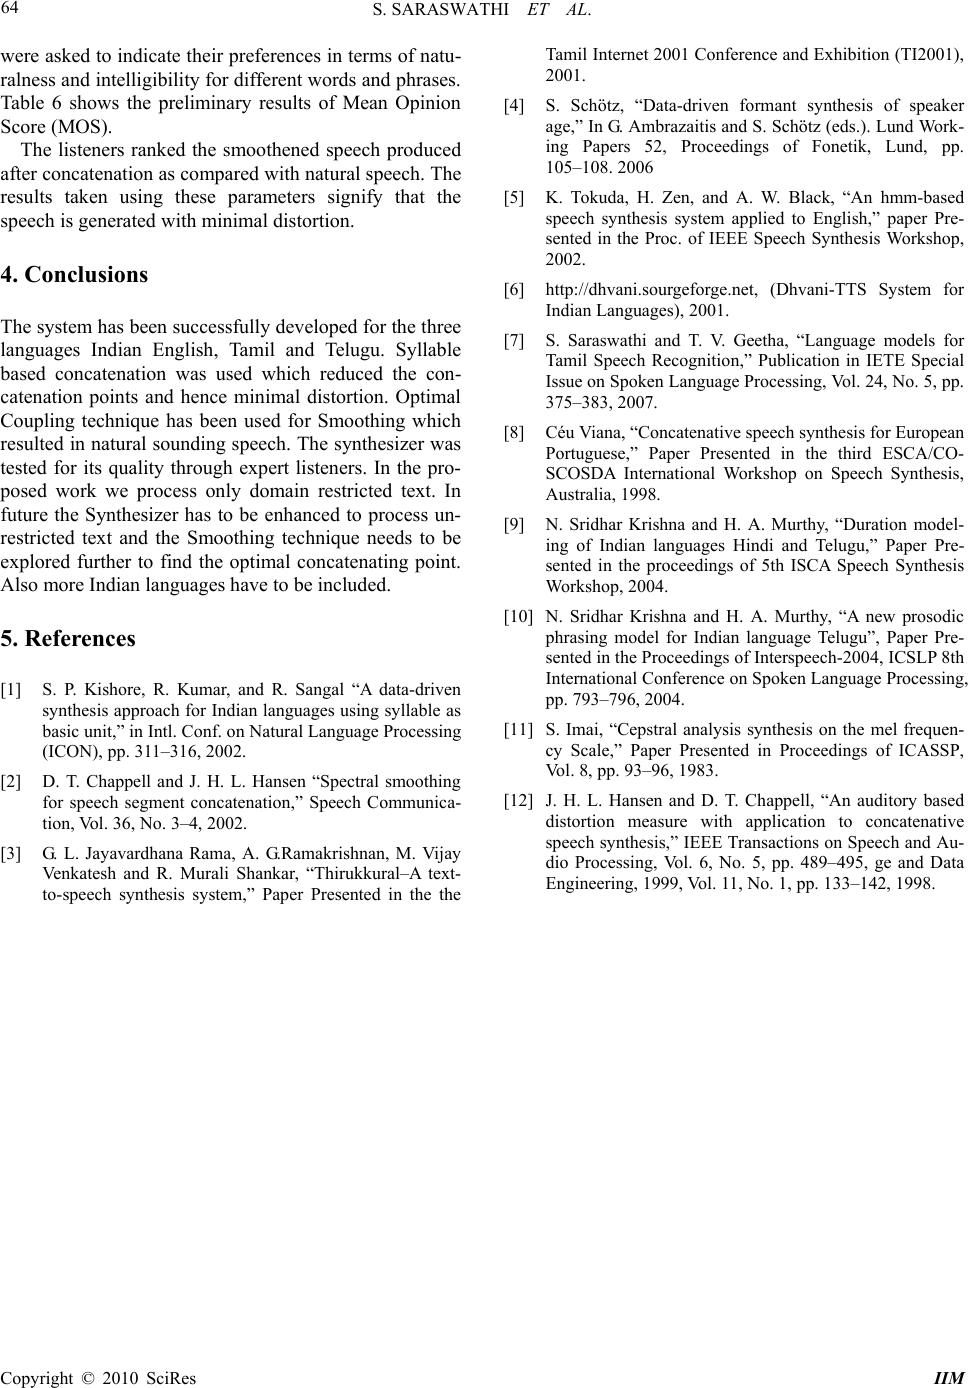 S. SARASWATHI ET AL. Copyright © 2010 SciRes IIM 64 were asked to indicate their preferences in terms of natu- ralness and intelligibility for different words and phrases. Table 6 shows the preliminary results of Mean Opinion Score (MOS). The listeners ranked the smoothened speech produced after concatenation as compared with natural speech. The results taken using these parameters signify that the speech is generated with minimal distortion. 4. Conclusions The system has been successfully developed for the three languages Indian English, Tamil and Telugu. Syllable based concatenation was used which reduced the con- catenation points and hence minimal distortion. Optimal Coupling technique has been used for Smoothing which resulted in natural sounding speech. The synthesizer was tested for its quality through expert listeners. In the pro- posed work we process only domain restricted text. In future the Synthesizer has to be enhanced to process un- restricted text and the Smoothing technique needs to be explored further to find the optimal concatenating point. Also more Indian languages have to be included. 5. References [1] S. P. Kishore, R. Kumar, and R. Sangal “A data-driven synthesis approach for Indian languages using syllable as basic unit,” in Intl. Conf. on Natural Language Processing (ICON), pp. 311–316, 2002. [2] D. T. Chappell and J. H. L. Hansen “Spectral smoothing for speech segment concatenation,” Speech Communica- tion, Vol. 36, No. 3–4, 2002. [3] G. L. Jayavardhana Rama, A. G.Ramakrishnan, M. Vijay Venkatesh and R. Murali Shankar, “Thirukkural–A text- to-speech synthesis system,” Paper Presented in the the Tamil Internet 2001 Conference and Exhibition (TI2001), 2001. [4] S. Schötz, “Data-driven formant synthesis of speaker age,” In G. Ambrazaitis and S. Schötz (eds.). Lund Work- ing Papers 52, Proceedings of Fonetik, Lund, pp. 105–108. 2006 [5] K. Tokuda, H. Zen, and A. W. Black, “An hmm-based speech synthesis system applied to English,” paper Pre- sented in the Proc. of IEEE Speech Synthesis Workshop, 2002. [6] http://dhvani.sourgeforge.net, (Dhvani-TTS System for Indian Languages), 2001. [7] S. Saraswathi and T. V. Geetha, “Language models for Tamil Speech Recognition,” Publication in IETE Special Issue on Spoken Language Processing, Vol. 24, No. 5, pp. 375–383, 2007. [8] Céu Viana, “Concatenative speech synthesis for European Portuguese,” Paper Presented in the third ESCA/CO- SCOSDA International Workshop on Speech Synthesis, Australia, 1998. [9] N. Sridhar Krishna and H. A. Murthy, “Duration model- ing of Indian languages Hindi and Telugu,” Paper Pre- sented in the proceedings of 5th ISCA Speech Synthesis Workshop, 2004. [10] N. Sridhar Krishna and H. A. Murthy, “A new prosodic phrasing model for Indian language Telugu”, Paper Pre- sented in the Proceedings of Interspeech-2004, ICSLP 8th International Conference on Spoken Language Processing, pp. 793–796, 2004. [11] S. Imai, “Cepstral analysis synthesis on the mel frequen- cy Scale,” Paper Presented in Proceedings of ICASSP, Vol. 8, pp. 93–96, 1983. [12] J. H. L. Hansen and D. T. Chappell, “An auditory based distortion measure with application to concatenative speech synthesis,” IEEE Transactions on Speech and Au- dio Processing, Vol. 6, No. 5, pp. 489–495, ge and Data Engineering, 1999, Vol. 11, No. 1, pp. 133–142, 1998. |