Paper Menu >>
Journal Menu >>
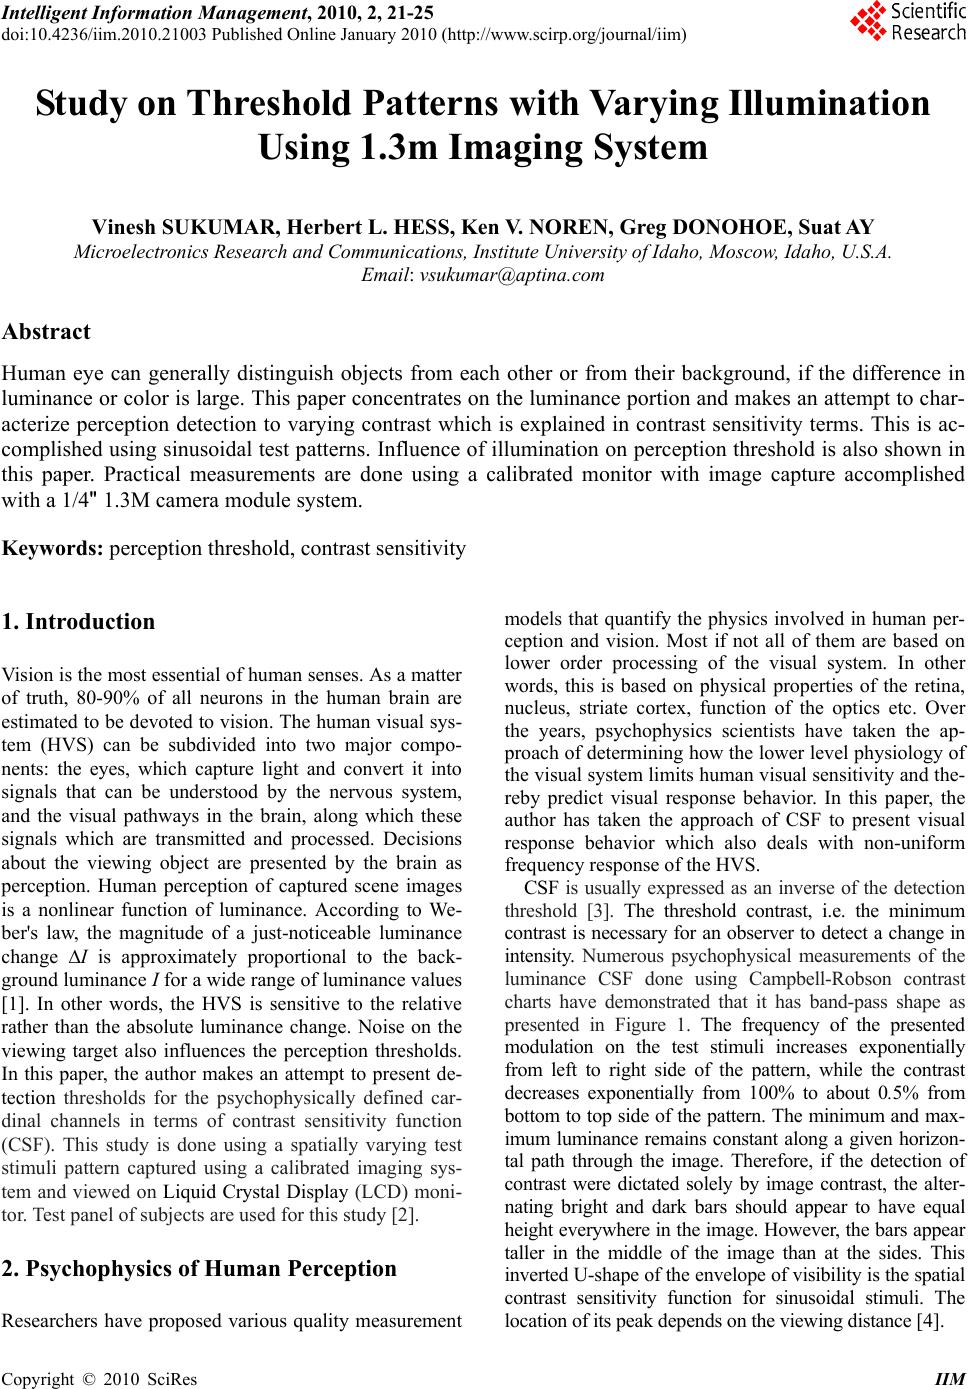 Intelligent Information Management, 2010, 2, 21-25 doi:10.4236/iim.2010.21003 Published Online January 2010 (http://www.scirp.org/journal/iim) Copyright © 2010 SciRes IIM Study on Threshold Patterns with Varying Illumination Using 1.3m Imaging System Vinesh SUKUMAR, Herbert L. HESS, Ken V. NOREN, Greg DONOHOE, Suat AY Microelectronics Research and Communications, Institute University of Idaho, Moscow, Idaho, U.S.A. Email: vsukumar@aptina.com Abstract Human eye can generally distinguish objects from each other or from their background, if the difference in luminance or color is large. This paper concentrates on the luminance portion and makes an attempt to char- acterize perception detection to varying contrast which is explained in contrast sensitivity terms. This is ac- complished using sinusoidal test patterns. Influence of illumination on perception threshold is also shown in this paper. Practical measurements are done using a calibrated monitor with image capture accomplished with a 1/4" 1.3M camera module system. Keywords: perception threshold, contrast sensitivity 1. Introduction Vision is the most essential of human senses. As a matter of truth, 80-90% of all neurons in the human brain are estimated to be devoted to vision. The human visual sys- tem (HVS) can be subdivided into two major compo- nents: the eyes, which capture light and convert it into signals that can be understood by the nervous system, and the visual pathways in the brain, along which these signals which are transmitted and processed. Decisions about the viewing object are presented by the brain as perception. Human perception of captured scene images is a nonlinear function of luminance. According to We- ber's law, the magnitude of a just-noticeable luminance change ∆I is approximately proportional to the back- ground luminance I for a wide range of luminance values [1]. In other words, the HVS is sensitive to the relative rather than the absolute luminance change. Noise on the viewing target also influences the perception thresholds. In this paper, the author makes an attempt to present de- tection thresholds for the psychophysically defined car- dinal channels in terms of contrast sensitivity function (CSF). This study is done using a spatially varying test stimuli pattern captured using a calibrated imaging sys- tem and viewed on Liquid Crystal Display (LCD) moni- tor. Test panel of subjects are used for this study [2]. 2. Psychophysics of Human Perception Researchers have proposed various quality measurement models that quantify the physics involved in human per- ception and vision. Most if not all of them are based on lower order processing of the visual system. In other words, this is based on physical properties of the retina, nucleus, striate cortex, function of the optics etc. Over the years, psychophysics scientists have taken the ap- proach of determining how the lower level physiology of the visual system limits human visual sensitivity and the- reby predict visual response behavior. In this paper, the author has taken the approach of CSF to present visual response behavior which also deals with non-uniform frequency response of the HVS. CSF is usually expressed as an inverse of the detection threshold [3]. The threshold contrast, i.e. the minimum contrast is necessary for an observer to detect a change in intensity. Numerous psychophysical measurements of the luminance CSF done using Campbell-Robson contrast charts have demonstrated that it has band-pass shape as presented in Figure 1. The frequency of the presented modulation on the test stimuli increases exponentially from left to right side of the pattern, while the contrast decreases exponentially from 100% to about 0.5% from bottom to top side of the pattern. The minimum and max- imum luminance remains constant along a given horizon- tal path through the image. Therefore, if the detection of contrast were dictated solely by image contrast, the alter- nating bright and dark bars should appear to have equal height everywhere in the image. However, the bars appear taller in the middle of the image than at the sides. This inverted U-shape of the envelope of visibility is the spatial contrast sensitivity function for sinusoidal stimuli. The location of its peak depends on the viewing distance [4]. 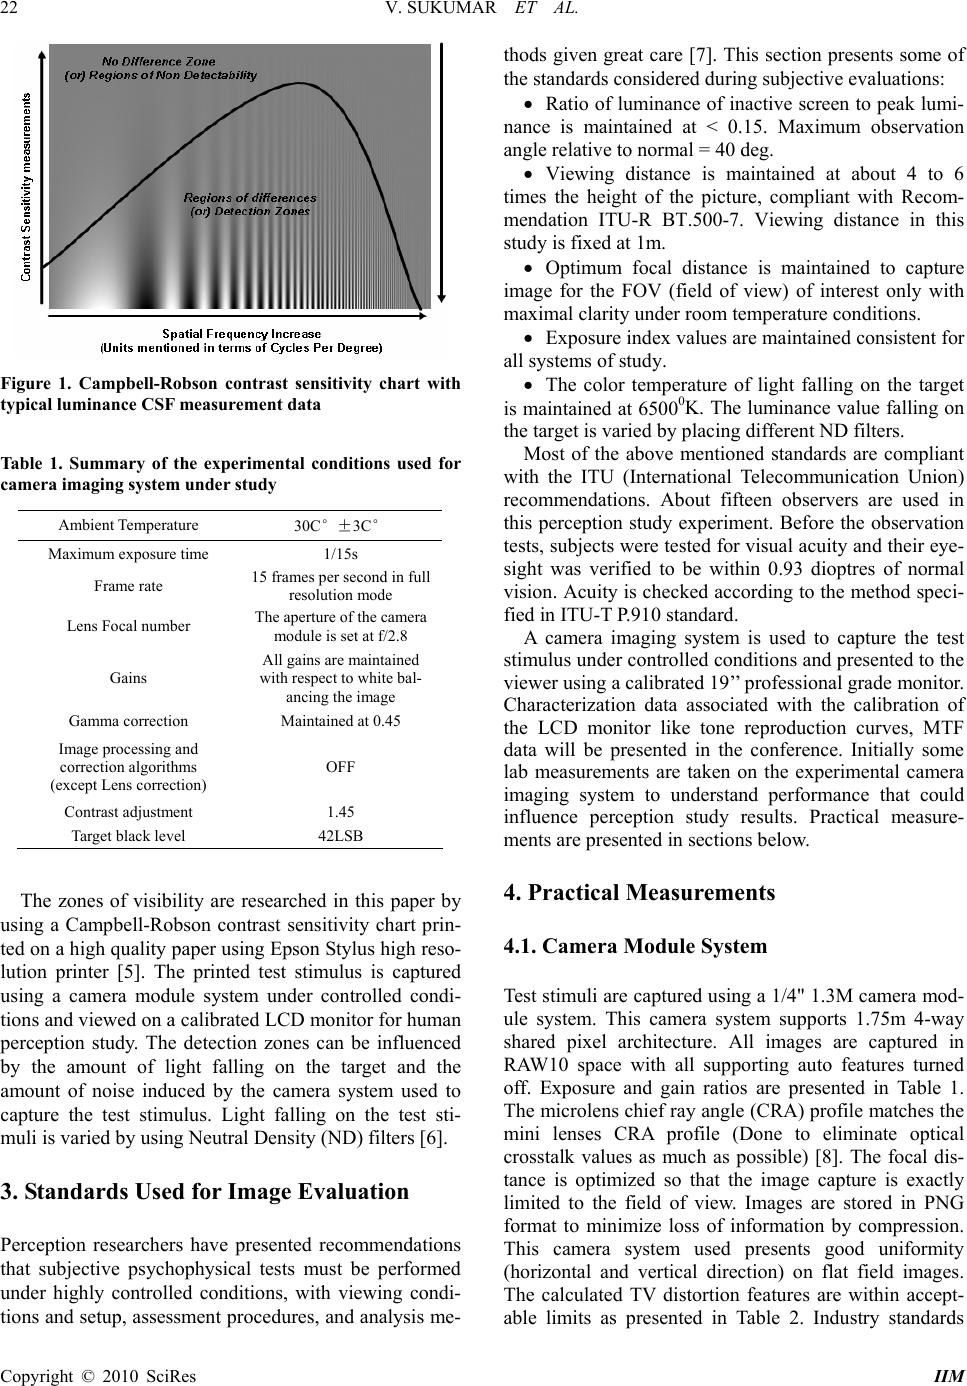 V. SUKUMAR ET AL. 22 Figure 1. Campbell-Robson contrast sensitivity chart with typical luminance CSF measurement data Table 1. Summary of the experimental conditions used for camera imaging system under study Ambient Temperature 30C°±3C° Maximum exposure time 1/15s Frame rate 15 frames per second in full resolution mode Lens Focal number The aperture of the camera module is set at f/2.8 Gains All gains are maintained with respect to white bal- ancing the image Gamma correction Maintained at 0.45 Image processing and correction algorithms (except Lens correction) OFF Contrast adjustment 1.45 Target black level 42LSB The zones of visibility are researched in this paper by using a Campbell-Robson contrast sensitivity chart prin- ted on a high quality paper using Epson Stylus high reso- lution printer [5]. The printed test stimulus is captured using a camera module system under controlled condi- tions and viewed on a calibrated LCD monitor for human perception study. The detection zones can be influenced by the amount of light falling on the target and the amount of noise induced by the camera system used to capture the test stimulus. Light falling on the test sti- muli is varied by using Neutral Density (ND) filters [6]. 3. Standards Used for Image Evaluation Perception researchers have presented recommendations that subjective psychophysical tests must be performed under highly controlled conditions, with viewing condi- tions and setup, assessment procedures, and analysis me- thods given great care [7]. This section presents some of the standards considered during subjective evaluations: Ratio of luminance of inactive screen to peak lumi- nance is maintained at < 0.15. Maximum observation angle relative to normal = 40 deg. Viewing distance is maintained at about 4 to 6 times the height of the picture, compliant with Recom- mendation ITU-R BT.500-7. Viewing distance in this study is fixed at 1m. Optimum focal distance is maintained to capture image for the FOV (field of view) of interest only with maximal clarity under room temperature conditions. Exposure index values are maintained consistent for all systems of study. The color temperature of light falling on the target is maintained at 65000K. The luminance value falling on the target is varied by placing different ND filters. Most of the above mentioned standards are compliant with the ITU (International Telecommunication Union) recommendations. About fifteen observers are used in this perception study experiment. Before the observation tests, subjects were tested for visual acuity and their eye- sight was verified to be within 0.93 dioptres of normal vision. Acuity is checked according to the method speci- fied in ITU-T P.910 standard. A camera imaging system is used to capture the test stimulus under controlled conditions and presented to the viewer using a calibrated 19’’ professional grade monitor. Characterization data associated with the calibration of the LCD monitor like tone reproduction curves, MTF data will be presented in the conference. Initially some lab measurements are taken on the experimental camera imaging system to understand performance that could influence perception study results. Practical measure- ments are presented in sections below. 4. Practical Measurements 4.1. Camera Module System Test stimuli are captured using a 1/4" 1.3M camera mod- ule system. This camera system supports 1.75m 4-way shared pixel architecture. All images are captured in RAW10 space with all supporting auto features turned off. Exposure and gain ratios are presented in Table 1. The microlens chief ray angle (CRA) profile matches the mini lenses CRA profile (Done to eliminate optical crosstalk values as much as possible) [8]. The focal dis- tance is optimized so that the image capture is exactly limited to the field of view. Images are stored in PNG format to minimize loss of information by compression. This camera system used presents good uniformity (horizontal and vertical direction) on flat field images. The calculated TV distortion features are within accept- able limits as presented in Table 2. Industry standards Copyright © 2010 SciRes IIM 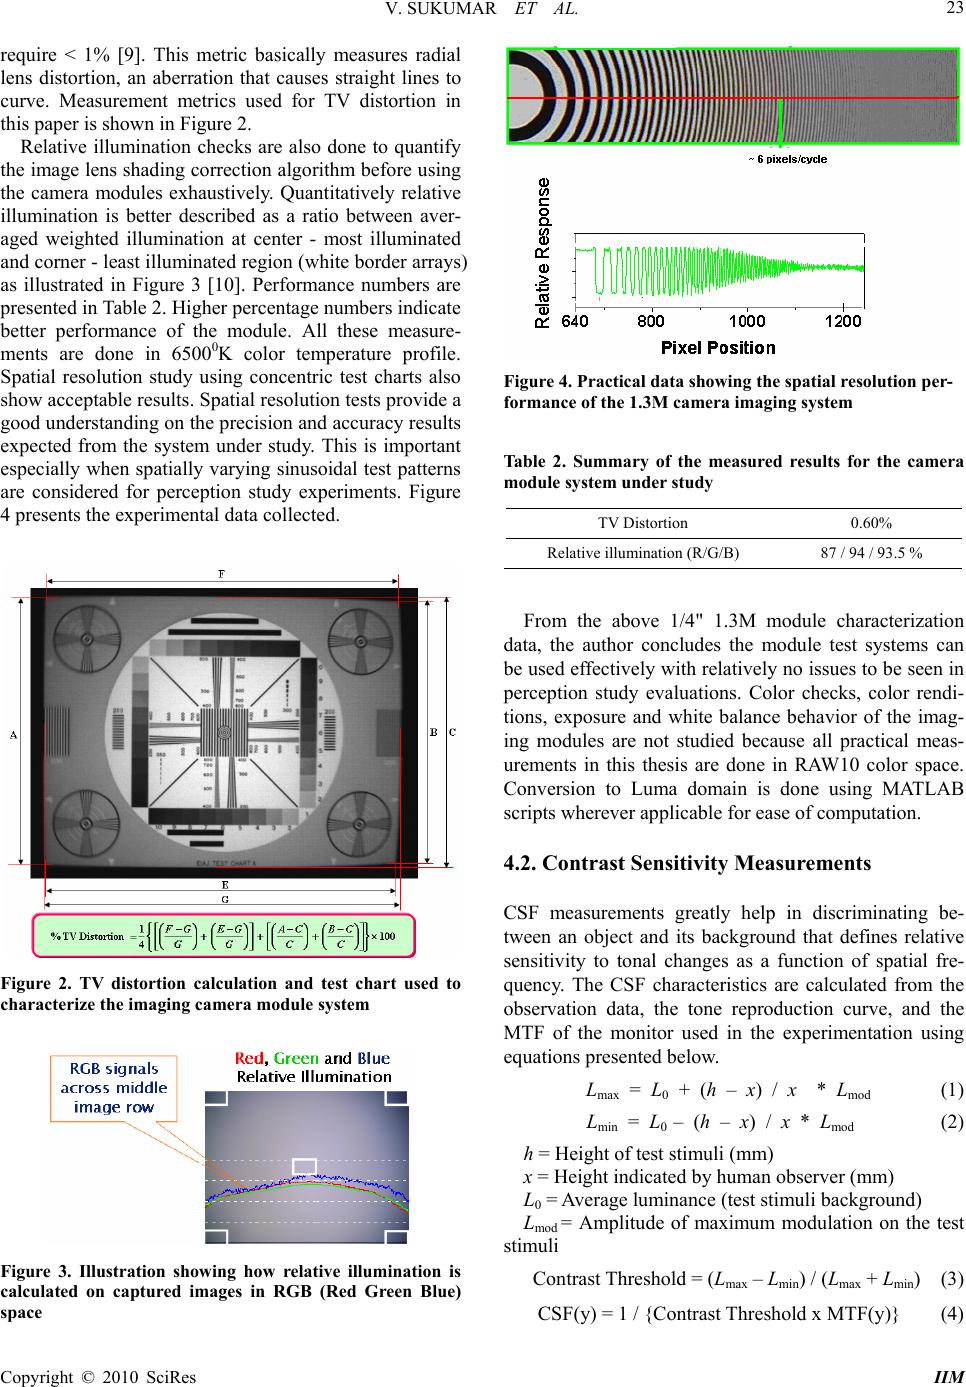 V. SUKUMAR ET AL. 23 require < 1% [9]. This metric basically measures radial lens distortion, an aberration that causes straight lines to curve. Measurement metrics used for TV distortion in this paper is shown in Figure 2. Relative illumination checks are also done to quantify the image lens shading correction algorithm before using the camera modules exhaustively. Quantitatively relative illumination is better described as a ratio between aver- aged weighted illumination at center - most illuminated and corner - least illuminated region (white border arrays) as illustrated in Figure 3 [10]. Performance numbers are presented in Table 2. Higher percentage numbers indicate better performance of the module. All these measure- ments are done in 65000K color temperature profile. Spatial resolution study using concentric test charts also show acceptable results. Spatial resolution tests provide a good understanding on the precision and accuracy results expected from the system under study. This is important especially when spatially varying sinusoidal test patterns are considered for perception study experiments. Figure 4 presents the experimental data collected. Figure 2. TV distortion calculation and test chart used to characterize the imaging camera module system Figure 3. Illustration showing how relative illumination is calculated on captured images in RGB (Red Green Blue) space Figure 4. Practical data showing the spatial resolution per- formance of the 1.3M camera imaging system Table 2. Summary of the measured results for the camera module system under study TV Distortion 0.60% Relative illumination (R/G/B) 87 / 94 / 93.5 % From the above 1/4" 1.3M module characterization data, the author concludes the module test systems can be used effectively with relatively no issues to be seen in perception study evaluations. Color checks, color rendi- tions, exposure and white balance behavior of the imag- ing modules are not studied because all practical meas- urements in this thesis are done in RAW10 color space. Conversion to Luma domain is done using MATLAB scripts wherever applicable for ease of computation. 4.2. Contrast Sensitivity Measurements CSF measurements greatly help in discriminating be- tween an object and its background that defines relative sensitivity to tonal changes as a function of spatial fre- quency. The CSF characteristics are calculated from the observation data, the tone reproduction curve, and the MTF of the monitor used in the experimentation using equations presented below. Lmax = L0 + (h – x) / x * Lmod (1) Lmin = L0 – (h – x) / x * Lmod (2) h = Height of test stimuli (mm) x = Height indicated by human observer (mm) L0 = Average luminance (test stimuli background) Lmod = Amplitude of maximum modulation on the test stimuli Contrast Threshold = (Lmax – Lmin) / (Lmax + Lmin) (3) CSF(y) = 1 / {Contrast Threshold x MTF(y)} (4) Copyright © 2010 SciRes IIM 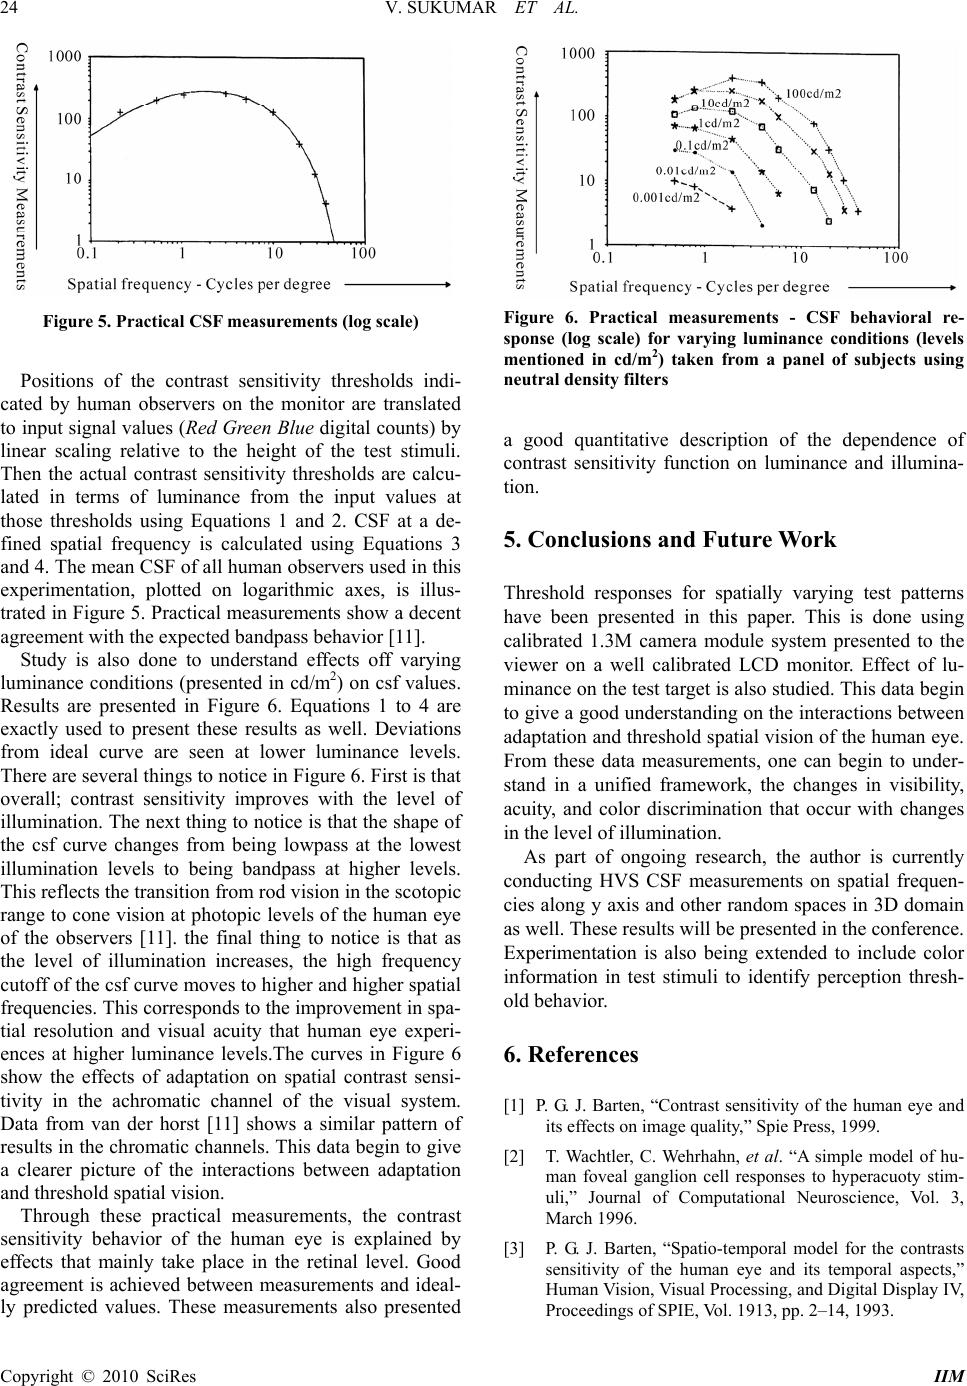 V. SUKUMAR ET AL. 24 Figure 5. Practical CSF measurements (log scale) Positions of the contrast sensitivity thresholds indi- cated by human observers on the monitor are translated to input signal values (Red Green Blue digital counts) by linear scaling relative to the height of the test stimuli. Then the actual contrast sensitivity thresholds are calcu- lated in terms of luminance from the input values at those thresholds using Equations 1 and 2. CSF at a de- fined spatial frequency is calculated using Equations 3 and 4. The mean CSF of all human observers used in this experimentation, plotted on logarithmic axes, is illus- trated in Figure 5. Practical measurements show a decent agreement with the expected bandpass behavior [11]. Study is also done to understand effects off varying luminance conditions (presented in cd/m2) on csf values. Results are presented in Figure 6. Equations 1 to 4 are exactly used to present these results as well. Deviations from ideal curve are seen at lower luminance levels. There are several things to notice in Figure 6. First is that overall; contrast sensitivity improves with the level of illumination. The next thing to notice is that the shape of the csf curve changes from being lowpass at the lowest illumination levels to being bandpass at higher levels. This reflects the transition from rod vision in the scotopic range to cone vision at photopic levels of the human eye of the observers [11]. the final thing to notice is that as the level of illumination increases, the high frequency cutoff of the csf curve moves to higher and higher spatial frequencies. This corresponds to the improvement in spa- tial resolution and visual acuity that human eye experi- ences at higher luminance levels.The curves in Figure 6 show the effects of adaptation on spatial contrast sensi- tivity in the achromatic channel of the visual system. Data from van der horst [11] shows a similar pattern of results in the chromatic channels. This data begin to give a clearer picture of the interactions between adaptation and threshold spatial vision. Through these practical measurements, the contrast sensitivity behavior of the human eye is explained by effects that mainly take place in the retinal level. Good agreement is achieved between measurements and ideal- ly predicted values. These measurements also presented Figure 6. Practical measurements - CSF behavioral re- sponse (log scale) for varying luminance conditions (levels mentioned in cd/m2) taken from a panel of subjects using neutral density filters a good quantitative description of the dependence of contrast sensitivity function on luminance and illumina- tion. 5. Conclusions and Future Work Threshold responses for spatially varying test patterns have been presented in this paper. This is done using calibrated 1.3M camera module system presented to the viewer on a well calibrated LCD monitor. Effect of lu- minance on the test target is also studied. This data begin to give a good understanding on the interactions between adaptation and threshold spatial vision of the human eye. From these data measurements, one can begin to under- stand in a unified framework, the changes in visibility, acuity, and color discrimination that occur with changes in the level of illumination. As part of ongoing research, the author is currently conducting HVS CSF measurements on spatial frequen- cies along y axis and other random spaces in 3D domain as well. These results will be presented in the conference. Experimentation is also being extended to include color information in test stimuli to identify perception thresh- old behavior. 6. References [1] P. G. J. Barten, “Contrast sensitivity of the human eye and its effects on image quality,” Spie Press, 1999. [2] T. Wachtler, C. Wehrhahn, et al. “A simple model of hu- man foveal ganglion cell responses to hyperacuoty stim- uli,” Journal of Computational Neuroscience, Vol. 3, March 1996. [3] P. G. J. Barten, “Spatio-temporal model for the contrasts sensitivity of the human eye and its temporal aspects,” Human Vision, Visual Processing, and Digital Display IV, Proceedings of SPIE, Vol. 1913, pp. 2–14, 1993. Copyright © 2010 SciRes IIM  V. SUKUMAR ET AL. Copyright © 2010 SciRes IIM 25 [4] P. G. J. Barten, “Evaluation of subjective image quality with the square root integral method,” Journal of Optical Society of America, Vol. 7, pp. 2024–2031, 1990. [5] M. A. Georgeson and G. D. Sullivan, “Contrast sensitivity: deblurring in human vision by spatial frequency chan- nels,” Journal of Physiology, Vol. 252, pp. 627–656, 1975. [6] G. Wald, “The spectral sensitivity of the human eye; a spectral adaptometer,” Journal of the Optical Society of America, Vol. 35, pp. 187, 1945. [7] S. Winkler, “Vision models and quality metrics for image processing applications,” Doctoral Thesis, Ecole Polyte- chinique Federale De Lausanne, 2000. [8] S. Winkler, “Quality metric design: A closer look,” Pro- ceedings of SPIE Human Vision and Electronic Imaging, Vol. 3959, pp. 37–44, San Jose, CA, 2000. [9] S. Winkler, P. Vandergheynst, et al, “Computing isotropic local contrast from oriented pyramid decompositions,” In Proceedings of the International Conference on Image Processing, Kyoto, Japan,Vol. 4, pp. 420–424, 1999. [10] P. G. J. Barten, “Physical model for the contrast sensitiv- ity of the human eye,” Human Vision, Visual Processing, and Digital Display III, Proceedings of SPIE, Vol. 1666, pp. 57–72, 1992. [11] M. W. Cannon, “Perceived contrast in the fovea and in the periphery,” Journal of Optical Society of America, Vol. 2, pp. 1760–1768, 1985. |