Journal of Cancer Therapy
Vol. 4 No. 4 (2013) , Article ID: 32721 , 13 pages DOI:10.4236/jct.2013.44103
Expression of O6-Methylguanine-DNA Methyltransferase Examined by Alkyl-Transfer Assays, Methylation-Specific PCR and Western Blots in Tumors and Matched Normal Tissue
![]()
1Division of Gynecologic Oncology, Department of Obstetrics and Gynecology, Yale University School of Medicine, New Haven, USA; 2Department of Pharmacology and Developmental Therapeutics Program, Cancer Center, Yale University School of Medicine, New Haven, USA.
Email: *kimiko.ishiguro@yale.edu
Copyright © 2013 Kimiko Ishiguro et al. This is an open access article distributed under the Creative Commons Attribution License, which permits unrestricted use, distribution, and reproduction in any medium, provided the original work is properly cited.
Received April 10th, 2013; revised May 11th, 2013; accepted May 19th, 2013
Keywords: O6-Methylguanine-DNA Methyltransferase (MGMT, O6-Alkylguanine-DNA Alkyltransferase, AGT); [Benzene-3H]O6-Benzylguanine; Methylation-Specific PCR (MSP); Laromustine (Onrigin, Cloretazine, VNP40101M, 101M); Temozolomide
ABSTRACT
The tumor selectivity of alkylating agents that produce guanine O6-chloroethyl (laromustine and carmustine) and O6-methyl (temozolomide) lesions depends upon O6-methylguanine-DNA methyltransferase (MGMT) activity being lower in tumor than in host tissue. Despite the established role of MGMT as a tumor resistance factor, consensus on how to assess MGMT expression in clinical samples is unsettled. The aim of this study is to examine the relationship between the values derived from distinctive MGMT measurements in 13, 12, 6 and 2 pairs of human tumors and matched normal adjacent tissue from the colon, kidney, lung and liver, respectively, and in human cell lines. The MGMT measurements included 1) alkyl-transfer assays using [benzene-3H]O6-benzylguanine as a substrate to assess functional MGMT activity, 2) methylation-specific PCR (MSP) to probe MGMT gene promoter CpG methylations as a measure of gene silencing, and 3) western immunoblots to analyze the MGMT protein. In human cell lines, a strict negative correlation existed between MGMT activity and the extent of promoter methylation. In tissue specimens, by contrast, the correlation between these two variables was low. Moreover, alkyl-transfer assays identified 3 pairs of tumors and normal tissue with tumor-selective reduction in MGMT activity in the absence of promoter methylation. Cell line MGMT migrated as a single band in western analyses, whereas tissue MGMT was heterogeneous around its molecular size and at much higher molecular masses, indicative of multi-layered post-translational modifications. Malignancy is occasionally associated with a mobility shift in MGMT. Contrary to the prevalent expectation that MGMT expression is governed at the level of gene silencing, these data suggest that other mechanisms that can lead to tumorselective reduction in MGMT activity exist in human tissue.
1. Introduction
Despite the N-7 position of guanine being the predominant nucleophilic center for DNA alkylation, the antitumor activity of clinically active alkylating agents such as laromustine (onrigin; cloretazine; VNP40101M; 101M), carmustine (BCNU) and temozolomide, is primarily due to their ability to alkylate DNA at the O-6 position of guanine [1]. This conclusion derives from overwhelming evidence that the repair protein O6-methylguanine-DNA methyltransferase (MGMT), which transfers guanine O6- alkyl groups to the active site cysteine in the protein and restores the O-6 position of guanine to the native state, is the principal tumor resistance factor for these agents [1-5].
MGMT has alternatively been denoted as O6-alkylguanine-DNA alkyltransferase (AGT) in numerous publications. Because human MGMT repairs a variety of guanine O6-alkyl adducts apart from the guanine O6- methyl adduct, AGT reflects the functional property more accurately than MGMT. However, MGMT is used in this paper, because O6-methylguanine-DNA methyltransferase (MGMT) is the name (symbol) approved by the HUGO Gene Nomenclature Committee.
Laromustine and carmustine are chloroethylating agents, while temozolomide is a methylating agent. These two types of alkylating agents exert cytotoxicity through distinctive mechanisms, chloroethylating agents via the generation of highly lethal interstrand DNA cross-links and methylating agents via an intact mismatch repair system [3]. Although MGMT produces marked tumor resistance to both types of alkylating agents, the underlying mechanisms are different [6]. MGMT repairs the methyl lesions with enormous efficiency until the MGMT pool is exhausted. In contrast, the repair of the chloroethyl lesions by MGMT is complex due to chemical progression of the initial guanine O6-chloroethyl lesion via intermediary N1,O6-ethanoguanine cyclization to the ultimate 1-(N3- cytosinyl)-2-(N1-guaninyl)ethane DNA cross-link. MGMT produces repair of the first two chemical forms [7], but fails to repair the G-C cross-link that does not involve the O-6 position of guanine. Since the cross-link formation competes with the MGMT repair, the repair of the chloroethyl adducts by MGMT is ineffective. The number of guanine O6-methyl and O6-chloroethyl lesions/cell necessary to produce 50% growth inhibition is estimated to be 5,600 and ~300, respectively [6]. Thus, the smaller number of chloroethyl lesions needed for cytotoxicity compensates for the ineffectiveness of MGMT repair, allowing MGMT to produce marked tumor resistance to the chloroethylating agents.
MGMT acts alone in catalyzing the transfer of an alkyl group to the active site cysteine in a single-step manner that results in a stoichiometric irreversible inactivation of the protein [1]. Regeneration of MGMT activity is a slow process that depends upon de novo protein synthesis. Thus, methylating agents such as temozolomide, which require thousands of guanine O6-methylations to cause cytotoxicity, deplete the cellular MGMT pool by providing MGMT with strong substrates. On the other hand, chloroethylating agents, which need only hundreds of guanine O6-lesions for cytotoxicity do not significantly deplete MGMT.
The standard therapy for malignant gliomas is comprised of debulking surgery followed by adjuvant radiotherapy with concomitant temozolomide chemotherapy [8]. Because the brain has the lowest MGMT content among human organs [9,10], brain tumors may generally be susceptible to temozolomide. Moreover, because the daily oral dose of temozolomide at 75 mg/m2 for up to 7 weeks is safe [11], the MGMT-depleting, self-sensitizing property of temozolomide is assumed to enhance its therapeutic activity [8].
Laromustine is a chloroethylating agent designed and synthesized in our laboratory [12]. Although laromustine bears a functional resemblance to the nitrosourea carmustine, laromustine exhibits greater specificity for the O-6 position of guanine than carmustine [6,13]. A clear inverse relationship between the ability of laromustine to produce tumor regression and MGMT activity is observed in CNS tumor xenografts in athymic mice [14]. In phase II clinical studies, laromustine as a single agent produced about a 30% complete response rate with modest extramedullary toxicity in patients with poor-risk acute myelogenous leukemia and myelodysplastic syndromes [15]. The relationship between MGMT activity and clinical response to laromustine remains to be established.
Functional MGMT activity determined by an alkyltransfer assay is the logical predictor of response to guanine O6-alkylating agents. However, traditional alkyltransfer assays using DNA reacted with N-[3H]methylN-nitrosourea as a substrate are tedious requiring the use of HPLC in some of the protocols [9,16]. Hence, we have devised a simple alkyl-transfer assay using the pseudosubstrate [benzene-3H]O6-benzylguanine [17]. This assay relies upon the covalent transfer of radioactive benzyl moieties from the methanol-soluble small chemical substrate to methanol-insoluble MGMT, and involves incubation of either tissue homogenates or intact cells with the labeled substrate followed by measurement of radioactivity in a 70% methanol-insoluble fraction.
MGMT causes tumor resistance to guanine O6-alkylating agents, while it protects normal host tissue from adverse effects. Thus, tumor selectivity by these agents requires differential expression of MGMT in tumor and normal tissue; the lower the MGMT content in tumor and the higher the MGMT content in normal tissue, the greater the tumor selectivity. The obstacles associated with this class of agents are the low occurrence of MGMTnegative or MGMT-low tumors, necessitating rigorous screening for MGMT activity, and a shortage of reliable clinical MGMT assays.
MGMT gene promoter methylation examined by methylation-specific PCR (MSP) has emerged as an independent prognostic marker, as well as a predictive marker for response to temozolomide in malignant gliomas [18,19]. MSP yields an indirect measure of MGMT expression. Thus, to be a predictive marker for drug response, promoter methylation must be validated for correlation with endpoint MGMT activity. The MSP assay is stated to rely upon the fact that detection of the methylated MGMT allele can be solely attributed to neoplastic cells and nontumor tissue contamination of the surgical specimen does not interfere with the result [18]. Yet, whether promoter methylation is a tumor specific event has not been tested in strict side-by-side analyses using tumors and matched normal tissue.
Using pairs of tumors and matched normal tissue, the occurrence of tumor specific absence or reduction in MGMT expression has been reported in the liver [20], the organ with the highest MGMT content [9,10]. The occurrence of poor MGMT expression in the absence of promoter methylation has been reported in glioblastoma maintained as xenografts [21] and esophageal squamous cell carcinoma [22]. These observations prompted us to conduct comprehensive analyses on MGMT expression in organs such as the colon, kidney, lung and liver from which pairs of tumors and matched normal adjacent tissue are available through routine resection. We report that 1) promoter methylation is not restricted to tumor, 2) the correlation between promoter methylation and MGMT activity is low, 3) tumor-selective reduction in MGMT activity occurs at a low frequency in the absence of promoter methylation, and 4) tumor-selective reduction of MGMT activity may be mediated by a post-translational mechanism(s).
2. Materials and Methods
2.1. Human Tumors and Matched Normal Adjacent Tissue
Snap frozen tissue samples were obtained from the Eastern Division of the Cooperative Human Tissue Network (CHTN), a National Cancer Institute supported resource. The application requesting samples from the CHTN was reviewed by the Yale University Human Investigation Committee and received non-human investigation status. Each sample was accompanied by unidentifiable information (age, sex, race and pathology report) and a hematoxylin-eosin stained tissue slide. Tumors were accepted only when matched normal adjacent tissue was available with a minimum weight of 0.1 g to enable preparation of homogenates for alkyl-transfer assays. From August 2010 through August 2011, we received 13, 12, 6, and 2 sets of tumor and normal tissue samples from the colon, kidney, lung and liver, respectively, with 8 separate deliveries.
2.2. Alkyl-Transfer Assays to Measure Functional MGMT Activity
The assay procedures for intact cultured cells and cell homogenates using [benzene-3H]O6-benzylguanine ([3H]- BG, 23.6 Ci/mmol, MT1915, Moravek Biochemicals, Brea, CA) were previously described [17]. For clinical samples, a fragment weighing 70 - 110 mg was minced with curved iris scissors, suspended in 9 volumes of a buffer consisting of 50 mM Tris-HCl (pH 7.8) and 1 mM dithiothreitol, homogenized on ice using a T-10 Ultra Turrax homogenizer (IKA, Germany), and further sonicated 6 times in short bursts on ice using a Branson Sonifier (Danbury, CT). The final appearance of tissue homogenates was translucent. The homogenate in a volume of 100 µl, in triplicate, was incubated with [3H]-BG in the absence or presence of excess unlabeled O6-benzylguanine and processed as described for intact cultured cells [17]. Final washed pellets were suspended in 400 µl of Biosol (National Diagnostics, Atlanta, GA), transferred to 5 ml-plastic scintillation vials, and incubated at 50˚C for 1 hour in the presence of 20 µl of 30% hydrogen peroxide for solubilization and decolorization. After addition of 4 ml of Bioscint Scintillation Cocktail (National Diagnostics), radioactivity was measured. The protein concentration of tissue homogenates was determined using a Bio-Rad protein assay (Bio-Rad Laboratories, Inc., Hercules, CA) with bovine serum albumin as a standard and MGMT activity was expressed as fmol/mg protein.
2.3. MSP Analysis on Human MGMT Gene Promoter
Genomic DNA was extracted either from 5 - 15 mg of solid tissue or from 2 × 10⁶ cultured cells using a Gentra Puregene DNA purification kit (QIAGEN, Germany) according to the manufacturer’s manual. Purified DNA was quantified using a TBS-380 mini-fluorometer (Turner BioSystems, Sunnyvale, CA) using Hoechst 33258 dye and calf thymus DNA as a standard according to the manufacturer’s protocol. DNA (2.5 µg) was subjected to a bisulfite conversion reaction using an EpiMark bisulfite Conversion kit (New England Biolabs, Inc., Ipswich, MA) according to the manufacturer’s instruction manual. For PCR, sets of primer sequences described by Esteller et al. [23,24] were employed: for the unmethylated reaction; 5’-TTTGTGTTTTGATGTTTGTAGGTTTTTGT-3’(U- 93-F) and 5’-AACTCCACACTCTTCCAAAAACAAA ACA-3’(U-93-R) and for the methylated reaction; 5’- TTTCGACGTTCGTAGGTTTTCGC-3’ (M-81-F) and 5’- GCACTCTTCCGAAAACGAAACG-3’ (M-81-R). The PCR reaction mixture consisted of 4 µl of the bisulfite modified DNA eluate (40 µl), 1× PCR reaction buffer, 0.2 mM dNTP mixture, 0.2 µM each forward and reverse primer, and 1 unit of TaKaRa Taq HS (Takara Bio Inc., Japan) in a volume of 25 µl. The thermocycling protocol consisted of 40 cycles of 95˚C for 45 seconds, 60˚C for 45 seconds and 72˚C for 60 seconds. PCR products were subjected to 3% MetaPhor agarose (Cambrex Bio Science, Rockland, ME) horizontal gel electrophoresis with TBE buffer containing 0.5 µg/ml of ethidium bromide.
2.4. Human Tumor Cell Lines
Human tumor cell lines of known MGMT content were described previously [17] except that HeLa cells were purchased from the American Type Culture Collection (Manassas, VA). The MGMT content of HeLa cells was determined using the alkyl-transfer assay [17].
2.5. Western Blot Analyses
Two procedures were employed for sample preparation. The first procedure involved solubilization of intact cultured cells (5 × 10⁶ cells) or tissue fragments (20 mg) in 0.25 ml of 2× Laemmli’s sample buffer [25] followed by denaturation at 100˚C for 7 minutes. Cultured cells were washed once with cold phosphate buffered saline and blended in 2× Laemmli’s sample buffer using pipette tips. Tissue fragments were ground in 2× Laemmli’s sample buffer using 8.5 cm-long pestles and 1.5 ml tubes (19923- 0000, Bel-Art Products, South Wayne, NJ).
In the second procedure, cultured cells were washed once with cold phosphate buffered saline, suspended at a density of 5 × 10⁷ cells/ml in 50 mM Tris-HCl (pH 7.5) buffer in the presence or absence of 1× Halt Protease & Phosphatase Inhibitor Cocktail (78440, Thermo Scientific, Rockford, IL), and sonicated 4 times in short bursts on ice. Tissue homogenates were prepared as described in the alkyl-transfer assay in 50 mM Tris-HCl (pH 7.5) buffer in the absence or presence of the cocktail of protease and phosphatase inhibitors. The homogenates from cultured cells or tissue fragments were mixed with an equal volume of 2× Laemmli’s sample buffer and denatured at 100˚C for 7 minutes.
The tissue or cell homogenates (80 µg of protein/lane), whole tissue extracts (20 µl/1.6 mg tissue/lane), and whole cell extracts (20 µl/5 × 104 cells/lane), were resolved by 0.1% SDS-10% or 12.5% PAGE. Following conventional western procedures, chemiluminescent images were captured using G:Box iChemi XR (Syngene, Frederick, MD). Mouse monoclonal anti-human MGMT antibody (clone MT 3.1) was from Millipore (Temecula, CA). Rabbit polyclonal anti-human MGMT antibody (ab69629) was from Abcam (Cambridge, MA). Goat polyclonal anti-human MGMT antibody (AF3794) was from R&D Systems, Inc. Rabbit polyclonal anti-ubiquitin antibody (sc-9133) and goat polyclonal anti-HSC 70 antibody (sc-1059) were from Santa Cruz Biotechnology (Santa Cruz, CA).
2.6. Measurement of Signal Intensity
Signal intensities of images from MSP and western blots were measured using ImageJ (rsbweb.nih.gov/ij/) according to the formula: [(mean brightness of the selected area—mean brightness of the background of an equal area) × the area].
2.7. Statistics
The strength of the linear relationship between two variables was quantified using Pearson’s coefficient of correlation (r, ) where the values 1 and −1 represent perfect positive and negative correlations, respectively, and the value 0 represents no linear correlation.
3. Results
3.1. The Interrogated Region of the MGMT Gene Promoter for MSP Analyses
Human cell lines have been historically categorized as mer+/− (N-methyl-N'-nitro-N-nitrosoguanidine damage repair) [26] or mex+/− (methyl excision) [27] phenotype according to the resistance/sensitivity to guanine O6- methylating agents until the entity responsible for the phenotype was identified as MGMT. A subset of cultured cell lines completely lacks MGMT expression due to the absence of MGMT mRNA [28]. The promoter region ranging from −480 to +300 relative to the transcription start site (+1) [29] of the human MGMT gene is comprised of a CpG island with 73.8% GC content and 98 CpG sequences (Figure 1(a)), and methylation sensitive restriction endonuclease analyses have established a link between promoter methylation and gene silencing [30]. However, not all CpG sites in the non-expressor promoter are methylated [31]. Bisulfite sequencing applied to the region from −260 to +270 resulted in the identification of “methylation hot spots” (−249 to −103 and +107 to +196; black boxes in Figure 1(a)) in the nonexpressor promoter [32].
The unmethylated and methylated primer sets described by Esteller et al. [23,24] amplify from +110 to +202 and from +116 to +196, giving rise to 93 and 81 bp of unmethylated and methylated PCR products, respectively (Figure 1(b)). This interrogated region coincides with one of the methylation hot spots. These primer sets were employed in this study because of the widespread usage of this interrogated region in glioma studies.
3.2. MGMT Expression Examined by Alkyl-Transfer Assays, MSP and Western Blots in Human Tumor Cell Lines
Alkyl-transfer assays using [benzene-3H]O6-benzylguanine (3H-BG) enable incubation of intact cultured cells with the labeled substrate, and readily assess MGMT activity as the number of functional MGMT molecules/ cell [17]. Using this assay, we previously identified human tumor cell lines with graded MGMT activities ranging from null to 42,000 molecules/cell [17].
 (a)
(a)  (b)
(b)
Figure 1. The CpG island of the human MGMT gene promoter and the interrogated region in the MSP analysis. (a) A vertical bar represents a CpG dinucleotide. The transcriptional start site (+1) corresponds to 46,816 of AL355531 in the GenBank database; (b) The DNA sequence of the primer region prior to bisulfite conversion, the oligomers (U-93-F and U-93-R) for the unmethylated product, and the oligomers (M-81-F and M-81-R) for the methylated product, are shown. The CpG sequence and base difference resulting from bisulfite conversion are underlined. Note that the primers are designed on the single strand, because double strands are no longer complementary after bisulfite conversion.
To examine whether epigenetic gene silencing by promoter methylation accounted for the variability, MSP consisting of sodium bisulfite conversion of genomic DNA followed by PCR amplification of the interrogated region using primer sets specific for unmethylated and methylated DNA, was conducted. The unmethylated 93-bp PCR product was predominantly generated in high expressors (42,000 MGMT molecules/cell) such as DU145 and HeLa cells, whereas the methylated 81-bp product was predominantly generated in MGMT null cell lines such as TF-1, U-937 and U251 cells (Figure 2(a)). In intermediate MGMT expressors such as HL-60 (17,000), NB4 (8,500) and A549 (6,600) cells, both U and M products were generated (Figure 2(a)). The percent of promoter methylation was negatively correlated with MGMT activity (molecules/cell), with the correlation coefficient (r) of −0.93 (Figure 2(c), left).
MSP analyses do not clarify whether the MGMT locus is hemi-methylated or the MGMT locus is partially methylated on both alleles in intermediate MGMT expressors. NB4 and A549 cells with substantial methylation signal output are highly resistant (17- and 11-fold, respectively) to temozolomide measured under MGMTintact and MGMT-abrogated conditions (data not shown), indicating that the presence of methylation signals per se does not guarantee sensitivity to temozolomide.
The MGMT protein in cell lines migrated as a single band in western analyses (Figure 2(b), top). The signal intensity of the MGMT protein was positively correlated with MGMT activity, with an r of +0.98 (Figure 2(c), right). Since promoter methylation is linked to epigenetic gene silencing, these results demonstrate the straightforward relationship between gene silencing, MGMT protein expression and functional MGMT activity in human tumor cell lines.
3.3. Functional MGMT Activity in Tumors and Matched Normal Adjacent Tissue
For simpler presentation, sets of malignant (m) and matched normal (n) adjacent tissue from the colon (C), kidney (K), lung (Lg) and liver (Lv) were renamed and chronologically renumbered. Alkyl-transfer assays used to measure MGMT activity in clinical samples relied upon covalent transfer of radioactive benzyl moieties from 3H-BG to MGMT. After incubation of tissue homogenates with 3H-BG, 70% methanol precipitates containing 3H-benzylated MGMT were thoroughly washed to remove unreacted 3H-BG. Figure 3(a) summarizes MGMT activity expressed as fmol/mg protein in a total of 66 malignant and matched normal tissue samples. Variability in MGMT activity in tumors and normal tissue is shown in the range (R) and mean ± SD (M). The range and mean of MGMT activity in various organs in Figure 3(a) are in agreement with those from the traditional assay using DNA reacted with N-[3H]methylN-nitrosourea [9,10]. It is notable that tumor selective 4- to 5-fold reduction in MGMT activity occurred in K7, K8 and Lv2 (squared and marked with * in Figure 3(a)), albeit at a low frequency (2/12 = 0.17 in the kidney; 3/33 = 0.09 in the combined organs).
Figure 3(b) shows the data rearranged according to the MGMT activity in normal tissue in a column format. MGMT activity in the majority of tumors from the colon

Figure 2. MGMT expression examined by alkyl-transfer assays, MSP and western blots in human cell lines. (a) Cell lines with graded levels of MGMT activity were subjected to MSP analysis. U and M represent unmethylated (93 bp) and methylated (81 bp) PCR products, respectively. The percent of methylation is based on the formula [(M/U + M) × 100]; (b) Cells were directly solubilized in 2× Laemmli’s sample buffer. The extracts (20 µl/5 × 104 cells/lane) were resolved on 10%-PAGE and probed with monoclonal anti-human MGMT antibody MT3.1. The blot was reprobed with anti-HSC 70 antibody to show that each lane was loaded with a cell extract; (c) The two-way scatter plots of the variables are shown with the Pearson’s correlation coefficient (r).
(10/13 = 0.77) and lung (4/6 = 0.67) was higher than or similar to that in matched normal tissue, while MGMT activity in tumors from the kidney was generally (10/12 = 0.83) lower than in normal adjacent tissue.
3.4. Promoter Methylation Analyzed by MSP in Tumors and Normal Adjacent Tissue
Genomic DNA, extracted from 33 sets of tumors and matched normal tissue, was subjected to MSP analyses (Figure 4(a)). The two numbers in parenthesis under each gel image indicate MGMT activity in fmol/mg protein on the left, and % methylated signal on the right. Promoter methylation was not confined to tumors, occurring in adjacent normal tissue in the colon and kidney. Promoter methylation independently occurred in normal colon except for C8, which was positive in both tumor and normal tissue. The percent of the methylation signal exceeding 5 was arbitrarily considered positive and the frequency of methylation in each organ was calculated (Figure 4(b)). Normal colon (7/13 = 0.54) has a higher methylation frequency than colon tumor (3/13 = 0.23). In the kidney, the methylation frequency was equal (2/12 = 0.17) in tumor and normal tissue. In the lung, methylation occurred only in the tumor (2/6 = 0.33).
While the 4 samples with the percent of methylation exceeding 40 showed relatively low MGMT activity, many samples devoid of methylation had little MGMT activity (Figure 4(c)). The overall correlation between the percent of promoter methylation and MGMT activity was poor in human specimens (r = −0.15, Figure 4(c)). In addition, promoter methylation was notably absent in the sets in which tumor-selective reduction in MGMT activity occurred (K7, K8 and Lv-2, squared and marked with * in Figure 4(a)), suggesting that the decreases in MGMT activity in these tumors were caused by a mechanism independent of gene silencing.
3.5. The MGMT Protein Analyzed by Western Immunoblots
Tissue homogenates from alkyl-transfer assays were mixed with an equal volume of 2× Laemmli’s sample buffer, and subjected to western analysis using mouse
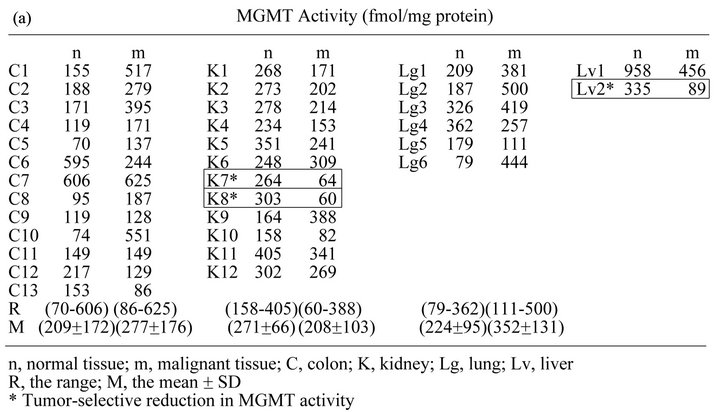
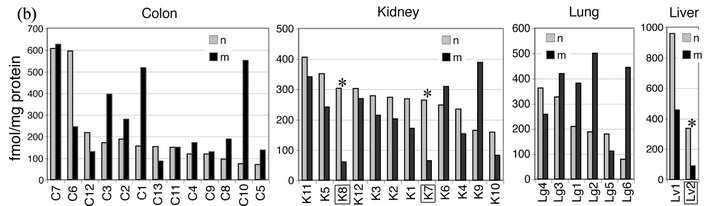
Figure 3. MGMT activity determined by alkyl-transfer assays in tumors and matched normal tissue from the colon, kidney, lung and liver. (a) MGMT activity (fmol/mg protein) in normal (n) and malignant (m) tissue from the colon (C), kidney (K), Lung (Lg) and Liver (Lv) was determined using 3H-BG. The standard deviation of the triplicate determinations was less than 5% of the mean and not shown. The pairs with tumor selective reductions in MGMT activity (K7, K8 and Lv2) are squared and marked with *; (b) The data are presented according to the MGMT activity in normal tissue in a column format.

Figure 4. Promoter methylation of the MGMT gene analyzed by MSP in tumors and matched normal tissue. (a) U and M are 93 bp unmethylated and 81 bp methylated PCR products, respectively. The two numbers in parenthesis under the gel image are MGMT activity in fmol/mg protein on the left and % methylated signal on the right; (b) The percent of promoter methylation exceeding 5 is considered as positive; (c) The data from a total of 66 tissue specimens are analyzed for correlation between MGMT activity and promoter methylation.
monoclonal anti-human MGMT antibody MT3.1 [33]. HL-60 human leukemia cell extract was included as a control. Figure 5(a) shows that tissue MGMT differs from cell line MGMT in western presentation in that tissue MGMT is heterogeneous around its molecular size (22 kDa) between the 20.1 and 30 kDa markers, as well as at much higher masses between the 45 and 66.5 kDa markers. Cell line MGMT co-migrated with the slowest mobility species of tissue MGMT at its size. Since the MGMT protein in cell lines and tissue has been shown to be a phosphoprotein [34-38], these observations suggest that tissue MGMT exists as a mixture with different degrees of phosphorylation. Heterogeneity of the MGMT protein has been reported in human spleen [39,40], human liver [41] and in rat liver [37,38].
The higher molecular mass signals between the 45 and 66.5 kDa markers were prominent in tissue homogenates but not in the cell line extract (Figure 5(a)). To examine whether these patterns were due to non-specific binding of the MT3.1 antibody to proteins present in tissue homogenates, multiple blots each containing homogenates from DU145 and HL-60 (cell lines), and from K1-n and Lv1-m (tissue), were prepared and probed with different anti-MGMT antibodies (Figure 5(b)). The higher molecular masses were detected with mouse, rabbit and goat anti-MGMT antibodies only in tissue homogenates as indicated by the arrows in Figure 5(b). The recognition by these antibodies likely possessing distinct epitopes suggests that they are not derived from non-specific binding.
Ubiquitin-mediated degradation of alkylated or inactive forms of MGMT has been demonstrated in various human tissue [40] and cell lines [42,43]. Thus, it is possible that the higher molecular masses represent poly-

Figure 5. Heterogeneity of the MGMT protein in human tissue revealed by western immunoblots. (a) Tissue homogenates (80 µg of protein/lane) from alkyl-transfer assays and HL-60 extract (5 × 10⁴ cells/lane) were resolved on 10% PAGE and subjected to western analysis using mouse monoclonal anti-MGMT antibody (clone MT 3.1); (b) Cell line homogenates (HL-60 and DU145, 40 µg/lane) and tissue homogenates (K1-n and Lv1-m, 80 µg/lane) were resolved on 12.5% PAGE. The three identical blots were prepared, and probed with MT3.1 (raised against purified recombinant human MGMT), rabbit polyclonal anti-MGMT antibody (raised against a synthetic peptide derived from the internal region of human MGMT), and goat anti-MGMT antibody (raised against purified recombinant human MGMT). Stripping and reprobing were not involved; (c) Cell line homogenates (HL-60 and DU145, 80 µg/lane) and tissue homogenates (K1-n and Lv1-m, 80 µg/lane) were resolved on 12.5% PAGE and probed with rabbit polyclonal anti-ubiquitinin antibody.
ubiquitinated forms of MGMT. To investigate this possibility, immunoprecipitation of MGMT with an antiMGMT antibody followed by western analysis of the immune complex using anti-ubiquitin antibody was attempted. This approach, however, was unsuccessful due to the difficulty in optimizing antigen-antibody binding conditions in tissue homogenates and cell lysates, apart from the limitation stemming from the fact that the sizes of MGMT and the higher molecular masses were close to those of immunoglobulin light chains (~23 kDa) and heavy chains (~51 kDa), respectively.
The blot containing the homogenates of cell lines and tissue was probed with rabbit anti-ubiquitin antibody. Figure 5(c) shows that strong signals of ubiquitinated proteins are located between the 45 and 66.5 kDa markers in both cell lines and tissue.
The samples for western blots were prepared either by directly solubilizing tissue fragments/cultured cells in 2× Laemmli’s sample buffer or by first homogenizing tissue fragments/cultured cells in the presence or absence of a cocktail of protease and phosphatase inhibitors. The western patterns were reproducible regardless of the procedure employed (data not shown).
3.6. Relationship between Western Signals and MGMT Activity
The higher molecular mass signals were present in all tissue homogenates (data not shown). For quantitation purposes, the MGMT signals near it molecular size between the 20.1 and 30 kDa markers in the total of 33 sets of tumors and matched normal tissue are shown in Figures 6(a) to (f). The numbers above the tissue name and the numbers below the western image are MGMT activities in fmol/mg protein and intensities of the western signals in arbitrary units, respectively. Tumor selective 4- to 5-fold reductions in MGMT activity in K7, K8, and Lv2, identified by alkyl-transfer assays (Figure 3(a)) were replicated in the western analyses, with the extent of reduction being slightly larger in magnitude (4- to 10-fold, squared and marked with * in Figures 6(b) and (f)). Since the signal intensities from separate blots were not comparable, correlations between western signal intensities and MGMT activities were determined for each
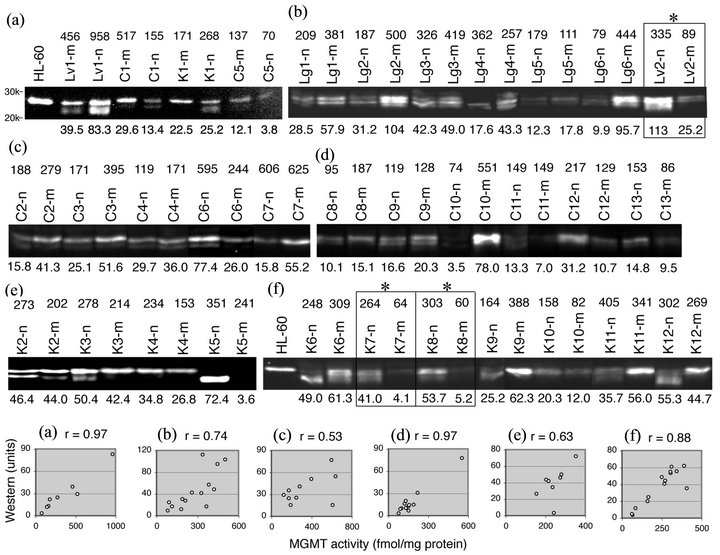
Figure 6. Relationship between the MGMT protein and MGMT activity in tumors and matched normal tissue. (a) to (f) Tissue homogenates (80 µg of protein/lane) from alkyl-transfer assays, HL-60 cell extract (in (a)) or HL-60 cell homogenate (in (f)) were resolved on 10% PAGE and probed with mouse monoclonal anti-MGMT antibody (clone MT 3.1). The MGMT content of HL-60 cells is 172 fmol/mg protein (17,000 MGMT molecules/cell). Only signals between the 20 and 30 kDa markers are shown for quantitation. The number above the tissue name is MGMT activity in fmol/mg protein and the number below the western image is signal intensity in arbitrary units. The sets with tumor-selective reduction in MGMT activity (K7, K8 and Lv2) were squared and marked with *. The scatter plots were made for each blot (a) to (f).
blot (Figure 6, bottom). The correlation coefficients ranged from + 0.53 (blot (c)) to + 0.97 (blot (a)), indicating a positive correlation between the two variables. Of the 33 sets of tumors and normal tissue, K5 was exceptional in that K5-n consisted of an unusually faster mobility species with the loss of the western signal in K5-m (Figure 6(e)) despite the functional MGMT activity (241 fmol/mg protein).
It is noteworthy that the transition from heterologous forms to the slowest mobility form coincides with the transformation from normalcy to malignancy in some sets. This shift was pronounced in kidney tumors (examples: K1 in Figure 6(a); K3 in Figure 6(e); K6, K9, K11 and K12 in Figure 6(f)).
4. Discussion
Since tumor specimens are inevitably contaminated with unknown amounts of normal constituents, values derived from assays involving tissue disruption suffer from normal cell input. Immunohistochemical staining that distinguishes tumor from normal cells, and MSP that relies upon the assumption that promoter methylation is tumor specific, are the most frequently used assays for MGMT expression in clinical studies, although the relationship between the two parameters is questionable [19]. The importance of functional MGMT assays is mostly ignored due to assay complexity and the usage of 3H. We have conducted this study on the principle that 1) functional MGMT activity is the ultimate predictor of response to guanine O6-alkylating agents, and 2) surrogate MGMT assays such as MSP and immunohistochemical staining must be validated for correlation with MGMT activity. Our report is distinguishable from other studies in that tumor versus matched normal tissue, and tissue specimens versus tumor cell lines, are compared for MGMT expression using three distinctive methods.
In human cell lines with various MGMT activities, a straightforward cause-effect relationship was found between epigenetic gene silencing via promoter methylation, the level of the MGMT protein and functional MGMT activity. In contrast, the correlation between the percent of promoter methylation and MGMT activity was weak in tissue specimens. Moreover, promoter methylation occurred independently in normal adjacent colon tissue at a higher frequency than in colon tumors, ruling out the possibility that it is universally tumor specific. Shen et al. [44] reported a similar phenomenon in colon tumors and normal colon tissue. Interestingly, MGMT gene promoter methylation is a phenomenon independent of CpG island methylator phenotype (CIMP) in colorectal cancer [45].
The procedure for MSP in this study is different from that in glioma studies [18]. In this study, MSP was measured according to the method originally described by Estellar et al. [23,24]. DNA was extracted from 5 - 15 mg of a tissue fragment and the percent of promoter methylation was derived from the formula [M/(U + M) × 100]. In the glioma studies [18], DNA was extracted from frozen or paraffin sections where areas of normal tissue or necrosis were removed. PCR was performed using a nested, two-stage approach and the extent of methylation was expressed as the ratio of methylated MGMT gene to the reference gene ß-actin. Therefore, the data from different tumor types obtained with different procedures are not directly comparable.
Using functional MGMT assays, MSP and immunohistochemistry in malignant glioma, Maxwell et al. [46] reported that the correlation of immunochemical staining to MGMT activity was statistically significant, whereas the correlation between MGMT activity and MSP was not. A similar study involving pretreatment and recurrent malignant glioma, astrocytoma and 48 cultured cell lines, Christmann et al. [47] reported a complex relationship between MGMT activity, MGMT gene promoter methylation and immunohistochemical staining, with the conclusion that an overall correlation between promoter methylation and lack/low MGMT activity existed in tumor specimens and that MSP was superior to immunohistochemistry.
Human MGMT consists of 207 amino acids with a molecular mass of 21,645 Da. Western immunoblots have infrequently been used to analyze the MGMT protein in tumors and normal tissue. The data available on CNS specimens are limited in sample size and quality [48-50]. Western blots are advantageous over immunohistochemical staining in that signals are easily quantifiable and they simultaneously allow qualitative analyses. The western analyses unexpectedly revealed that tissue MGMT is significantly different from cell line MGMT, possibly at the level of post-translational modifications. Tissue MGMT appeared to consist of a mixture of different levels of likely phosphorylation and possibly ubiquitination. Although further studies are required to determine the definitive nature of these modifications, the observations in this study suggest that the signals in immunohistochemical staining partially derive from inactive forms of MGMT. Western signal intensity between the 20.1 and 30 kDa markers was positively correlated with MGMT activity with correlation coefficients between 0.57 and 0.97.
The NetPhos 2.0 Server (http://www.cbs.dtu.dk/services/NetPhosK) that allows computerized prediction of phosphorylation sites with the score of 0 to 1, yields 5 serine sites and 1 threonine site with high scores of 0.748 to 0.980 clustered in N-terminal and C-terminal portions of human MGMT. The tyrosine (Y) 114 site receives a low score of 0.439.
One of the striking phenomena observed in this study is the tumor-specific transition of MGMT to the slowest mobility, likely the highest phosphorylated form. This transition is consistent with a generally elevated phosphorylation state of tumors due to increased kinase activity or decreased phosphatase activity. Extensive phosphorylation may decrease DNA binding ability and/or activity of MGMT and trigger ubiquitination conjugation for proteasomal degradation. The conserved Y114 residue is located at the beginning of the helix-turn-helix DNA binding motif. Crystal structures of MGMT in complex with substrate DNA suggest a mechanism in which Y114 promotes the flipping of the alkylated nucleotide into the active site pocket [4]. Thus, phosphorylation of Y114 can produce profound functional impairment in nucleotide flipping and/or DNA binding. Therefore, it is tempting to speculate that tumor-selective reduction in MGMT activity found in K7, K8 and Lv2 is attributable to tumor induced phosphorylation of Y114.
We analyzed MGMT expression in sets of human tumors and matched normal tissue from the colon, kidney, lung and liver. The dose-limiting toxicity of chloroethylnitrosoureas is myelosuppression due to low levels of MGMT in myeloid precursors [51,52]. Tumors expressing sufficiently lower MGMT activity than myeloid precursors were found in this study, albeit at a low frequency (3/33 = ~0.1). Since MGMT activity in those tumors can be titrated out by pretreatment with temozolomide before the normal tissue, we believe that these tumors are legitimate therapeutic targets for laromustine. Contrary to our expectation, gene silencing through promoter methylation did not appear to be the mechanism for the MGMT reduction in those tumors. Promoter methylation was originally discovered in MGMT negative cell lines. MSP is currently used to predict the responsiveness of CNS tumors to temozolomide. The marked differences in the control of MGMT expression observed between clinical specimens and cell lines highlight the pitfalls of translating a cell line phenomenon into a clinical procedure.
5. Acknowledgements
This work was supported by CA-122112 and CA-129186 from the National Cancer Institute, K12 HD047018 from the Eunice Kennedy Shriver National Institute of Child Health and Human Development, and a grant from the National Foundation for Cancer Research. We express our gratitude to Dr. Bret L. Halpern for his critical reading of the manuscript.
REFERENCES
- A. E. Pegg, “Multifaceted Roles of Alkyltransferase and Related Proteins in DNA Repair, DNA Damage, Resistance to Chemotherapy, and Research Tools,” Chemical Research in Toxicology, Vol. 24, No. 5, 2011, pp. 618- 639. doi:10.1021/tx200031q
- M. Christmann, B. Verbeek, W. P. Roos and B. Kaina, “O6-Methylguanine-DNA Methyltransferase (MGMT) in Normal Tissues and Tumors: Enzyme Activity, Promoter Methylation and Immunohistochemistry,” Biochimica et Biophysica Acta, Vol. 1816, No. 2, 2011, pp. 179-190.
- B. Kaina, M. Christmann, S. Naumann and W. P. Roos, “MGMT: Key Node in the Battle against Genotoxicity, Carcinogenicity and Apoptosis Induced by Alkylating Agents,” DNA Repair, Vol. 6, No. 8, 2007, pp. 1079- 1099. doi:10.1016/j.dnarep.2007.03.008
- J. L. Tubbs, A. E. Pegg and J. A. Tainer, “DNA Binding, Nucleotide Flipping, and the Helix-Turn-Helix Motif in Base Repair by O6-Alkylguanine-DNA Alkyltransferase and Its Implications for Cancer Chemotherapy,” DNA Repair, Vol. 6, No. 8, 2007, pp. 1100-1115. doi:10.1016/j.dnarep.2007.03.011
- S. L. Gerson, “MGMT: Its Role in Cancer Aetiology and Cancer Therapeutics,” Nature Reviews Cancer, Vol. 4, No. 4, 2004, pp. 296-307. doi:10.1038/nrc1319
- K. Ishiguro, Y. L. Zhu, K. Shyam, P. G. Penketh, R. P. Baumann and A. C. Sartorelli, “Quantitative Relationship between Guanine O6-Alkyl Lesions Produced by Onrigin and Tumor Resistance by O6-Alkylguanine-DNA Alkyltransferase,” Biochemical Pharmacology, Vol. 80, No. 9, 2010, pp. 1317-1325. doi:10.1016/j.bcp.2010.07.022
- T. P. Brent and J. S. Remack, “Formation of Covalent Complexes between Human O6-Alkylguanine-DNA Alkyltransferase and BCNU-Treated Defined Length Synthetic Oligodeoxynucleotides,” Nucleic Acids Research, Vol. 16, No. 14B, 1988, pp. 6779-6788. doi:10.1093/nar/16.14.6779
- R. Stupp, W. P. Mason, M. J. van den Bent, M. Weller, B. Fisher, M. J. Taphoorn, K. Belanger, A. A. Brandes, C. Marosi, U. Bogdahn, J. Curschmann, R. C. Janzer, S. K. Ludwin, T. Gorlia, A. Allgeier, D. Lacombe, J. G. Cairncross, E. Eisenhauer and R. O. Mirimanoff, “Radiotherapy Plus Concomitant and Adjuvant Temozolomide for Glioblastoma,” The New England Journal of Medicine, Vol. 352, No. 10, 2005, pp. 987-996. doi:10.1056/NEJMoa043330
- S. L. Gerson, J. E. Trey, K. Miller and N. A. Berger, “Comparison of O6-Alkylguanine-DNA Alkyltransferase Activity Based on Cellular DNA Content in Human, Rat and Mouse Tissues,” Carcinogenesis, Vol. 7, No. 5, 1986, pp. 745-749. doi:10.1093/carcin/7.5.745
- R. C. Grafstrom, A. E. Pegg, B. F. Trump and C. C. Harris, “O6-Alkylguanine-DNA Alkyltransferase Activity in Normal Human Tissues and Cells,” Cancer Research, Vol. 44, No. 7, 1984, pp. 2855-2857.
- C. S. Brock, E. S. Newlands, S. R. Wedge, M. Bower, H. Evans, I. Colquhoun, M. Roddie, M. Glaser, M. H. Brampton and G. J. Rustin, “Phase I Trial of Temozolomide Using an Extended Continuous Oral Schedule,” Cancer Research, Vol. 58, No. 19, 1998, pp. 4363-4367.
- K. Shyam, P. G. Penketh, R. H. Loomis, W. C. Rose and A. C. Sartorelli, “Antitumor 2-(Aminocarbonyl)-1,2-bis (methylsulfonyl)-1-(2-chloroethyl)-hydrazines,” Journal of Medicinal Chemistry, Vol. 39, No. 3, 1996, pp. 796-801. doi:10.1021/jm9505021
- P. G. Penketh, K. Shyam and A. C. Sartorelli, “Comparison of DNA Lesions Produced by Tumor-Inhibitory 1,2- Bis(sulfonyl)hydrazines and Chloroethylnitrosoureas,” Biochemical Pharmacology, Vol. 59, No. 3, 2000, pp. 283- 291. doi:10.1016/S0006-2952(99)00328-7
- M. A. Badruddoja, S. T. Keir, I. King, J. Zeidner, J. J. Vredenburgh, L. H. Muhlbaier, D. D. Bigner and H. S. Friedman, “Activity of VNP40101M (Cloretazine) in the Treatment of CNS Tumor Xenografts in Athymic Mice,” Neuro-Oncology, Vol. 9, No. 3, 2007, pp. 240-244. doi:10.1215/15228517-2007-011
- F. Giles, D. Rizzieri, J. Karp, N. Vey, F. Ravandi, S. Faderl, K. D. Khan, G. Verhoef, P. Wijermans, A. Advani, G. Roboz, H. Kantarjian, S. F. Bilgrami, A. Ferrant, S. M. Daenen, V. Karsten, A. Cahill, M. Albitar, G. Mufti and S. O’Brien, “Cloretazine (VNP40101M), a Novel Sulfonylhydrazine Alkylating Agent, in Patients Age 60 Years or Older with Previously Untreated Acute Myeloid Leukemia,” Journal of Clinical Oncology, Vol. 25, No. 1, 2007, pp. 25-31. doi:10.1200/JCO.2006.07.0961
- O. Wiestler, P. Kleihues and A. E. Pegg, “O6-Alkylguanine-DNA Alkyltransferase Activity in Human Brain and Brain Tumors,” Carcinogenesis, Vol. 5, No. 1, 1984, pp. 121-124. doi:10.1093/carcin/5.1.121
- K. Ishiguro, K. Shyam, P. G. Penketh and A. C. Sartorelli, “Development of an O6-Alkylguanine-DNA Alkyltransferase Assay Based on Covalent Transfer of the Benzyl Moiety from [Benzene-3H]O6-Benzylguanine to the Protein,” Analytical Biochemistry, Vol. 383, No. 1, 2008, pp. 44-51. doi:10.1016/j.ab.2008.08.009
- M. E. Hegi, L. Liu, J. G. Herman, R. Stupp, W. Wick, M. Weller, M. P. Mehta and M. R. Gilbert, “Correlation of O6-Methylguanine Methyltransferase (MGMT) Promoter Methylation with Clinical Outcomes in Glioblastoma and Clinical Strategies to Modulate MGMT Activity,” Journal of Clinical Oncology, Vol. 26, No. 25, 2008, pp. 4189-4199. doi:10.1200/JCO.2007.11.5964
- M. Weller, R. Stupp, G. Reifenberger, A. A. Brandes, M. J. van den Bent, W. Wick and M. E. Hegi, “MGMT Promoter Methylation in Malignant Gliomas: Ready for Personalized Medicine?” Nature Reviews Neurology, Vol. 6, No. 1, 2010, pp. 39-51. doi:10.1038/nrneurol.2009.197
- G. Isowa, K. Ishizaki, T. Sadamoto, K. Tanaka, Y. Yamaoka, K. Ozawa and M. Ikenaga, “O6-MethylguanineDNA Methyltransferase Activity in Human Liver Tumors,” Carcinogenesis, Vol. 12, No. 7, 1991, pp. 1313- 1317. doi:10.1093/carcin/12.7.1313
- G. J. Kitange, B. L. Carlson, A. C. Mladek, P. A. Decker, M. A. Schroeder, W. Wu, P. T. Grogan, C. Giannini, K. V. Ballman, J. C. Buckner, C. D. James and J. N. Sarkaria, “Evaluation of MGMT Promoter Methylation Status and Correlation with Temozolomide Response in Orthotopic Glioblastoma Xenograft Model,” Journal of Neuro-Oncology, Vol. 92, No. 1, 2009, pp. 23-31. doi:10.1007/s11060-008-9737-8
- L. Zhang, W. Lu, X. Miao, D. Xing, W. Tan and D. Lin, “Inactivation of DNA Repair Gene O6-MethylguanineDNA Methyltransferase by Promoter Hypermethylation and Its Relation to p53 Mutations in Esophageal Squamous Cell Carcinoma,” Carcinogenesis, Vol. 24, No. 6, 2003, pp. 1039-1044. doi:10.1093/carcin/bgg062
- M. Esteller, S. R. Hamilton, P. C. Burger, S. B. Baylin and J. G. Herman, “Inactivation of the DNA Repair Gene O6-Methylguanine-DNA Methyltransferase by Promoter Hypermethylation Is a Common Event in Primary Human Neoplasia,” Cancer Research, Vol. 59, No. 4, 1999, pp. 793-797.
- M. Esteller, J. Garcia-Foncillas, E. Andion, S. N. Goodman, O. F. Hidalgo, V. Vanaclocha, S. B. Baylin and J. G. Herman, “Inactivation of the DNA-Repair Gene MGMT and the Clinical Response of Gliomas to Alkylating Agents,” The New England Journal of Medicine, Vol. 343, No. 19, 2000, pp. 1350-1354. doi:10.1056/NEJM200011093431901
- U. K. Laemmli, “Cleavage of Structural Proteins during the Assembly of the Head of Bacteriophage T4,” Nature, Vol. 227, No. 5259, 1970, pp. 680-685. doi:10.1038/227680a0
- R. S. Day III, C. H. J. Ziolkowski, D. A. Scudiero, S. A. Meyer and M. R. Mattern, “Human Tumor Cell Strains Defective in the Repair of Alkylation Damage,” Carcinogenesis, Vol. 1, No. 1, 1980, pp. 21-32. doi:10.1093/carcin/1.1.21
- R. Sklar and B. Strauss, “Removal of O6-Methylguanine from DNA of Normal and Xeroderma Pigmentosum-Derived Lymphoblastoid Lines,” Nature, Vol. 289, No. 5796, 1981, pp. 417-420. doi:10.1038/289417a0
- R. A. Kroes and L. C. Erickson, “The Role of mRNA Stability and Transcription in O6-Methylguanine DNA Methyltransferase (MGMT) Expression in Mer+ Human Tumor Cells,” Carcinogenesis, Vol. 16, No. 9, 1995, pp. 2255-2257. doi:10.1093/carcin/16.9.2255
- L. C. Harris, P. M. Potter, K. Tano, S. Shiota, S. Mitra and T. P. Brent, “Characterization of the Promoter Region of the Human O6-Methylguanine-DNA Methyltransferase Gene,” Nucleic Acids Research, Vol. 19, No. 22, 1991, pp. 6163-6167. doi:10.1093/nar/19.22.6163
- M. A. von Wronski, L. C. Harris, K. Tano, S. Mitra, D. D. Bigner and T. P. Brent, “Cytosine Methylation and Suppression of O6-Methylguanine-DNA Methyltransferase Expression in Human Rhabdomyosarcoma Cell Lines and Xenografts,” Oncology Research, Vol. 4, No. 4-5, 1992, pp. 167-174.
- X. Qian, M. A. von Wronski and T. P. Brent, “Localization of Methylation Sites in the Human O6-Methylguanine-DNA Methyltransferase Promoter: Correlation with Gene Suppression,” Carcinogenesis, Vol. 16, No. 6, 1995, pp. 1385-1390. doi:10.1093/carcin/16.6.1385
- X. C. Qian and T. P. Brent, “Methylation Hot Spots in the 5' Flanking Region Denote Silencing of the O6-Methylguanine-DNA Methyltransferase Gene,” Cancer Research, Vol. 57, No. 17, 1997, pp. 3672-3677.
- L. C. Harris, P. M. Potter, J. S. Remack and T. P. Brent, “A Comparison of Human O6-Methylguanine-DNA Methyltransferase Promoter Activity in Mer+ and Mer− Cells,” Cancer Research, Vol. 52, No. 22, 1992, pp. 6404- 6406.
- K. S. Srivenugopal, S. R. Mullapudi, J. Shou, T. K. Hazra and F. Ali-Osman, “Protein Phosphorylation Is a Regulatory Mechanism for O6-Alkylguanine-DNA Alkyltransferase in Human Brain Tumor Cells,” Cancer Research, Vol. 60, No. 2, 2000, pp. 282-287.
- S. R. Mullapudi, F. Ali-Osman, J. Shou and K. S. Srivenugopal, “DNA Repair Protein O6-AlkylguanineDNA Alkyltransferase Is Phosphorylated by Two Distinct and Novel Protein Kinases in Human Brain Tumour Cells,” Biochemical Journal, Vol. 351, No. 2, 2000, pp. 393-402. doi:10.1042/0264-6021:3510393
- K. S. Srivenugopal, S. R. Mullapudi and F. Ali-Osman, “Phosphorylation of O6-Alkylguanine-DNA Alkyltransferase: Experience with a GST-Fusion Protein and a New Pull-Down Assay,” Cancer Letters, Vol. 181, No. 1, 2002, pp. 87-93. doi:10.1016/S0304-3835(01)00823-0
- I. K. Lim, T. J. Park, J. W. Jee, M. S. Lee and W. K. Paik, “Differential Expression of O6-Methylguanine-DNA Methyltransferase during Diethylnitrosamine-Induced Carcinogenesis and Liver Regeneration in Sprague-Dawley Male Rats,” Journal of Cancer Research and Clinical Oncology, Vol. 125, No. 8-9, 1999, pp. 493-499. doi:10.1007/s004320050307
- I. K. Lim, T. J. Park and W. K. Paik, “Phosphorylation of Methylated-DNA-Protein-Cysteine S-Methyltransferase at Serine-204 Significantly Increases Its Resistance to Proteolytic Digestion,” Biochemical Journal, Vol. 352, No. 3, 2000, pp. 801-808. doi:10.1042/0264-6021:3520801
- G. N. Major, E. J. Gardner, A. F. Carne and P. D. Lawley, “Purification to Homogeneity and Partial Amino Acid Sequence of a Fragment Which Includes the Methyl Acceptor Site of the Human DNA Repair Protein for O6- Methylguanine,” Nucleic Acids Research, Vol. 18, No. 6, 1990, pp. 1351-1359. doi:10.1093/nar/18.6.1351
- G. N. Major, M. Brady, G. B. Notarianni, J. D. Collier and M. S. Douglas, “Evidence for Ubiquitin-Mediated Degradation of the DNA Repair Enzyme for O6-Methylguanine in Non-Tumour Derived Human Cell and Tissue Extracts,” Biochemical Society Transactions, Vol. 25, No. 2, 1997, p. 359S.
- J. D. Collier, M. F. Bassendine, A. D. Burt and G. N. Major, “Characterisation of the DNA Repair Enzyme for O6-Methylguanine in Cirrhosis,” Journal of Hepatology, Vol. 25, No. 2, 1996, pp. 158-165. doi:10.1016/S0168-8278(96)80068-7
- K. S. Srivenugopal, X. H. Yuan, H. S. Friedman and F. Ali-Osman, “Ubiquitination-Dependent Proteolysis of O6- Methylguanine-DNA Methyltransferase in Human and Murine Tumor Cells Following Inactivation with O6- Benzylguanine or 1,3-Bis(2-chloroethyl)-1-nitrosourea,” Biochemistry, Vol. 35, No. 4, 1996, pp. 1328-1334. doi:10.1021/bi9518205
- M. Xu-Welliver and A. E. Pegg, “Degradation of the Alkylated Form of the DNA Repair Protein, O6-Alkylguanine-DNA Alkyltransferase,” Carcinogenesis, Vol. 23, No. 5, 2002, pp. 823-830. doi:10.1093/carcin/23.5.823
- L. Shen, Y. Kondo, G. L. Rosner, L. Xiao, N. S. Hernandez, J. Vilaythong, P. S. Houlihan, R. S. Krouse, A. R. Prasad, J. G. Einspahr, J. Buckmeier, D. S. Alberts, S. R. Hamilton and J. P. Issa, “MGMT Promoter Methylation and Field Defect in Sporadic Colorectal Cancer,” Journal of the National Cancer Institute, Vol. 97, No. 18, 2005, pp. 1330-1338. doi:10.1093/jnci/dji275
- T. Kawasaki, M. Ohnishi, K. Nosho, Y. Suemoto, G. J. Kirkner, J. A. Meyerhardt, C. S. Fuchs and S. Ogino, “CpG Island Methylator Phenotype-Low (CIMP-Low) Colorectal Cancer Shows Not Only Few Methylated CIMP-High-Specific CpG Islands, but Also Low-Level Methylation at Individual Loci,” Modern Pathology, Vol. 21, No. 3, 2008, pp. 245-255. doi:10.1038/modpathol.3800982
- J. A. Maxwell, S. P. Johnson, J. A. Quinn, R. E. McLendon, F. Ali-Osman, A. H. Friedman, J. E. Herndon II, K. Bierau, J. Bigley, D. D. Bigner and H. S. Friedman, “Quantitative Analysis of O6-Alkylguanine-DNA Alkyltransferase in Malignant Glioma,” Molecular Cancer Therapeutics, Vol. 5, No. 10, 2006, pp. 2531-2539. doi:10.1158/1535-7163.MCT-06-0106
- M. Christmann, G. Nagel, S. Horn, U. Krahn, D. Wiewrodt, C. Sommer and B. Kaina, “MGMT Activity, Promoter Methylation and Immunohistochemistry of Pretreatment and Recurrent Malignant Gliomas: A Comparative Study on Astrocytoma and Glioblastoma,” International Journal of Cancer, Vol. 127, No. 9, 2010, pp. 2106-2118. doi:10.1002/ijc.25229
- S. Hongeng, T. P. Brent, R. A. Sanford, H. Li, L. E. Kun and R. L. Heideman, “O6-Methylguanine-DNA Methyltransferase Protein Levels in Pediatric Brain Tumors,” Clinical Cancer Research, Vol. 3, No. 12, 1997, pp. 2459-2463.
- M. Nagane, K. Kobayashi, A. Ohnishi, S. Shimizu and Y. Shiokawa, “Prognostic Significance of O6-Methylguanine-DNA Methyltransferase Protein Expression in Patients with Recurrent Glioblastoma Treated with Temozolomide,” Japanese Journal of Clinical Oncology, Vol. 37, No. 12, 2007, pp. 897-906. doi:10.1093/jjco/hym132
- Y. Kishida, A. Natsume, H. Toda, Y. Toi, K. Motomura, H. Koyama, K. Matsuda, O. Nakayama, M. Sato, M. Suzuki, Y. Kondo and T. Wakabayashi, “Correlation between Quantified Promoter Methylation and Enzymatic Activity of O6-Methylguanine-DNA Methyltransferase in Glioblastomas,” Tumour Biology, Vol. 33, No. 2, 2012, pp. 373-381. doi:10.1007/s13277-012-0319-1
- S. L. Gerson, K. Miller and N. A. Berger, “O6 Alkylguanine-DNA Alkyltransferase Activity in Human Myeloid Cells,” The Journal of Clinical Investigation, Vol. 76, No. 6, 1985, pp. 2106-2114. doi:10.1172/JCI112215
- J. A. Allay, O. N. Koc, B. M. Davis and S. L. Gerson, “Retroviral-Mediated Gene Transduction of Human Alkyltransferase Complementary DNA Confers Nitrosourea Resistance to Human Hematopoietic Progenitors,” Clinical Cancer Research, Vol. 2, No. 8, 1996, pp. 1353-1359.
NOTES
*Corresponding author.