Journal of Cancer Therapy
Vol.4 No.2(2013), Article ID:29758,6 pages DOI:10.4236/jct.2013.42071
The Effect of Fasting on PET Imaging of Hepatocellular Carcinoma
![]()
1Department of Biomedical Engineering, Case Western Reserve University, Cleveland, USA; 2Department of Radiology, University Hospitals Case Medical Center, Cleveland, USA.
Email: zxl11@case.edu
Copyright © 2013 Nathan Tenley et al. This is an open access article distributed under the Creative Commons Attribution License, which permits unrestricted use, distribution, and reproduction in any medium, provided the original work is properly cited.
Received January 18th, 2013; revised February 20th, 2013; accepted February 28th, 2013
Keywords: Acetate; FDG; Hepatocellular Carcinoma; Woodchuck; Positron Emission Tomography
ABSTRACT
The clinical utility of positron emission tomography (PET) imaging for liver cancer applications is not clearly defined either for diagnosis or treatment assessment. Previous clinical studies demonstrated that fluorodeoxyglucose (FDG) did not show uptake in some hepatocellular carcinoma (HCC) while acetate showed uptake. Pre-imaging fasting is required for clinical PET imaging with FDG. No studies were done to confirm the effect of fasting on acetate uptake in HCC for PET imaging. We investigated this situation with a woodchuck model of viral infection-induced HCC. Methods: Four tumor-bearing and one control woodchucks were involved in this study. They were first imaged by PET in fed state followed by another imaging session one week later when they were fasted over-night. Some animals also had FDGPET scan that was acquired later on the same day. After imaging studies, animals were sacrificed, and their liver excised for histology. Standardized Uptake Value (SUV) was calculated using a region of interest (ROI) placed on each tumor with focal uptake. Results: Acetate showed uptake in each HCC lesion when the animals were either fasted or fed with no significant difference in SUV values (p = 0.177); some of the tumors were histologically confirmed as well-differentiated HCC while others were confirmed as moderatelyor poorly-differentiated HCC; no focal uptake was found in the control animal. For the accompanying FDG scans, the uptake was detected only in animals that were fasted although the uptake pattern was different from that with acetate. Conclusion: This study provided a hint that fasting or not has little impact on PET imaging of HCC with acetate. It also confirmed prior finding regarding tumor heterogeneity that led to different tracer uptake pattern in the same tumor. Human studies are needed to validate the findings from this pre-clinical investigation.
1. Introduction
Acetate is a precursor for the synthesis of phospholipids, which can be incorporated into cell membranes [1]. [11C]- acetate has high uptake in some tumors, particularly in those in which the lipid synthesis pathway is elevated. Acetate has shown its potential to be a cancer imaging tracer, e.g., for prostate and liver cancers [2-7]. The short (20-minute) half-life of 11C allows dual-tracer same-day PET studies with the second tracer being 18F-labeled, which enables imaging of two targets or two tracer distributions.
Liver is an important organ as it hosts a variety of metabolic processes and synthesizes, releases and stores compounds [8]. Hepatocellular carcinoma (HCC) is the predominant type of primary liver cancer in humans; its incidence is increasing in the United States often with dismal patient survival [9]. In current clinical practicethe value of PET imaging for liver cancer applications is not entirely defined. 2-[18F]-fluoro-2-deoxy-D-glucose ([18F]-FDG, or FDG) is a widely used PET tracer in the clinic for cancer detection, staging and post-treatment evaluation through imaging increased level of cellular glycolysis or decreased level by treatment commonly found in cancer. However, it is challenging for applying FDGPET imaging to liver cancer. In particular in the welldifferentiated, which is an early stage of HCC, FDG metabolism is similar to that of the surrounding hepatic tissues; that severely limits FDG’s ability for detection of primary liver cancer such as HCC [10]. PET imaging with other small molecule probes such as acetate may have the clinical utility to detect HCC or to track of its progression from small HCC to frank HCC with full features, or to assess treatment response.
For an oncologic FDG-PET scan, fasting is required for patients to lower their blood sugar level so that FDG would not compete with glucose for its transporters for tumor uptake during the PET scan [11]. Fasting also reduces insulin levels and thus lowers the activity of glucose transporters in the surrounding tissues and muscles to further enhance FDG uptake in the tumors relative to its surroundings [12]. However, some patients have conditions in which fasting alone does not bring the blood glucose level down, and a mandatory check of the glucose level is enforced before FDG-PET scans in many clinics. These are additional burdens put on patients, hospital staff, and/or insurance.
For non-FDG PET tracers, for example acetate, is preimaging fasting required? Currently, there is no guideline from the Society of Nuclear Medicine and Molecular Imaging regarding this. In this pre-clinical study, intrasubject comparison was made for acetate with and without fasting to evaluate the effect of fasting on tracer uptake in PET imaging of HCC. The finding from this study offers promise for the patients to waive the preimaging fasting requirement with acetate, and sets up the stage for future early phase clinical trial for further validation.
2. Materials and Methods
2.1. Animal Model
The eastern woodchuck (Marmota monax) was used for this study. The woodchuck hepatitis virus (WHV) infection-induced woodchuck HCC is an interesting and useful animal model for studying human HCC. WHV is a member of the family Hepadnaviridae, genus Orthohepadnavirus, of which human hepatitis B virus (HBV) is the prototype. Like HBV, WHV infects the liver and can cause acute and chronic hepatitis. Chronically infected woodchucks usually develop HCC within the first 2 - 4 years of life. Four WHV-carrier and one control woodchucks used in this study were obtained from Northeastern Wildlife Inc. (Harrison, ID). The weights of these animals were between 1.6 and 3.6 kg at the time of the imaging experiments. All procedures in this study followed the guidelines and recommendations of the Institutional Animal Care and Use Committee (IACUC) of Case Western Reserve University (Cleveland, OH).
2.2. PET Imaging Studies
[11C]-Acetate was produced from [11C]-CO2, which resulted in the 11C label in C-1 position using Grignard reagent [13]. Prior to imaging, the woodchucks were fed (food was continuously available to the animals as during normal husbandry) and anesthetized initially with an intramuscular injection of 5 mg/kg of Xylazine and 50 mg/kg of Ketamine. Thereafter, using 2.5% isoflurane gas mixed with oxygen were used to maintain anesthesia. Intravascular injections of a bolus of 37 MBq (1.0 mCi) [11C]-Acetate in 1.5 mL saline were administered. A 30- min scan was acquired in list-mode on a Gemini TF PET/CT scanner (Philips Medical Systems; Cleveland, OH) for two tumor bearing animals, and others two and the control only had static scans of 5 minutes at 25 or 30 minutes after tracer injection due to the rapid decay of 11C from a single-batch of radiochemistry synthesis used for a study of two or three animals. A CT scan was performed first for attenuation correction and for localization of tracer uptake of PET. It was a helical acquisition using 120 kVp, 80 mAs, 1.2-mm pixel dimension and 5-mm slice thickness. Dynamic data from list-mode PET acquisition were re-binned into frames to generate time activity curves (TACs). Each frame was processed independently using a 3D iterative reconstruction method (RAMLA) with correction for photon attenuation, scatter and random events [14]. Timestamps for each image were recorded, and along with radiotracer assay information used for quantitative calibration. All reconstructed PET images were 144 × 144 pixels, for a field-of-view diameter of 576 mm, yielding a voxel size of 4 × 4 × 4 mm. For the two animals with dynamic acetate scans, another bolus of 55.5 MBq (1.5 mCi) of [18F]-FDG in 1.5 mL saline was injected about 100 minutes after acetate injection and a static scan of 5 minutes was acquired 55 minutes post FDG injection. The woodchucks were kept under gas anesthesia throughout. One week later, the whole study was repeated with the same animals when they were fasted overnight (food was removed 12 h prior to the imaging session while drinking water remained).
2.3. Image Analysis
After list-mode PET data were reconstructed into a time sequence of volumetric images, the value of each image voxel in the unit of body-mass standard uptake value (SUV) was calculated by comparing reconstructed count values to a calibration image of an approximately woodchuck-sized phantom of known radioactivity. Suspected tumor regions in the liver were defined based on perfusion-phase PET and late-phase PET images. Specifically, the regions identified were those with higher tracer uptake than its surroundings. Regions of interest were drawn on 4 mm-thick coronal slices containing the suspected tumor regions. In the cases where tumors were identified as areas of inhomogeneous uptake, the region with maximum contrast to background was used. The background regions, each using approximately the same region size as was used for the tumor regions, were drawn distant from the tumor regions, non-overlapping with the tumor region, and in regions of the liver, usually in a different lobe, that appear locally homogenous and without increased or decreased signal in either than early or late PET images, or the CT image. Because statistical noise was significant, particularly in short-duration dynamic images, time-activity curves (TAC) were generated using SUVmean. Each two-dimensional region was propagated to all frames of the dynamic image; within each two-dimensional region in each frame, the maximum pixel was located; the ROI was defined around it to calculate the SUVmean for each frame; and these values were tabulated as the TAC. Values of SUVmean from the late frame (25 - 30 min) were used for paired Student’s t-test to determine if there is a significant difference in acetate uptake between fasted and fed for the same ROI/lesion.
2.4. Histology
Histological evaluation was used for correlation with imaging data. Immediately following the imaging experiment, selected animals were euthanized using FatalPlus (Vortech Pharmaceuticals Inc., Dearborn, MI). Samples of tumor and surrounding hepatic tissues were then harvested and fixed in formalin. Thin sections of paraffinembedded tissues were prepared and stained with hematoxylin-eosin. The fat content, presence of necrosis, and the tumor differentiation were assessed in these sections based on the procedure described previously [15].
3. Results
3.1. Effect of Fasting
For this group of tumor-nearing animals (n = 4), each has at least one liver nodule that has tracer uptake. For two animals that were imaged with both dynamic acetate and static FDG in the fed state (food remained available until beginning of anesthesia procedure about 2 h before imaging) and one week later in the fasted state (food made unavailable 12 h before imaging), TACs for acetate were generated based on ROI centered on the focal uptake in the tumors and in the units of SUVmean were similar between fed and fasted states, and among animals. An example from one of the animals is shown in Figure 1. Also shown in the figure are the images of 1) acetate uptake from a frame equivalent of a 5-min static scan starting at 25-min post-injection; 2) FDG uptakefrom a 5-min static scan starting at 55-min post-injection.
For the other two tumor-bearing animals, static scans showed similar uptake results either fasting or not. The control animal is tumor-free and showed no focal hepatic uptake. No significant effect of fasting on the SUVs defined on the 5-min frame from 25 - 30-min post-injection is found with acetate (mean SUV: fasted, 3.83 ± 1.15; fed, 3.60 ± 1.05, p = 0.177).
3.2. Acetate versus FDG
Both acetate and FDG data were acquired sequentially on
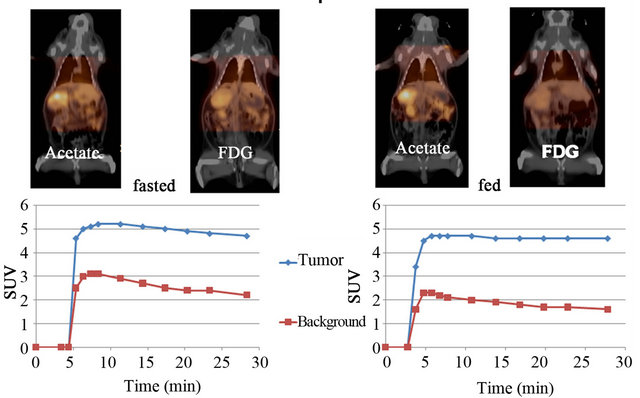
Figure 1. Woodchuck with HCC was scanned first in fed state (right panel), and one week later in fasted state (left panel). During each imaging session, a dynamic PET scan of 30 min with [11C]-acetate was performed first, followed by a static PET with FDG, see text. The time activity curves of acetate uptake (SUVmean) in liver tumor with focal uptake and the background region were generated (bottom).
the same day for two tumor-bearing animals first in the fed and then in the fasted states one week apart; in each case, dynamic acetate acquisition was done first followed by a static FDG acquisition. The final 5-min frame of acetate was used as an equivalent of static scan for SUV calculation in comparison with that from FDG. Focal tracer uptake (hot) spots, if any, were identified to center the ROIs; SUVs were calculated from each ROI in terms of max, min and mean. Table 1 summarized the results. For Woodchuck #1, acetate and FDG had focal uptake in different spots of the tumor as shown in Figure 2. Histological evaluation confirmed that the spot of the acetate uptake corresponds to moderately-differentiated HCC while that for FDG is poorly-differentiated HCC also shown in Figure 2. For Woodchuck #2, no focal uptake can be visually identified for FDG in both fed and fasted states even though acetate uptake was imaged, which corresponding to well-differentiated HCC.
4. Discussion
Our previous investigations with the woodchuck models of HCC revealed that lipids-based small molecule tracers such as [14C]-acetate were entrapped in the tumors. Specifically, the results showed that acetate was incorporated into lipid synthesis, which is augmented in HCC. Radio-labeled metabolites retained in tumor cells for PET imaging evolved over a short time period during the scan forming a wide lipid class and converging to phosphatedylcholine (PC) towards the end of the scan (30-min for 11C labels) [16,17]. For acetate undergoing lipid synthesis, its pathway goes through acetyl-CoA since acetyl-CoA synthase (ACAS) activity was up in HCC [18] leading towards both neutral and phospholipids from the beginning, and ending with PC as the predominant radio-metabolite 25 - 30 min after tracer injection [16].
Table 1. Comparison of acetate and FDG uptake in HCC.
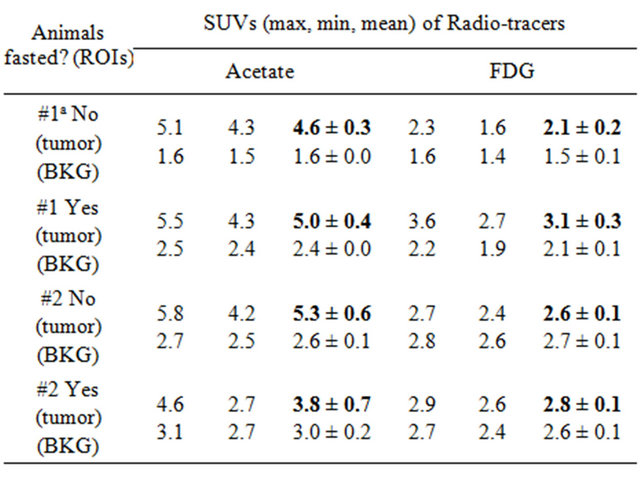
aAnimal#1 with different tracers (acetate, FDG) showed uptake in different parts of the tumor or different regions of interest (ROIs) although the background region (BKG) is the same.
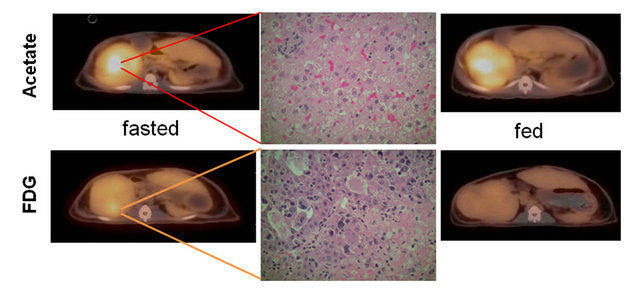
Figure 2. Comparison between acetate and FDG. Each tracer showed uptake in different parts of the same tumor with different pathological grades (see text), and in good agreement with published human study [5]. Acetate uptake was not affected by the state of fed or fasted, but FDG was affected as anticipated.
Extensive clinical studies are needed to explore the full utility of acetate PET imaging for HCC. Before launching these studies, an important issue was investigated in this pre-clinical study, which is the impact of dietary fasting on acetate uptake in HCC.
4.1. Fasted versus Fed
For an FDG-PET scan, fasting is a common requirement in PET centers. However, enforcement is not always easy and it puts burden on patient management as equivocal imaging outcomes often resulted in repeated procedures. Relaxing the requirement of fasting would simplify patient management in terms of procedural complexity and would also alleviate the economic stress of additionnal procedures. Looking into non-FDG PET tracers, for example, specifically for this study, animal fasting was not found to have a significant impact on tumor uptake with acetate (p = 0.177). Although a study with a larger number of animals would be required to eventually confirm this finding, the initial results suggest the effect of fasting on tracer uptake may be negligible. Food intake impacts the glycolytic pathway of glucose metabolism and thus FDG-PET (Figure 2). Glycolysis is linked to lipogenesis via citric acid cycle (Figure 3) as ATP citrate lyase (ACL) converts the released citrate into acetyl-CoA for lipogenesis, including the production of phospholipids [19]. For acetate, its incorporation into phospholipids begins with conversion into acetyl-coA by cytosolic ACAS1, which is up-regulated in HCC [18], and not by ACAS2 in mitochondria. Therefore, it does not seem to be influenced by the glucose-dependent lipogenesis pathway in mitochondria as shown in Figure 3 (from citrate-ACLacetyl-CoA) and is thus insensitive to the blood glucose level. In this study, the non-fasted state included a diet consistent with standard animal care; whether a high fat diet will have a transient impact on PET imaging with acetate is yet to be investigated.
4.2. Dual-Tracer Multiple Animal Studies
FDG was injection 100 minutes after acetate injection. The purpose for this delay is to make sure that the residue of [11C]-acetate is less than 5% of the total radioactivity in the body after FDG injection. By the time of static FDG scan, the 11C residue is negligible since it far less than 1% of the total radioactivity as 11C decays more rapidly than 18F. Because of this rapid decay of 11C, full dynamic scans (starting at the injection of radiotracer) for all animals in a multi-subject study can be difficult to achieve. To the most, we previously placed four animals on the long board of the clinical PET/CT scanner for one imaging session (see Figure 4 where injectable anesthesia was used). We first injected an 11C-labeled tracer to each animal and scanned them sequentially. Once the first round was over, an 18F-labeled tracer was injected and scanned for each animal in sequence. The animals were anesthetized with an intramuscular injection of 5 mg/kg of Xylazine and 50 mg/kg of Ketamine. Thereafter, incremental injections of pentobarbital were used
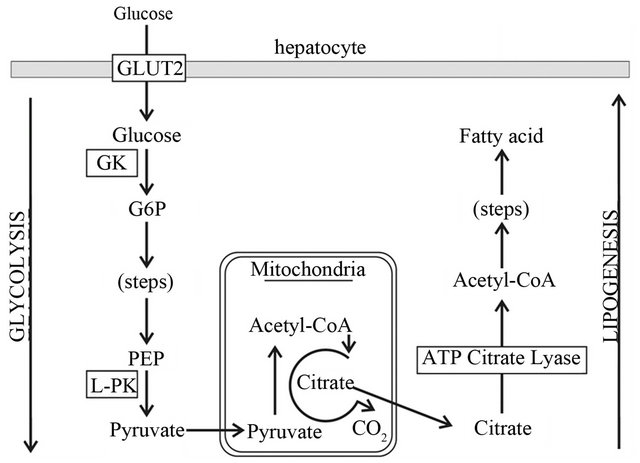
Figure 3. A schematic diagram of glucose-dependent lipogenesis potentially linking the two pathways affecting FDG and acetate metabolism, see text.
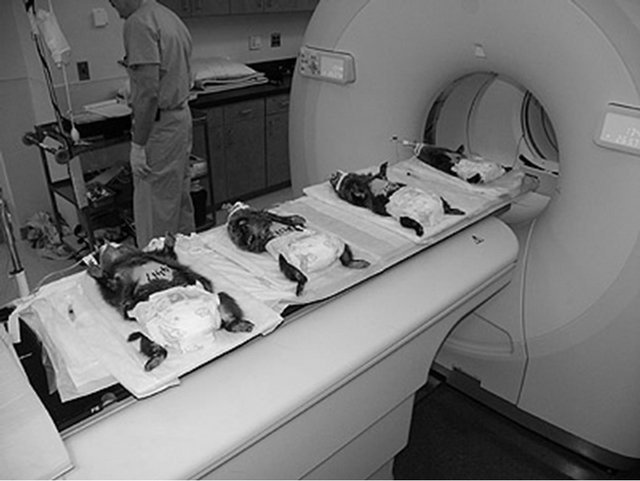
Figure 4. Pipelining for dual-tracer imaging. Up to four woodchucks can be placed side-way on the long board of the clinical PET/CT scanner with the liver positioned at the center of FOV. Animals were injected with an 11C-labeled tracer and scanned in sequence when the bed position advanced. During this sequential imaging, an 18F-labeled tracer could be injected into an animal after its 11C scanning. After all 11C scans were finished, the bed returned to the initial position and each animal would be ready for 18F scanning in sequence.
to maintain anesthesia. Gas anesthesia was not used due to arrangement of gas tubing and separate anesthetic maintenance of each animal. This is an efficient way to use clinical scanner for pre-clinical experiments, and the timing of the imaging sequence coincides with radio-decay so that no extra waiting time for radio-decay between the two tracers needs to be arranged. However, from a single-batch of an 11C tracer production even with a high-yield radiochemical synthesis, full dynamic scans are only possible for first or maybe the first two animals in the sequence. Usually, only the first animal can be guaranteed for the dynamic scan, and the rest need to be injected before 11C tracer decays away that often ends with static scans. In this study, we had three animals in one imaging session on one day and two animals for another day. Consequently, the first animal of each day/ session had the full 11C dynamic scan. Animals were positioned parallel with the camera axis in this study different from previous studies (Figure 4), supine and approximately centered in the transaxial field-of-view.
The first animals in each also had FDG scans; SUV calculations are summarized in Table 1, in which a frame from 25 - 30 min of dynamic acetate scan was used as an equivalent static scan for the computation. There was a similar dual-tracer clinical study with liver cancer patients that showed FDG uptake mostly in poorly-differentiated HCC while acetate had preferential uptake in welland moderately-differentiated HCCs. The results from this (Figure 2) and other pre-clinical studies [16,17] are in good agreement with that clinical study. Although there is still a small contrast in SUVmean between the tumor and background region for the fed scan from the first animal (Table 1), this metric does not concur wholly with physician’s visual detection. Tracer uptake contrast in the tumor is perceived against its immediate surrounding tissues; the background region was chosen in part of the liver where there is no focal uptake and homogenous throughout the scan, and away from the tumor foci and their surroundings.
5. Conclusion
Fasting was not found to affect tracer uptake in HCC with acetate. This study also confirmed the clinical results regarding tumor heterogeneity that led to different tracers showing uptake in different parts of the same tumor. The result encourages further investigation into the clinical utility of acetate imaging for HCC.
6. Acknowledgements
We thank the Animal Resource Center at CWRU for help with animal care; the technologists in the department of Nuclear Medicine at University Hospitals Case Medical Center for imaging assistance; Joseph Molter for help in executing the experiments; Dr. Zachary Goodman of Inova Fairfax Hospital (Falls Church, VA) for histology interpretation; and Drs. Chunying Wu and Yanming Wang for help with radiopharmaceutical preparation. This work was supported by an NIH/NCI R01 grant CA095307 (PI: Zhenghong Lee).
REFERENCES
- M. Yoshimoto, et al., “Characterization of Acetate Metabolism in Tumor Cells in Relation to Cell Proliferation: Acetate Metabolism in Tumor Cells,” Nuclear Medicine and Biology, Vol. 28, No. 2, 2001. pp. 117-122. doi:10.1016/S0969-8051(00)00195-5
- N. Oyama, et al., “11C-Acetate PET Imaging of Prostate Cancer,” Journal of Nuclear Medicine, Vol. 43, No. 2, 2002, pp. 181-186.
- C. L. Ho, et al., “11C-Acetate PET Imaging in Hepatocellular Carcinoma and Other Liver Masses,” Journal of Nuclear Medicine, Vol. 44, No. 2, 2003, pp. 213-221.
- S. Li, et al., “Comparison of (11)C-Acetate Positron Emission Tomography and (67)Gallium Citrate Scintigraphy in Patients with Hepatocellular Carcinoma,” Liver International, Vol. 26, No. 8, 2006, pp. 920-927. doi:10.1111/j.1478-3231.2006.01335.x
- C. L. Ho, et al., “Dual-Tracer PET/CT Imaging in Evaluation of Metastatic Hepatocellular Carcinoma,” Journal of Nuclear Medicine, Vol. 48, No. 6, 2007, pp. 902-909. doi:10.2967/jnumed.106.036673
- J. W. Park, et al., “A Prospective Evaluation of 18F-FDG and 11C-Acetate PET/CT for Detection of Primary and Metastatic Hepatocellular Carcinoma,” Journal of Nuclear Medicine, Vol. 49, No. 12, 2008, pp. 1912-1921. doi:10.2967/jnumed.108.055087
- K. H. Hwang, et al., “Evaluation of Patients with Hepatocellular Carcinomas Using [(11)C]Acetate and [(18)F] FDG PET/CT: A Preliminary Study,” Applied Radiation and Isotopes, Vol. 67, No. 7, 2009, pp. 1195-1198. doi:10.1016/j.apradiso.2009.02.011
- A. M. Gharib, et al., “Molecular Imaging of Hepatocellular Carcinoma,” Gastroenterology, Vol. 127, No. 5, 2004, pp. S153-158. doi:10.1053/j.gastro.2004.09.029
- H. B. El-Serag and A. C. Mason, “Rising Incidence of Hepatocellular Carcinoma in the United States,” The New England Journal of Medicine, Vol. 340, No. 10, 1999, pp. 745-750. doi:10.1056/NEJM199903113401001
- T. Torizuka, et al., “In Vivo Assessment of Glucose Metabolism in Hepatocellular Carcinoma with FDG-PET,” Journal of Nuclear Medicine, Vol. 36, No. 10, 1995, pp. 1811-1817.
- K. H. Lee, et al., “Effects of Anesthetic Agents and Fasting Duration on 18F-FDG Biodistribution and Insulin Levels in Tumor-Bearing Mice,” Journal of Nuclear Medicine, Vol. 46, No. 9, 2005, pp. 1531-1536.
- W. Okumura, et al., “Usefulness of Fasting 18F-FDG PET in Identification of Cardiac Sarcoidosis,” Journal of Nuclear Medicine, Vol. 45, No. 12, 2004, pp. 1989-1998.
- T. Kihlberg, et al., “Synthesis of [1-11C], [2-11C], [1-11C] (2H3) and [2-11C](2H3)Acetate for in Vivo Studies of Myocardium Using PET,” Nuclear Medicine and Biology, Vol. 21, No. 8, 1994, pp. 1067-1072. doi:10.1016/0969-8051(94)90178-3
- M. E. Daube-Witherspoon, et al., “Application of the Row Action Maximum Likelihood Algorithm with Spherical Basis Functions to Clinical PET Imaging,” IEEE Transactions on Nuclear Science, Vol. 48, 2001, pp. 24- 30. doi:10.1109/23.910827
- N. Salem, et al., “Quantitative Evaluation of 2-Deoxy- 2[18F]fluoro-D-glucose-positron Emission Tomography Imaging on the Woodchuck Model of Hepatocellular Carcinoma with Histological Correlation,” Molecular Imaging and Biology, Vol. 9, No. 3, 2007, pp. 135-143. doi:10.1007/s11307-007-0092-5
- N. Salem, et al., “[(Methyl)1-(11)c]-Acetate Metabolism in Hepatocellular Carcinoma,” Molecular Imaging and Biology, Vol. 13, 2011, pp. 140-151. doi:10.1007/s11307-010-0308-y
- N. Salem, et al., “PET Imaging of Hepatocellular Carcinoma with 2-Deoxy-2[18F]fluoro-D-glucose, 6-Deoxy-6[18F]fluoroD-glucose, [1-11C]-Acetate and [N-methyl-11C]-choline,” The Quarterly Journal of Nuclear Medicine and Molecular Imaging, Vol. 53, No. 2, 2009, pp. 144-156.
- Y. Kuang, et al., “A Colorimetric Assay Method to Measure Acetyl-CoA Synthetase Activity: Application to Woodchuck Model of Hepatitis Virus-Induced Hepatocellular Carcinoma,” Journal of Biochemical and Biophysical Methods, Vol. 70, No. 4, 2007, pp. 649-655. doi:10.1016/j.jbbm.2007.02.008
- B. Alberts, et al., “Cell Chemistry and Biosynthesis,” In: Molecular Biology of the Cell, Garland Science, New York, 2002, pp. 47-109.