iBusiness
Vol.2 No.2(2010), Article ID:1961,5 pages DOI:10.4236/ib.2010.22023
Evaluation of Social Risk Using Structural Equation Model
![]()
1College of Science, Jinan University, Jinan, China; 2Department of Mathematics, Wuhan University of Technology, Wuhan, China.
Email: tonghengqing@126.com
Received February 28th, 2010; revised April 3rd, 2010; accepted May 5th, 2010.
Keywords: Social risk evaluation, Structural equation models, Unit vector constraint
ABSTRACT
A quantitative method to evaluate social risk using structural equation model (SEM) is developed. Evaluation of social risk is the essential step in early warning of social risk. On the basic of the society stability, a scientific and applicable index system of social risk is put forward, which includes 6 first-level indexes and 40 second-level indexes. Based on these indexes and relationships among them, a structural equation model is introduced, and an improved partial least square (PLS) algorithm by finding the best iterative initial value is proposed.
1. Introduction
Nowadays, social conflict of different interest has become more and more intense, which consequently result in potential social risks. In 1986, Ulrich Beck the German prominent sociologist put forward the theory of risk society in his best works, Risk Society. Social risk refers to the uncertainty that endangers the social stabilities, equilibrium and development. Generally speaking, our social risk management gets along with economic mechanism very well, but because of the relationship and sequence between the reformation and social risk management, it's inevitable that social risk management policy often lags behind the reform. This kind of lagging makes social risk management unable to resolve the rough social problems in time. Therefore, it's necessary to appraise and supervise the social risk, to the effect that we can detect the incompatibility between the policies and the development of the society, and make necessary adjustment in time. Therefore, an evaluation system for social risk should be established in order to accurately predict and rapidly react in very early stage, with the purpose of minimizing social and economic losing.
Social risk evaluation is a broader concept for the ideas of the so-called social indicators movement which goes back to a classical work of Raymond A. Bauer, Social Indicators, from 1966 [1]. The Club of Rome raised considerable public attention in 1972 with its report The Limits to Growth, a brilliant publication which is infl- uential still today. It predicted that economic growth could not continue indefinitely because of the limited availability of natural resources [2]. Prof. Linfei Song has begun the research on social risk early warning using the methods of social indicators since 1990s. And in 1995 he put forward the social risk synthesized index system (SRSS), which including 50 indexes. But the summarizing coefficients in this index system are designed aforehand. In 2004, Prof. Yaojun Yan built up the social stability early warning system, which includes 55 indexes containing the domain of political, economic, social natrural and international environment. There were greatly improved and development between the latter index system and the former in both the scientificalness and rationality [3,4].
At present, main systematic evaluation methods of social risk, which are in common use, includes Analytic Hierarchy Process (AHP), Systematic Grading Method and Fuzzy Systematic Grading Method and so on. There are always index systems in these evaluation methods, and these indexes need to be summarized. Traditionally the summarizing coefficients are designed aforehand, usually in the form of expert grading or questionnaire investigating. However, in this paper, we introduce a method in which the summarizing coefficients are calculated by samples, so it is more objective and convincing, and could offer more deep analysis for the index systems.
2. Measure the Social Stability by SEM
SEM is a rapid-developing embranchment of Application Statistics, which has a wide application in the area of Psychology and Sociology, especially in Customer Satisfaction Index (CSI) model which is required by a series of ISO9000 criterions. This model not only studies the interior relationship among various factors, but also the relative and causal relations among latent variables.
There are always two systems of equations in a SEM. One is a structure system of equations among structural variables, and the other one is a measurement system of equations between structural variables and observed variables. It has been thought and said that establishing a scientific and rational evaluation index system can not only provide a credible gist for decision-making analysis of social risk, but also maintain our social stability and harmony. Therefore, it’s important and urgent to quantitative analysis and build effective social risk index immediately. Now we build a SEM for evaluation of social risk. The model includes 6 structural variables and 40 observed variables. The variables are listed in Table 1 as follows: Notice that the numbers of observed variables corresponding each structure variable are 6, 6, 8, 8, 5, 7.
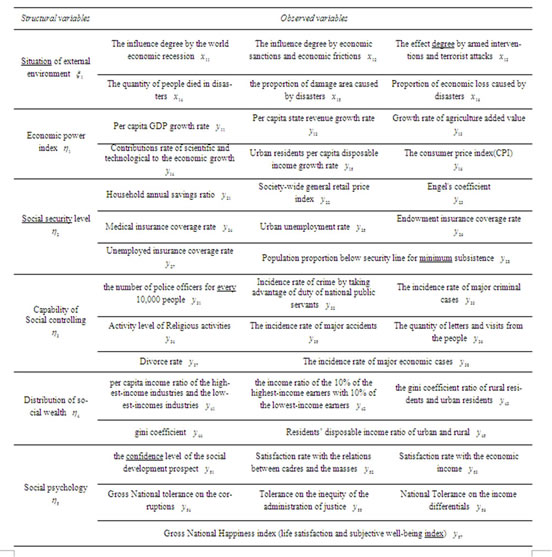
Table 1. Index of variables
There exists 13 relationships among the 6 structural variables (latent variables), which are expressed in Figure 1 below (The relationships among variables are , expressed with dashed arrowheads; The relationships among independent variables are
 , expressed with real-line arrowheads). The structural relationship among the latent variables (structural model) can be put as follows:
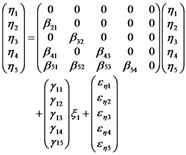
Among the structural variables there are some path relationships or causalities. These causalities among the structural variables can be expressed as equations as below.
 (1)
(1)
In general, suppose that  are
are ![]() dependent variables, arranging them as a vector
dependent variables, arranging them as a vector  by column as (1); and
  are
are  independent variables, arranging them as a vector
  by column also. Then
square matrix  is the coefficient matrix of
 , then m × k matrix
 ![]() is the coefficient matrix of
is the coefficient matrix of ,
,  is the residual vector, then SEM (1) may be extended as:
 (2)
(2)
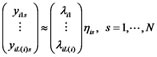
The structural variables are implicit and cannot be observed directly. Each structural variable is corresponding with many observed variables.
Suppose that there are  observed variables and each one has
  observed values, then we will get a
  matrix. The relationships between the structural variables and the observed variables can also be expressed as follows:
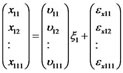 (3)
(3)
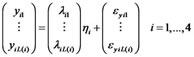 (4)
(4)
where ,
,  (There are 5 observed variables in Table 1) are the observed variables corresponding to
 ,
,  (
( are respectively 6, 6, 8, 8, 5, 7, in Table 1) are the observed variables corresponding to
 ,
,  ,
,  ,
,  are load items. We call (2) (3) (4) a SEM for evaluating the social risk.
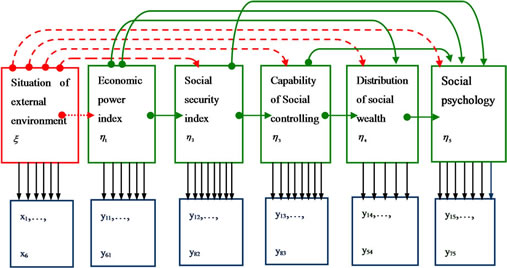
Figure 1. Social risk index model
3. The Best Initial Value in PLS Algorithm of SEM
At present, there exist two algorithms to solve SEM, one is Linear Structure Relationship (LISREL) which has a abundant theory system but lacks of practicability, the other one is PLS which is widely applied in many areas but its convergence can not be assured or its convergence rate is too slow, since its iterative initial value is given arbitrarily. However, we find that arbitrary initial value is not necessary and PLS can be calculated by a suitable iterative initial value based on the least square estimation in the observation equations.
Equation (4) can be written as:
 (5)
(5)
And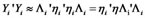 , it we set structural variables as unit vectors, namely
 , then:
 (6)
(6)
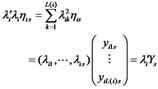
Which is an approximate equality between two  matrixes under the meaning of least square and its detail form is:
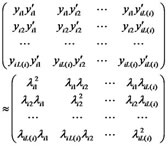 (7)
(7)
Be attention each element in the left is the product of two vectors, while element in the right is the product of two numbers. Next set diagonal elements in the two sides equal, then:
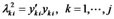 (8)
(8)
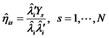
We can do it for variable  with the same method. In this way we get the initial value of coefficients between observed variables and structural variables under the meaning of least square, namely the estimation value
  of matrix
 .
.
Next we will estimate structural variable . Suppose
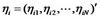 , then the vector form of (13) is
 (9)
(9)
where vector  is the transversal vector of matrix
 . Let vector
  multiple two sides of (9), we get the least square estimation of
 (10)
(10)
 (11)
(11)
where  has been estimated before. We can also get estimate
  and
and  in the same way. Then we get all estimation values of structural variables, they satisfy
 (12)
(12)
Its geometrical meaning is to seek the distance between a unit sphere and a hyper-plane and its solution is unique under the condition that it is not linearly dependent among vectors .
.
After getting the least square solution  of the structural system of equations, we can easily gain the solution of (2) with two-phase least square method. In other words, it dose not need to iterate since we get the least square solution
  of the observed equation system based on unit vector constraint and the solution satisfy the two systems of equations of SEM.
4. Final Remarks
In this paper, we propose structural equation model to measure social risk. It is more objective and scientific to use SEM in the evaluation of social risk compared with traditional methods, such as AHP, Fuzzy Systematic Grading Method and so on, because the summarizing coefficients of this evaluation system are calculated by samples rather than designed aforehand. Therefore, we can have a better understanding the relationships among the indexes, which will do a great favor to decision-making analysis of the social stability.
5. Acknowledgements
We thank the anonymous reviewers for their constructive remarks and comments. The project was supported by the National Natural Science Foundation of China (30570611, 60773210).
REFERENCES
- R. A. Bauer, Social Indicators, MIT. Press, October 1967.
- D. H. Meadows, D. L. Meadows, J. Randers and W. W. Behrens, “The Limits to Growth,” Universe Books, New York, 1974.
- L. F. Song, “Social Risk Index System and Social Fluctuation,” Sociological Studies, 1995.
- Y. J. Yan, “A Study on the Measurement of Social Stability and Construction of the Presentiment Management System,” Sociological Studies, 2004.
- H. Q. Tong, Data Analysis and Statistical Computation (DASC), Electronic Publication, Science Press of China, Beijing, 2005.
- C. M. Wang and H. Q. Tong, “Best Iterative Initial Values for PLS in a CSI Model,” Mathematical and Computer Modeling, Vol. 46, No. 3-4, 2007. pp. 439-444.