Natural Science
Vol.5 No.1(2013), Article ID:26637,6 pages DOI:10.4236/ns.2013.51012
Gross alpha and beta activities and trace heavy elemental concentration levels in chemical fertilizers and agricultural farm soils in Nigeria
![]()
1Radiation and Health Physics Research Laboratory, Department of Physics, University of Ibadan, Ibadan, Nigeria; *Corresponding Author: jibirinn@yahoo.com, nnamdi.jibiri@mail.ui.edu.ng
2Department of Science Technology, The Federal Polytechnic, Ado-Ekiti, Nigeria
Received 23 July 2012; revised 20 August 2012; accepted 7 September 2012
Keywords: Chemical Fertilizers; Gross Alpha Activity; Gross Beta Activity; Trace Heavy Elements; Farm Soil; Nigeria
ABSTRACT
The gross alpha (α) and beta (β) activities and trace heavy elemental concentrations have been determined in Single Super Phosphate (SSP) and Nitrogen Phosphorous Potassium (NPK) fertilizers samples used for agricultural purposes in Nigeria. Cultivated farm soil samples from two regions (north and south) in the country and samples of phosphate rocks were also analyzed for gross α and β radioactivity and elemental concentrations. The beta activity concentration in the NPK (15-15-15) fertilizers was found to vary from 2410.0 ± 80.0 Bq∙kg−1 to 4560 ± 140.0 Bq∙kg−1, between 1340.0 ± 70.0 Bq∙kg−1 and 1440.0 ± 70.0 Bq∙kg−1 in the Single Super phosphate fertilizers while in the farm soil it ranged between 360.0 ± 40.0 Bq∙kg−1 to 570.0 ± 50.0 for the north samples and 200.0 ± 50.0 to 230.0 ± 20 Bq∙kg−1 for the south samples. The alpha activities in the NPK fertilizers was found to vary from 20.0 ± 10.0 to 90.0 ± 20.0 Bq∙kg−1, in the SSP it varied from 60.0 ± 20.0 to 100.0 ± 20.0 Bq∙kg−1 while in the soil samples it varied from 8.0 ± 6.0 to 40.0 ± 10.0 Bq∙kg−1 (north) and 10.0 ± 10.0 to 20.0 ± 10.0 Bq∙kg−1 (south). The trace heavy metal concentration in Phosphate rock samples, SSP and the NPK (15-15-15) fertilizers samples were lower than the safety limits, however, the heavy elements were all detected in NPK fertilizers samples including Hg.
1. INTRODUCTION
The addition of inorganic phosphate fertilizers to soil for agricultural crop growth and production is a common practice worldwide because they are sources of macronutrient (N, P, K, Ca, Mg and S) and micronutrients (B, Cl, Co, Cu, Fe, Mn, Mo, Ni, Se, Si and Zn) to the crops especially when they are deficient in the soils [1]. Inorganic fertilizers may contain radionuclides, heavy metals and fluorine, heavy metal micro-nutrients (Co, Cu, Fe, Mn, Mo, Ni, Zn) and heavy metals (As, Al, Cd, Pb and Hg) considered toxic when their concentrations exceed safety limits and importantly when they find their way into human systems through eco-systemic mechanisms [2]. For a plant to grow properly, it needs close to 60 chemical elements, the key elements accounting for 90% of a plant’s dry weight are carbon, oxygen and hydrogen while some 8% to 9% of nitrogen, phosphorus, magnesium, sulphur, calcium and potassium. The remaining elements amount to a mere 1% or 2%; these include the important elements; boron, iron, copper, manganese, zinc and cobalt [3]. Fertilizer effects on crops are classified as either direct or indirect based on the plant need for the fertilizer. They have direct effects if they supply nutrients for plants directly and indirect if they serve to improve the soil’s physical chemical and biological properties so as to mobilize the nutrients present in the soil and to neutralize the soil’s acidity. There are multi-nutrient fertilizers which contain two or more macronutrients such as N-P, P-K, or N-K (double-nutrients) while N-P-K is termed tripled-nutrient fertilizers referred to as complete fertilizers. Phosphorus is one of the limiting elements to plant growth and development because lack of available phosphorus in soils limits the growth of both cultivated and uncultivated plants. Today, the only important source of fertilizer and industrial phosphorus is phosphate rock [4]. The phosphate rocks are also rich in uranium, thorium and their daughters, deposited as calcium phosphate minerals [2]. Contamination of soil and water bodies by major and trace elements may be caused by natural processes or through human activities in the environment [5].
The long-continued application of fertilizers and their by products can redistribute and elevate heavy metal and radionuclide concentrations in soil profiles. Research has shown that uranium concentrations in phosphate rock samples (a raw material for phosphate fertilizer) are enhanced by a factor of more than 10 above background uranium in soil. The ingestion of radionuclides through food intake via the soil treated with fertilizer accounts for a substantial part of average radiation doses to various organs of the body and also represents one of the important pathways for long term health considerations [6-9]. The heavy use of NPK fertilizers by farmers to improve crop yield following impoverishment of the soil has been attributed to be responsible for their elevated concentrations in food crops [6]. Despite the wide application of fertilizers in farming in the country and the different brands used by farmers, the much needed research has not been carried out in brands of fertilizers available to farmers. Until recently the level of natural radionuclide concentration levels (226Ra, 232Th and 40K) in brands of fertilizer used in some part of Nigeria was determined by Jibiri and Fasae [7] by gamma ray spectrometry. As a further step to this initial research effort, the gross alpha and beta radioactivity levels in both farm soil and fertilizer samples in the country are investigated in this study. In view of the contribution of fertilizer to natural radiation exposures through their applications in farming activities and by crop uptake to food ingestions, the present study aims are as follows: 1) determine the level of radioactivity in the brand of fertilizers sold in Nigeria through their alpha and beta emissions and also in different farm soils where they have been applied for agricultural purpose; 2) determine the trace heavy elemental compositions in the fertilizer brands; and finally, 3) provide requisite radiometric data that may be useful in policy formulation and implementation on fertilizer safety and standards in the agricultural sector in Nigeria.
2. MATERIALS AND METHODS
2.1. Sampling
In the collection of samples of fertilizers in this study consideration was given to the two fertilizer manufacturing companies in the country; the Federal Superphosphate Fertilizer Company Ltd. (FSFC), located in Kaduna State in the Northern part of the country and National Fertilizer Company of Nigeria (NAFCON) in PortHarcourt located in the southern part. Fertilizer samples from these two companies were collected and also the phosphate rocks, the raw materials (the Sokoto and Togo types) used by the companies in the manufacturing of fertilizers. Two samples of single super phosphate fertilizers were collected from FSFC marked SSP1 and SSP2 while NPK fertilizer brand were collected from markets outlets in six major commercial cities located in six states in southwestern Nigeria. This is because the markets represent the distribution channel of brands of fertilizers to the farmers and are centers of commerce in the region which are easily accessible by all strata of farmers. The markets in the city centers from where samples were collected in the southern states are: Oyo, Ogun, Osun, Ondo, Lagos and Ekiti and samples from each state was labeled NPKoy, NPKog, NPKos, NPKod, NPKLa, and NPKEk, respectively. Majorly, farmers from the southern part of the country use the NPK brand because of the fertile soil type while the north uses the SSP brand because it is an arid zone. Furthermore, samples of farm soil treated with SSP fertilizer were collected from School of Agriculture Kaduna farm and the Prison farm of the Nigerian Prison Services labeled SoilNorth while those treated with NPK were collected from farmlands around NAFCON labeled SoilSouth. However, these sampling approaches were premised on the assumption that the farm soil samples from the farmlands in each of the region were treated with fertilizer types produced in that region. The validity of this assumption was however not investigated in this study.
2.2. Gross Alpha and Beta Counting Procedure
AN EURISYS MEASURE IN 20 a low background multiple (eight) channel alpha and beta counter was used for the measurements of the gross alpha and beta in the fertilizer and the farm soil samples. It is a gas flow proportional counter with 450 mg/cm3 thick window of diameter 60 mm. The counting gas is an argon-methane mixture at the ratio of 90% and 10% respectively. The counting system incorporates an anti-coincident guard counters used to eliminate the influence of high energy cosmic radiation that would enter the measuring environment. The background radiation level within the measuring environment was estimated to be less than 1.0 mSv/ hr. The chambers were covered with 10 cm thick lead and the inside dimensions are 480 × 280 × 105 mm3. The system was connected to a micro-processor IN-SYST, a spreadsheet programmed QUARTTRO-PRO and a graphic programmer. For the alpha activity measurements the standard used is 239Pu α-sources with activity ranging from 133.3 Bq to 185.8 Bq for the eight channels at 2pstearadians. The radionuclide impurity in each of them varied from 0.74% - 0.82% [10]. For the beta activity measurements the standard used are 90Sr β sources of diameter 38 mm and an active film of 12 mg∙cm−3 thick. For the eight channels, eight sources of activities varied from 105.1 Bq to 117.7 Bq at 4p-stearadians. The radionuclide impurity in each of them was less than 0.1%. Cerca and LEA Laboratories in France certified all measurements with certificate No. CT001271/00/1778-1783 [10].
The beta and alpha specific activities were calculated using the expression in Eq.1. [10]:
2.3. Trace Heavy Metal Determination
A one gram aliquot of each sample of the fertilizers was transferred into a conical flask. A 10.0 ml of the digestion solution containing a mixture of concentrated HNO3 and HCL mixed in ratio 3:1 was added to each sample in the flask for digestion procedure as described by Rowel [11]. The mixture was heated until digestion was complete, that is, when the samples became whitish and brown fumes of HNO3 seized to appear. The residue was diluted with deionized water, filtered and the filtrate was further diluted to make 100.0 ml using deionized water in a standard flask. Series of standard solution of each metal were prepared and run along with each sample at the respective wavelength for maximum absorption of each metal. The metal concentrations were thereafter determined using Atomic Absorption Spectrophotometer (AAS) (Buck Scientific Model 200A (AOAC, 1990).
3. RESULTS AND DISCUSSION
3.1. Gross Alpha and Beta Activities in the Fertilizer and Farm Soil Samples
The gross alpha and beta activity concentrations in the single superphosphate and NPK fertilizers are presented in Table 1 while the concentrations in the farm soil samples from the two regions is presented in Table 2. As could be seen from Table 1 the gross beta activity concentration varied from 2410.0 Bq∙kg−1 (Oy) to 4560 Bq∙kg−1 (Od) in the NPK (15-15-15) while in the SSP
Table 1. The gross alpha and beta activity concentrations in super phosphate and NPK fertilizer samples.
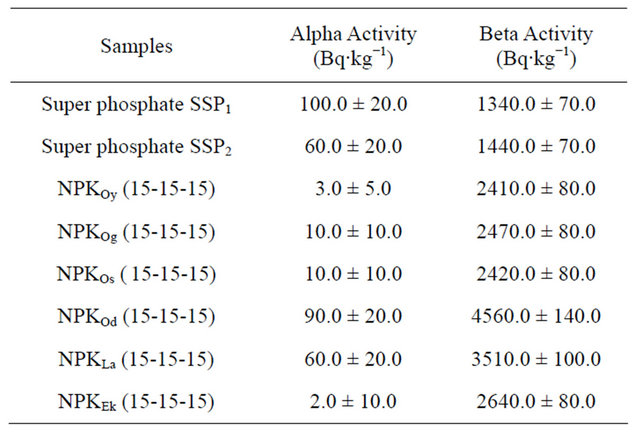
Table 2. The Gross alpha and beta activity concentrations in farm soil samples from two regions of Nigeria.
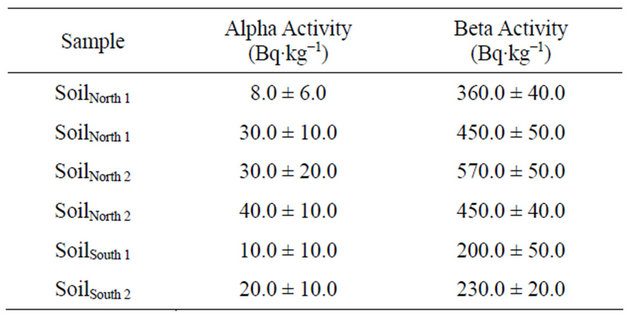
fertilizers it varied from 1340.0 Bq∙kg−1 to 1440.0 Bq∙kg−1. This shows that there are more beta emitters in the NPK fertilizers than in the SSP fertilizers. This trend was a direct opposite on gross alpha activities in the sample. This shows that the gross alpha activities are higher in the SSP fertilizers (60.0 Bq∙kg−1 and 100.0 Bq∙kg−1) than in NPK fertilizers with the range of values (2.0 Bq∙kg−1 to 90.0 Bq∙kg−1). This observation was in agreement with the study by Jibiri and Fasae [7], that low activity concentration of 40K is associated SSP and high values with NPK fertilizers. It could also be observed that the highest value of the gross beta activity concentrations in NPK fertilizers was from Ondo State (Od) samples (90.0 Bq∙kg−1) and the lowest was obtained in Ogun state (Og) samples. Hence, from the previous work by Jibiri and Fasae [7] and confirmed in this study showed that there is a direct relationship between the gross beta and alpha activities with the radionuclide contents in the samples. High 226Ra and 40K concentrations will indicate high gross alpha and beta activities in the samples. This is in agreement with the study by Aytas et al., [12]. Generally we observed that there are mixes of fertilizer products sold in a particular State with varying radionuclide contents hence they will present different radioactivity scenario to natural radioactivity in farmlands in the States where they will be used for agricultural purposes. From Table 2, the gross beta activity concentration for farm soil samples from the northern part of Nigeria varied from 360.0 Bq∙kg−1 to 570.0 Bq∙kg−1 while for the alpha activities it varied from 8.0 Bq∙kg−1 to 40.0 Bq∙kg−1. The gross beta activity concentrations for farm soil samples from the southern part of Nigeria varied from 200.0 Bq∙kg−1 to 230.0 Bq∙kg−1 while the gross alpha activity concentrations varied from 10.0 Bq∙kg−1 to 20.0 Bq∙kg−1. The results show that the gross activity concentrations in farm soil samples in the northern part of the country are higher than the values obtained in the southern part of the coun-
 (1)
(1)
try. It could also be observed that the introduction of fertilizer into the farm soil may have elevated the concentration of radionuclides in the northern part of the country more than in the southern part of the country, thereby elevating the concentration of radionuclides in food stuff possibly from the northern region of the country. As reported by Jibiri et al., [6], fertilizer largely used to improve soil fertility is seen to have enhanced the quantity of natural radionuclides in the soil and consequently through uptake are made available to the plants. However, the gross alpha and beta activity concentrations values obtained in this study were lower than the range of values 141 Bq∙kg−1 to 2589 Bq∙kg−1 for beta activity concentrations and 109 Bq∙kg−1 to 660 Bq∙kg−1 for gross alpha activity concentrations obtained in West Bengal [13,14].
3.2. Trace Heavy Elemental Concentration in Super Phosphate Fertilizer, N-P-K (15-15-15) and Phosphate Rock Samples
The results of the elemental analysis for the soil samples are presented in Table 3. It could be observed that the elemental concentrations were higher in phosphate rock samples followed by SSP. The values were relatively low in the NPK samples. However, while heavy elements were not detectable in the phosphate rocks of different origins and in the SSP they were detected in the NPK fertilizer samples. Micronutrients such as Cu, Ni and Zn are essential for plant life while Cd, Cr and Pb are not essential elements but can be classified as toxic to plants. When these heavy metal concentration is compared with the mean concentration in the Earth’s crust (Cd, 0.5 ppm; Cr, 200 ppm; Cu, 100 ppm; Ni, 80 ppm; Pb,16 ppm; Zn, 50 ppm, as reported by Sauerbeck [15]it may be observed that the analysed samples are enriched in Cd, Ni, Pb and Zn since under natural conditions, Pb occurs in the soil at 5 to 20 ppm, cadmium at 0.05 to 0.5 ppm, and arsenic at 1 to 5 ppm. In highly urbanized areas, Pb occurs in the soil at 100 to 200 ppm, cadmium at 1 to 5 ppm, and arsenic at 10 to 20 ppm. Threshold levels where these elements could be harmful by direct ingestion are generally higher than levels commonly found in urban soils. For example, US government threshold levels for Pb in the soil are greater than 500 ppm and greater than 20 ppm of cadmium [16] if the comparison is performed with the world range for phosphate rocks, i.e. Cd, 1 - 100 ppm; Cr, 7 - 500 ppm; Cu, 1 - 1000 ppm; Ni, 0 - 100 ppm; Pb, 0 - 10 ppm; Zn, 4 - 1000 ppm [5] and lesser in the Tokyo region (0.05 ppm of cadmium and 0.5 ppm of lead and zinc) [17] and in Europe [18]. From the values obtained in Table 3, the concentrations of heavy metals considered generally to be toxic varied from BDL to 3.73 mg∙kg−1. These values were less than the values obtained internationally for which Cd ranged from <1 to 36.8 mg∙kg−1, with a median of 33.2 mg∙kg−1 for phosphatic fertilizers [19]. This may be an indication that suggests that the addition of heavy metals into the soil through the application of inorganic fertilizer do not significantly raise their concentration in soils to harmful levels. This assertion was supported by various international studies that the entry of heavy metals, especially Cd, Pb and Ni, into the human food chain may not be associated with inorganic fertilizers but to other anthropogenic sources, domestic and industrial residues/wastes and pesticides [20]. It is likely that the continued long use of fertilizer may elevate the concentrations of these elements in the farm soil if no reduction and remediation procedures are considered.
Table 3. Elemental concentrations in Super Phosphate fertilizers, N-P-K (15-15-15) fertilizers and Phosphate rock samples.

*± in NPK indicates the standard deviation value of the six samples analyzed.
4. CONCULSION
The gross beta and alpha activity concentrations and trace heavy elemental levels in the fertilizer samples used in Nigeria have been determined. NPK fertilizers were found to exhibit high gross beta activity concentrations while SSP exhibit high gross alpha activity concentrations. The farm soil samples from the northern part of the country exhibited high gross alpha and beta activities compared to farm soil samples from the Southern parts of Nigeria. The gross alpha and beta in the samples were good indicators for the presence of the natural radionuclide contents in the fertilizer samples. Though the concentrations of the heavy metals were very low in the fertilizer samples analyzed in this work compared to literature values it is anticipated that continually long use of the fertilizers in the farm soil may elevate their concentrations to toxic levels which may pose a health risk to the population if remedial actions are not considered.
5. ACKNOWLEDGEMENTS
We are grateful to the National Fertilizer Company, Onne, PortHarcourt, Rivers-State, for access into the company to take some samples. We are grateful to Mr. Hamidu of School of Agriculture Kaduna, Mr. Borisade the director of the Nigerian Prison farms and the staff of The National Superphosphate fertilizer, Kaduna for their cherished assistance. We are also grateful to the Center of Energy Research and Training (CERT) Ahmadu Bello University, Zaria, Nigeria and Mrs. Onoja R.A. for the access to the equipments.
REFERENCES
- Abdel-Haleem, A.S., Sroor, A., El-Bahi, S.M. and Zohny, E. (2001) Heavy metals and rare earth elements in phosphate fertilizers components using instrumental neutron activation analysis. Applied Radiation and Isotopes, 55, 569-573. doi:10.1016/S0969-8043(01)00098-7
- Fabiano, T.C. and Daniel M.B. (2006) Radionuclides, heavy metals and fluorine incidence at Tapira phosphate rocks, Brazil, and their industrial (by) products. Environmental Pollution, 139, 232-243. doi:10.1016/j.envpol.2005.05.014
- Pozin, M.E. (1986) Fertilizer manufacture. Mir Publishers, USSR 82 KVS, 234-236.
- Tisdale, S.L., Nelson, W.L. and Beaton, J.D. (1985) Soil fertility and fertilizers. 4th Edition, Macmillan Publishing Company, New York, 188-239.
- Abdulwahab, R.H. and Awadh, M. Al J. (1994) Elemental concentration of selected soil and water samples from AlMadinah Area, Saudi Arabia. Journal of King Saud University Science, 6, 127-136.
- Jibiri, N.N., Farai, I.P. and Alausa, S.K. (2007) Estimation of annual effective dose due to natural radioactive elements in ingestion of foodstuffs in tin mining area of JosPlateau, Nigeria. Journal of Environmental Radioactivity, 94, 31-40. doi:10.1016/j.jenvrad.2006.12.011
- Jibiri, N.N. and Fasae, P.K. (2011) Activity concentration of 226Ra, 232Th and 40K in brands of fertilizers used in Nigeria. Radiation Protection Dosimetry, 148, 132-137. doi:10.1093/rpd/ncq589
- McDonald, P., Jackson, D., Leonard, D.R.P. and McKay, K. (1999) An assessment of 210Pb and 210Po in terrestrial foodstuffs from regions of potential technological enhancement in England and Wales. Journal of Environmental Radioactivity, 43, 15-29. doi:10.1016/S0265-931X(98)00017-4
- Fernandez, G., Rodriquez, I.M., Castro, G.V., Carrazana, G. and Martizez, R.N. (2004) Radiological surveillance of foods and drinking water in the Cuban Republic. Proceedings of the 11th Conference of the International Radiation Protection Association (IRPA), Madrid, 23-28 March 2004.
- Akpa, T.C., Mallam, S.P., Ibeanu, I.G.E. and Onoja, R.A. (2004) Characteristcs of gross alpha/beta proportional counter. Nigerian Journal of Physics, 16, 13-18.
- Rowel, D.L. (1993) Soil science methods and applications. University of Reading, Longman.
- Aytas, S., Yusan, S., Aslani, M.A.A., Karali, T., Turkozu, D.A., Gok, C., Erenturk, S., Gorkce, M. and Oguz, K. (2012) Determination and evaluation of natural radioactivity and heavy metal levels in surface sediments of Maritza and Tundja River. Scientific Technological Research Council of Turkey (TUBITAK) and Bulgarian Academy of Science (BAS), Contract ref No: 106Y201, INSINUME, Brussels, 12-15 June 2012.
- Ghosh, D., Deb, A., Bera, S., Sengupta, R. and Patra, K.K. (2008) Measurement of natural radioactivity in chemical fertilizer and agricultural soil: Evidence of high alpha activity. Environmental Geochemistry and Health, 30, 79- 86. doi:10.1007/s10653-007-9114-0
- Selcuk, Z.O., Cevlan, H. and Dogru, M. (2009) Gross alpha and beta radioactivity concentration in water, soil and sediment of the Bendimahi River and Van Lake (Turkey). Environmental Monit, 148, 39-46.
- Sauerbeck, D. (1992) Conditions controlling the bioavailability of trace elements and heavy metals derived from phosphate fertilizers in soils. Proceeding of IMPHOS Conference on Phosphorus, Life and Environment, Casablanca, 8-11 September 1992, 418-448.
- Kitagishi, K. and Yamane, H. (1981) Heavy metal pollution in soils of Japan. CRC Press, Tokyo, 19-26.
- Hodel, D.R. and Chang, A.C. (2009) Trace elements and urban gardens. University of Califonia Cooperative Extension Los Angeles County. http://celosangeles.ucdavis.ed
- Kabata-Pendias, A. and Pendias, H. (2009) Trace elements in soils and plants. 3rd Edition, CRC Press, Boca Raton, 3-24.
- Modaihsh, A.S., Al-Swailem, M.S. and Mahjoub, M.O. (2004) Metals content of commercial inorganic fertilizers used in the Kingdom of Saudi Arabia. Sultan Qaboos University Journal for Scientific. Research Agricultural and Marine Sciences, 9, 21-25.
- Godson, R.E.E., Mynepali. A. and Sridhar, K.C. (2004) Soil quality near a chemical fertilizer industry at PortHarcourt Nigeria. African Journal of Environmental Assessment and Management, 8, 19-26.