Engineering
Vol.4 No.11(2012), Article ID:24583,4 pages DOI:10.4236/eng.2012.411102
Concept Selection for Hydrocarbon Field Development Planning
Instituto Mexicano del Petróleo, Mexico City, Mexico
Email: *ersanche@imp.mx
Received August 28, 2012; revised September 26, 2012; accepted October 10, 2012
Keywords: Oil; Planning; Deep Water; Concept; Front End Loading
ABSTRACT
Two methodologies to rank exploitation scenarios for hydrocarbon fields during screening and concept selection stages are described and compared. First a selection based on net present value valuation is introduced and an explanation on its limitations for field planning are given thus, a second selection based on a multiattribute decision model where other technical factors not directly associated to economics such as operability and reliability are considered. A comparison of net present value and the multiattribute decision model on a concept selection study case shows differences on the scenario selection for exploitation. Sources of the different outcomes between the two methodologies are identified. A stochastic analysis for the multiattribute decision model is performed to have a complete view of the possible outcomes since the factors in the multiattribute decision model are measured qualitatively and their values can vary depending on experts’ knowledge and experience. Recommendations obtained from the methodologies studied for screening and concept selection are given.
1. Field Development Planning Process
For the exploitation of a hydrocarbon field the process of identifying the concepts technically feasible and associated to the best economical performance is called field development planning process. Oil and gas exploration and exploitation require a large amount of economical resources mainly in offshore environments thus, field development planning has the main objective of maximizing the revenue for a given investment, this is maximizing the utility index (UI) defined as UI = NPV/NPI, where NPV is the net present value and NPI is the net present investment value. Scenarios with the greatest median (P50) NPV and lowest spread between P10 and P90 NPV will be selected [1]. Economical evaluation becomes complicated since for example date of initial production and price of hydrocarbons vary randomly.
It is convenient to identify all the feasible concepts to exploit a field, especially for undeveloped fields, to assure that any possible concepts that provide value is not discarded. This process is usually performed in a workshop where personnel representing the technical specialties involved participate defining the information available, the objectives of the project and the strategy to reach the objectives, as a result of this workshop a field development concepts matrix is obtained. This matrix usually has a decision variable as heading in each column for example, hydrocarbon to be exploited, hub concept, well type, transport option, etc. an example of this matrix is shown in Table 1. The number of feasible field development scenarios is the result of all possible combinations for each decision variable, for Table 1 the number of scenarios is 2 × 5 × 4 × 2 = 80.
It is recommended to validate the technical feasibility of each of the concepts since a decision variable can be feasible on its own but when combined with others the outcome might not be feasible, from Table 1 for example, oil & gas exploitation transported by tanker would not be feasible since gas cannot be transported in a tanker.
After the technical screening, NPI for each option is estimated by using commercial data bases and operators experience; it is important to estimate costs during the
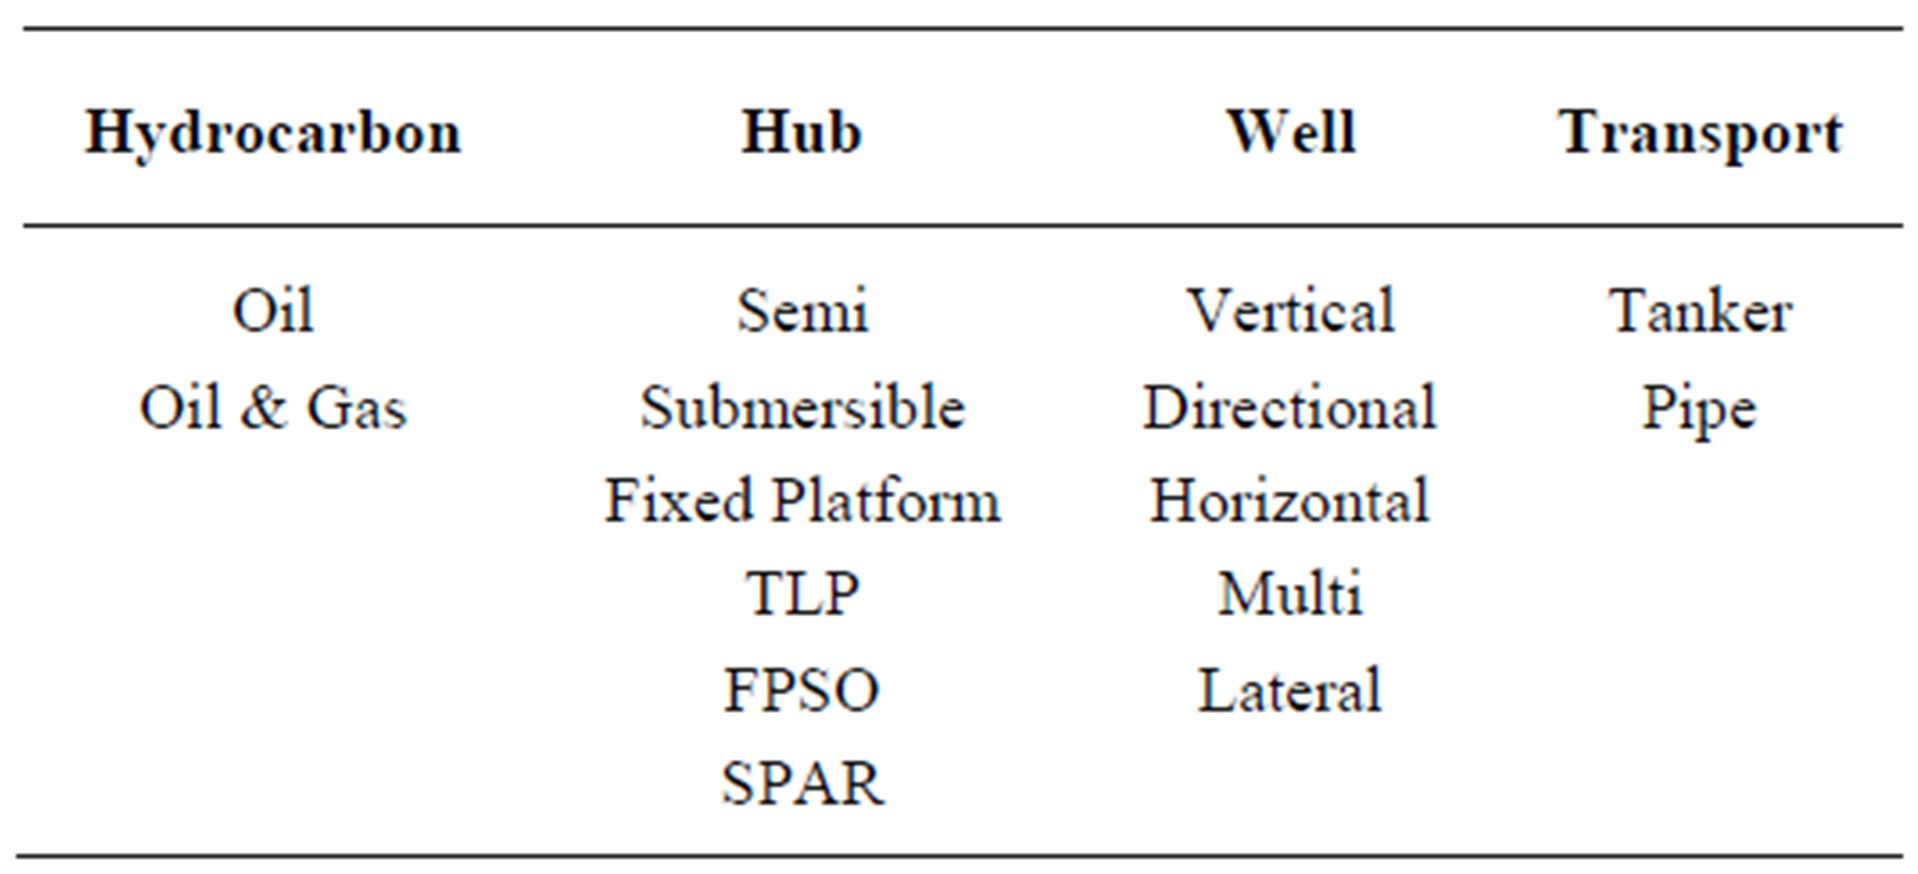
Table 1. Example of field development concepts matrix.
full service life of the field from planning studies up to abandonment. Well costs are the major expenditure thus, well type selection is usually done following the same approach presented in this work and is performed simultaneously to the field development planning activities.
On the other hand, the production profile associated to each development option has to be calculated to estimate the income due to hydrocarbons sale. Production profiles can be calculated from simple models like exponential declination or using more complex ones based on energy balance where reservoir, wells and pipe systems are coupled in a model to estimate the production versus time, this later process can be cumbersome and usually consumes several hours depending on the model complexity and computer process speed.
The annual income associated to hydrocarbons sale is estimated from the production profile assuming economical premises such as oil price, gas price and interest rate. NPV for each field development option is estimated from the annual income due to hydrocarbons sale and the annual expenditure associated to capital expenditure (Capex), drilling expenditure (Drillex), operational expenditure (Opex) and abandonment expenditure (Abex).
Since NPV for each field development option involves a high level of uncertainty, probability distributions are assigned to the most relevant variables such as volume of reserves, oil & gas sale price, Drillex and Capex, etc.; this leads to perform stochastic analysis varying the relevant variables within their upper and lower limits by the Montecarlo method and analyze the outcomes in a probabilistic manner. A flow chart of the process described previously is shown in Figure 1, where it is depicted that the coupling of the reservoir, well and pipes models integrates the asset model from which the production profiles are determined and provide the income due to hydrocarbons sale. Stochastic analysis is due to the random nature of the variables involved in these models.
As mentioned, well costs are the major expenditure of the total costs to develop a field thus, it is recommended to find the optimum number of wells for a given development option, a practical approach for finding the optimum number is by plotting NPV versus UI (NPV/NPI) where UI is the investment efficiency ratio. The objective is finding the number of wells that maximizes NPV and UI simultaneously for a given development option, this leads to find the number of wells that generates the maximum economical value with the best investment efficiency since production versus number of wells is governed by reservoir characteristics.
2. Concept Selection Study Case
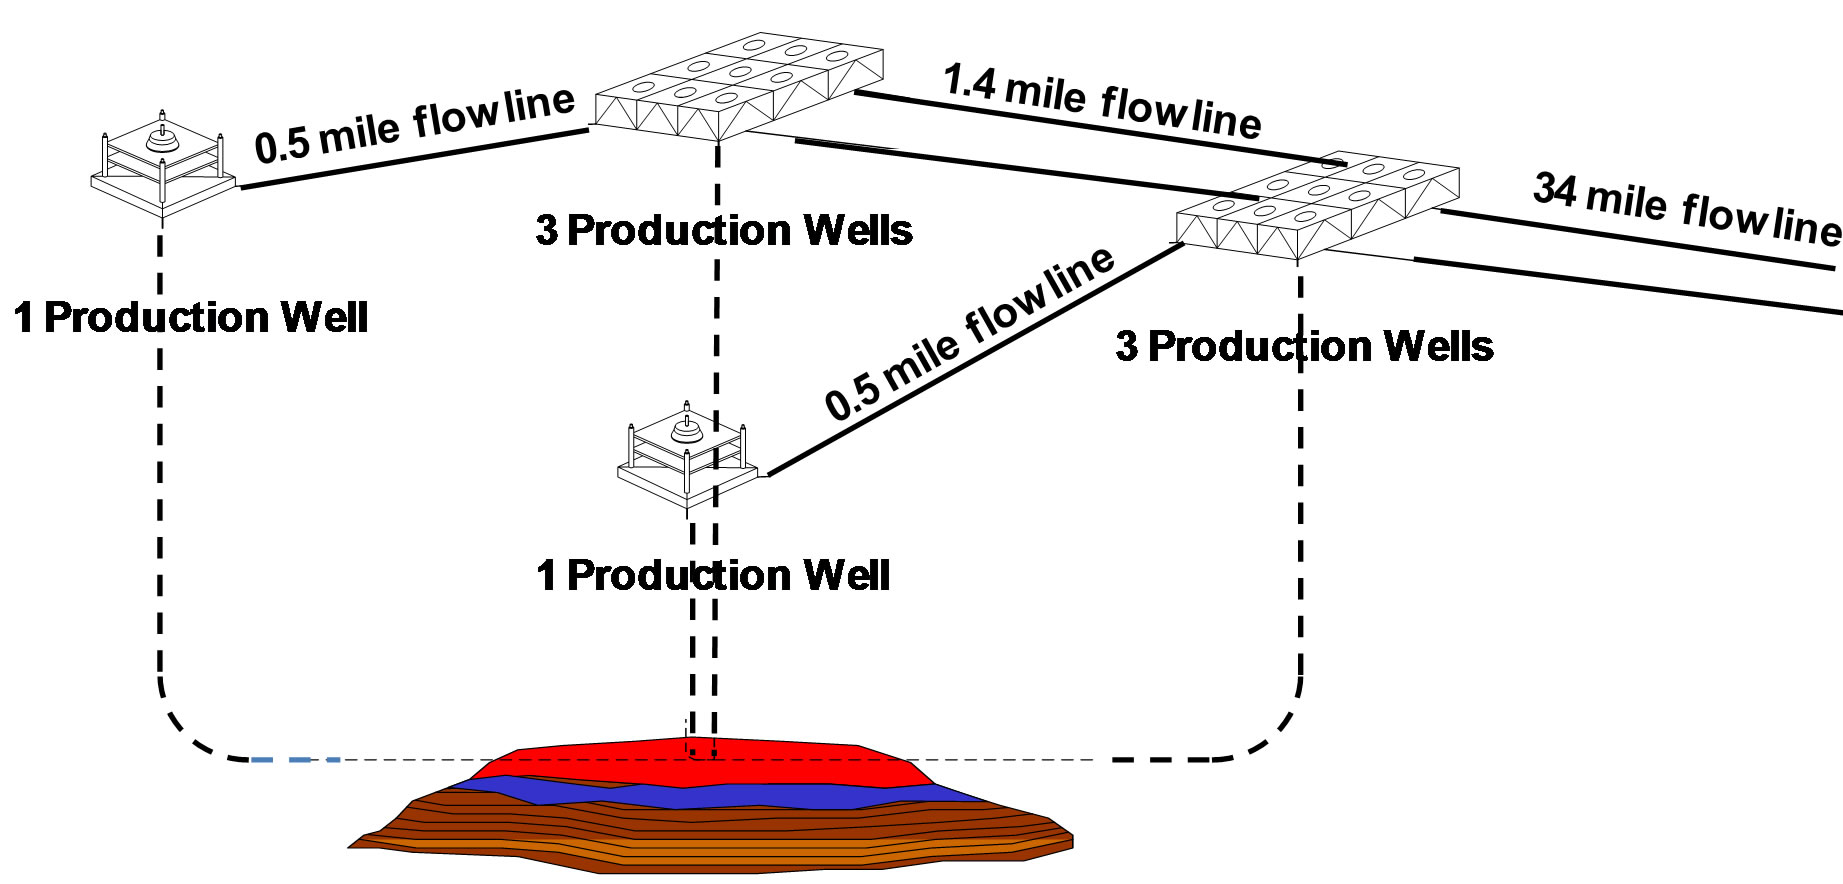
Figure 2 shows an example of three field developments concepts for an offshore gas field where a tie back to
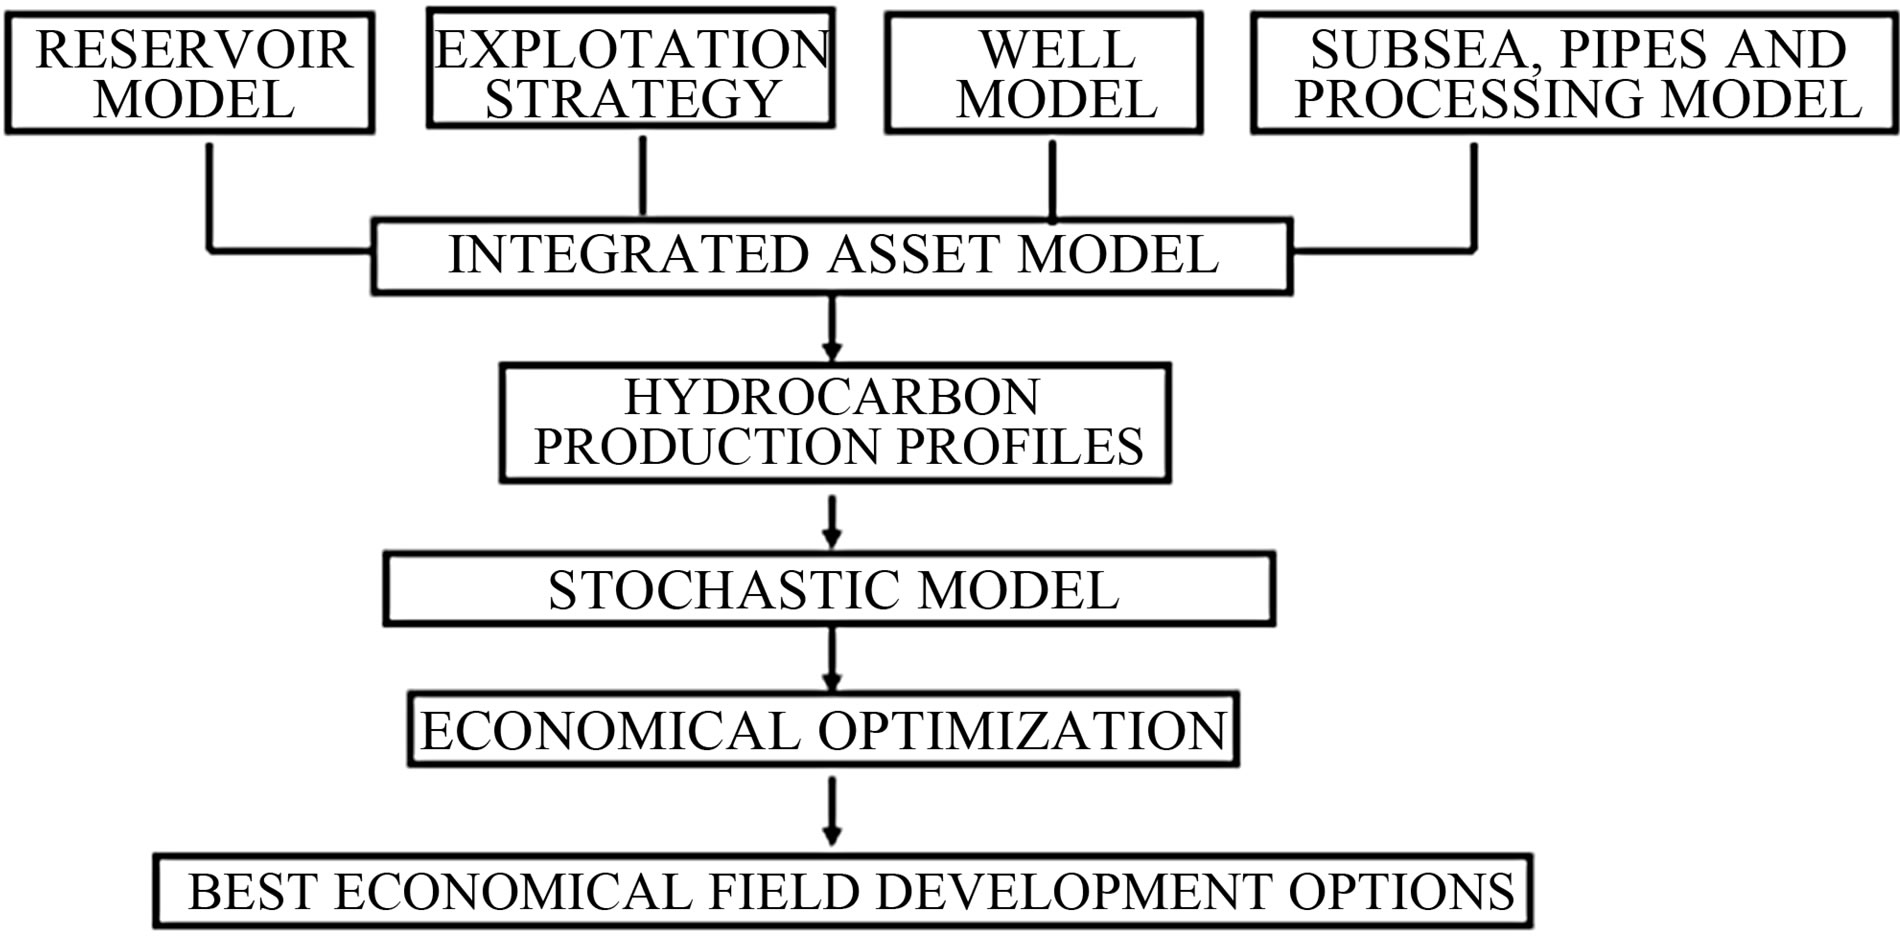
Figure 1. Field development planning flowchart.
 (a)
(a)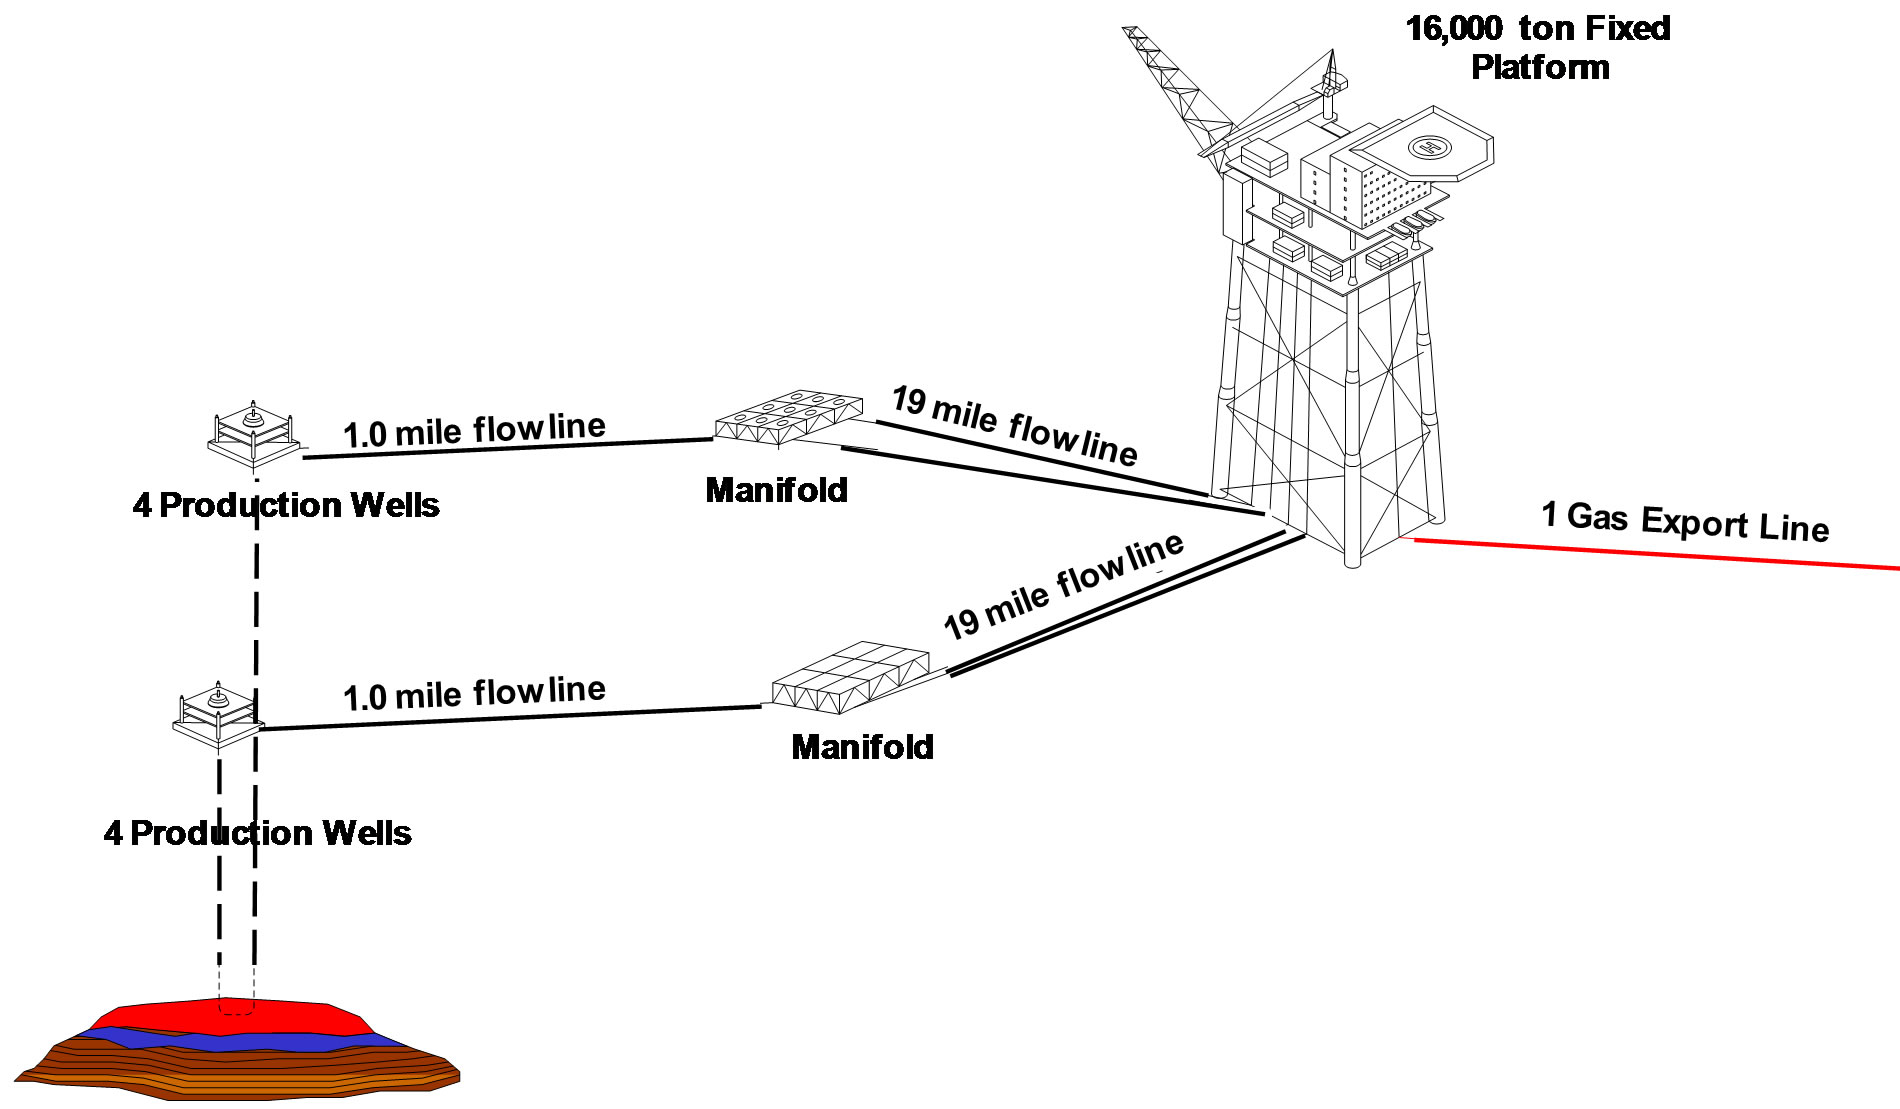 (b)
(b)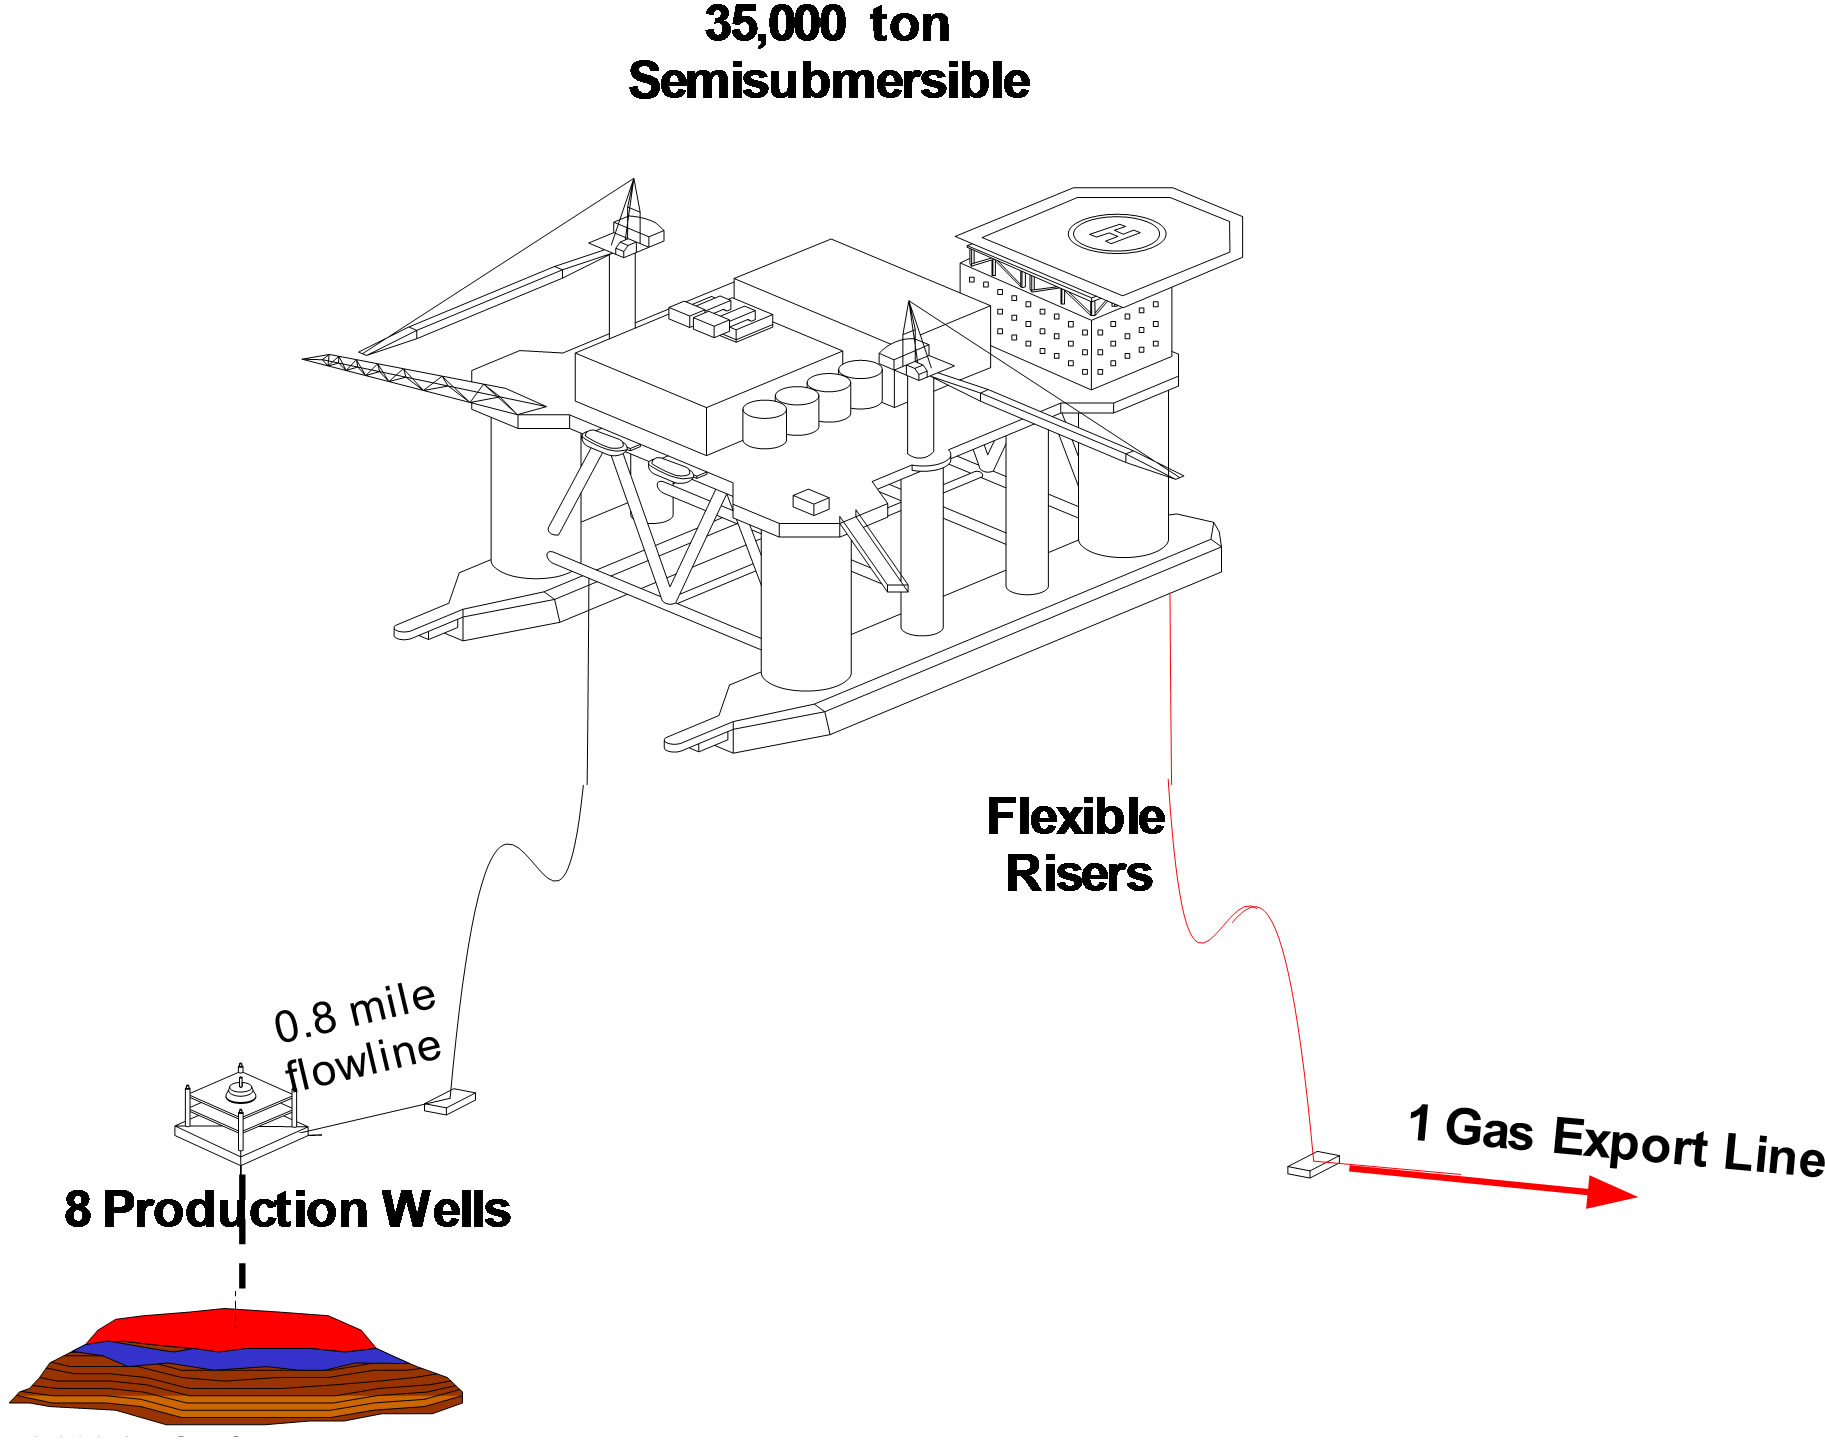 (c)
(c)
Figure 2. Examples of field development concepts for a gas field. (a) Tie back field development option; (b) Intermediate Fixed Platform field development option; (c) Semisubmersible field development option.
shore, see Figure 2(a) is compared with: an intermediate fixed platform with separation and compression facilities to send gas to shore, see Figure 2(b) and a semisubmersible platform just on top of the gas field to maximize recovery also with separation and compression facilities for sending gas to shore, see Figure 2(c).
For this example, the economical indexes NPV and UI are calculated varying the investment and gas production associated to the number of wells to identify the number that provides the best economical performance, this is maximizing NPV and UI simultaneously; results are shown in Figure 3 were income is measured in terms of NPV due to gas production and the investment efficiency ratio measured in terms of UI = NPV/NPI. Trade-off between NPV and UI as in Figure 3 shows for the fixed platform and semi submersible concepts that for the case of 6 wells, NPV and UI reach their maximum value simultaneously. For the tie back option NPV and UI do not reach their maximum value simultaneously thus, well number could be 4 or 6 depending on operator’s preference however, the 6 wells option would be preferred over the 4 wells since there is a 25% risk of production loss for the later if one well is bellow its expected production performance.
Table 2 shows the total cost (TC) considered for the analysis where the tie back option has the lowest investment followed by the semisubmersible and the fixed platform, these data is in accordance to the plots in Figure 3 since UI increases as NPI is reduced.
According to the Association for the Advancement of Cost Engineering (AACE) International’s Recommended Practices on Estimate Classification [2], for screening and concept selection purposes the project cost approximation are Cost Class 5 and 4 respectively which allows a cost dispersion between +100% to –50% and +50% to –25% respectively depending on the project. Figure 3 is a deterministic approach and since Cost Class 5 and 4 have been used, the cost dispersion is wide. Therefore, a stochastic approach is recommended to capture the effect of cost dispersion by a Montecarlo analysis of the NPV model were accumulated probability NPV curves associated to each well number would show the optimum well number associated to the highest expect NPV. Table 3 shows the probability distributions used for the input variables, triangular distributions are recommended to consider experts’ advice on maximum, medium and minimum costs. Deterministic approach used the medium values shown in Table 3.
Accumulated Probability NPV curves associated to each well number show that the 6 wells case is associated to the highest expect NPV, see Figure 4, this result confirms the well number determined from the deterministic analysis.
Figure 3 holds the premise that date of first production for the three development concepts is three years after drilling initiates thus, differences in terms of NPV and UI are due to the NPI and gas production associated only to the number of wells. However, it has to be considered that time for infrastructure construction and installation depends on complexity and size. Assuming for this example, that for the fixed platform and tie back concepts the construction and installation time is the same thus, first production for these two concepts remains three years after drilling initiates; for the semisubmersible option it is assumed that first production is the latest of the three concepts, starting production five years after drilling initiates this is, two years behind the tie back and the fixed platform first production. Therefore, income due to
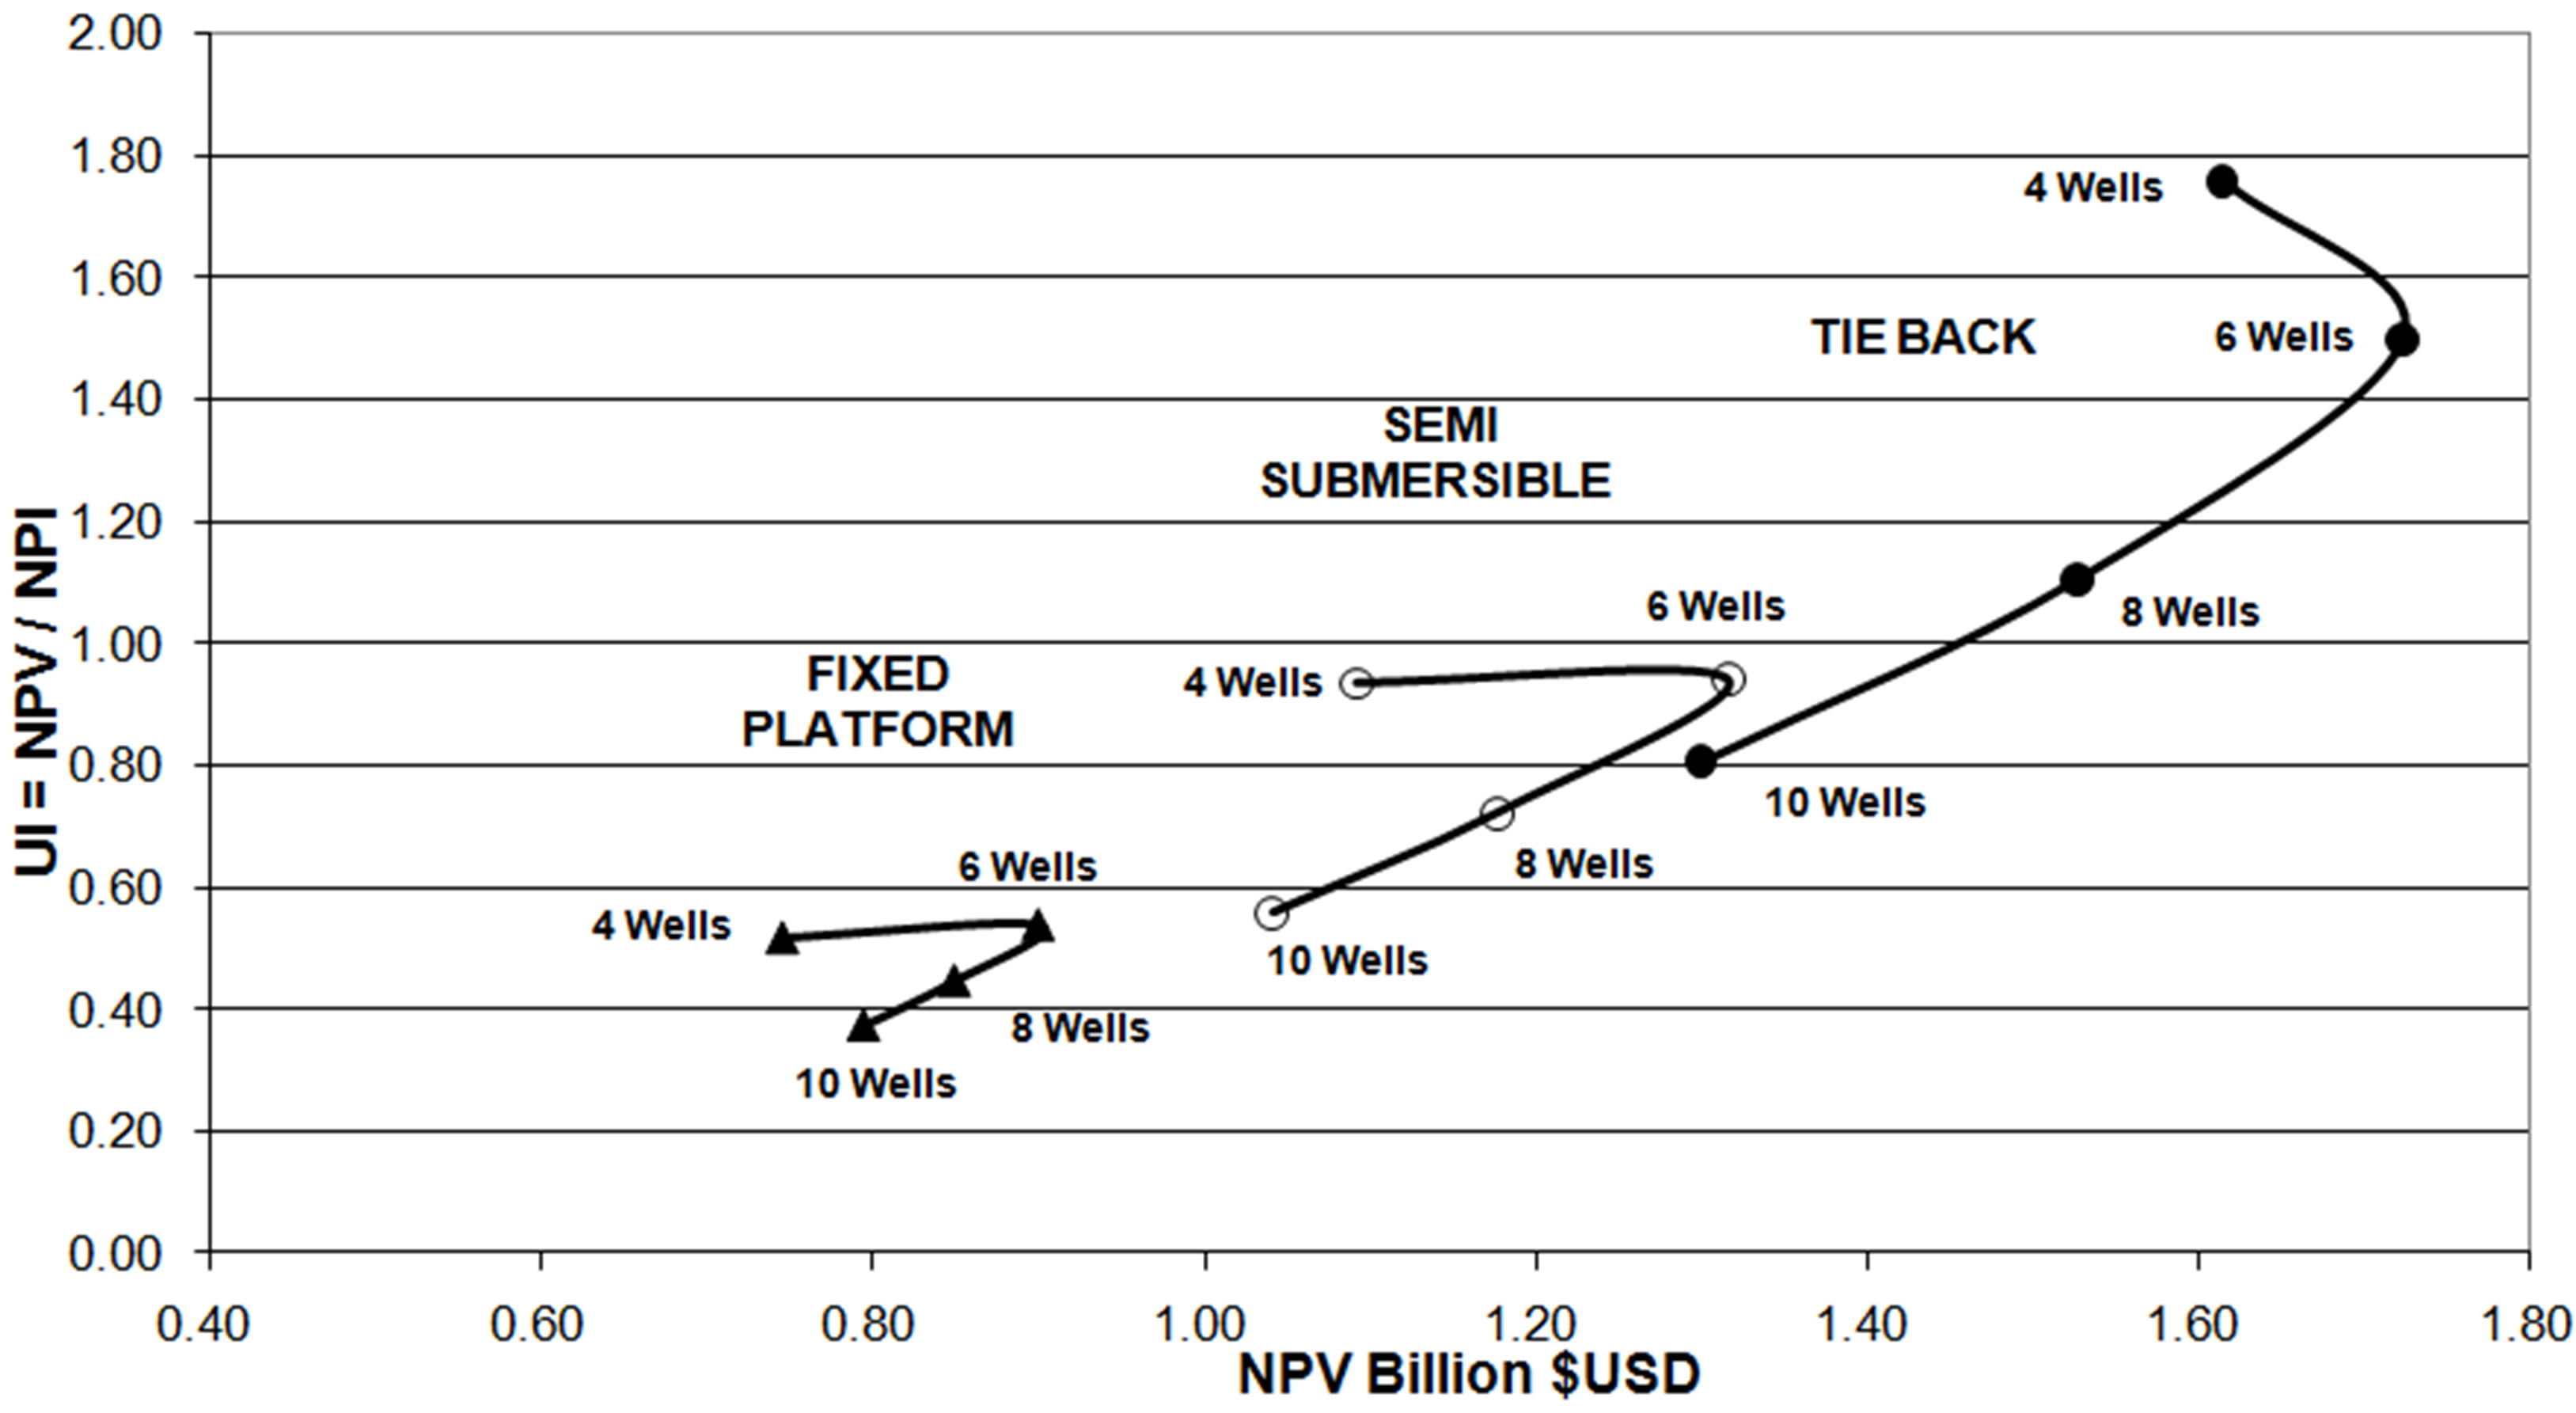
Figure 3. Optimizing the number of wells for a gas field based on economical indicators.
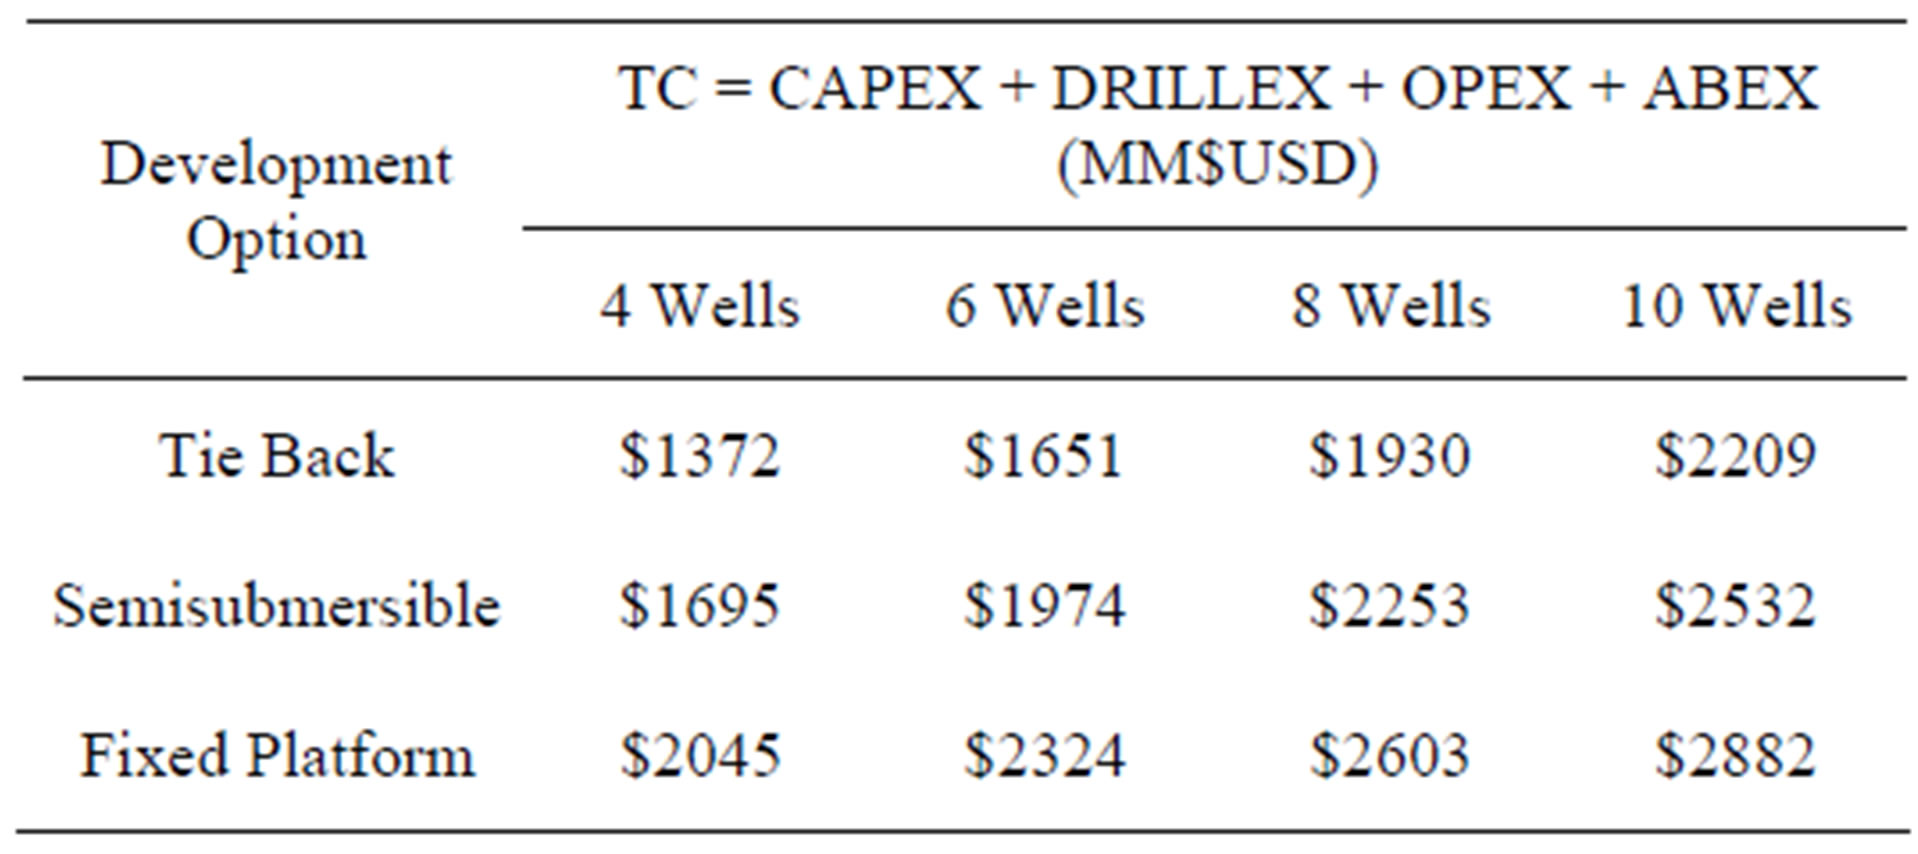
Table 2. TC = cost of infrastructure, drilling, operation and abandonment.
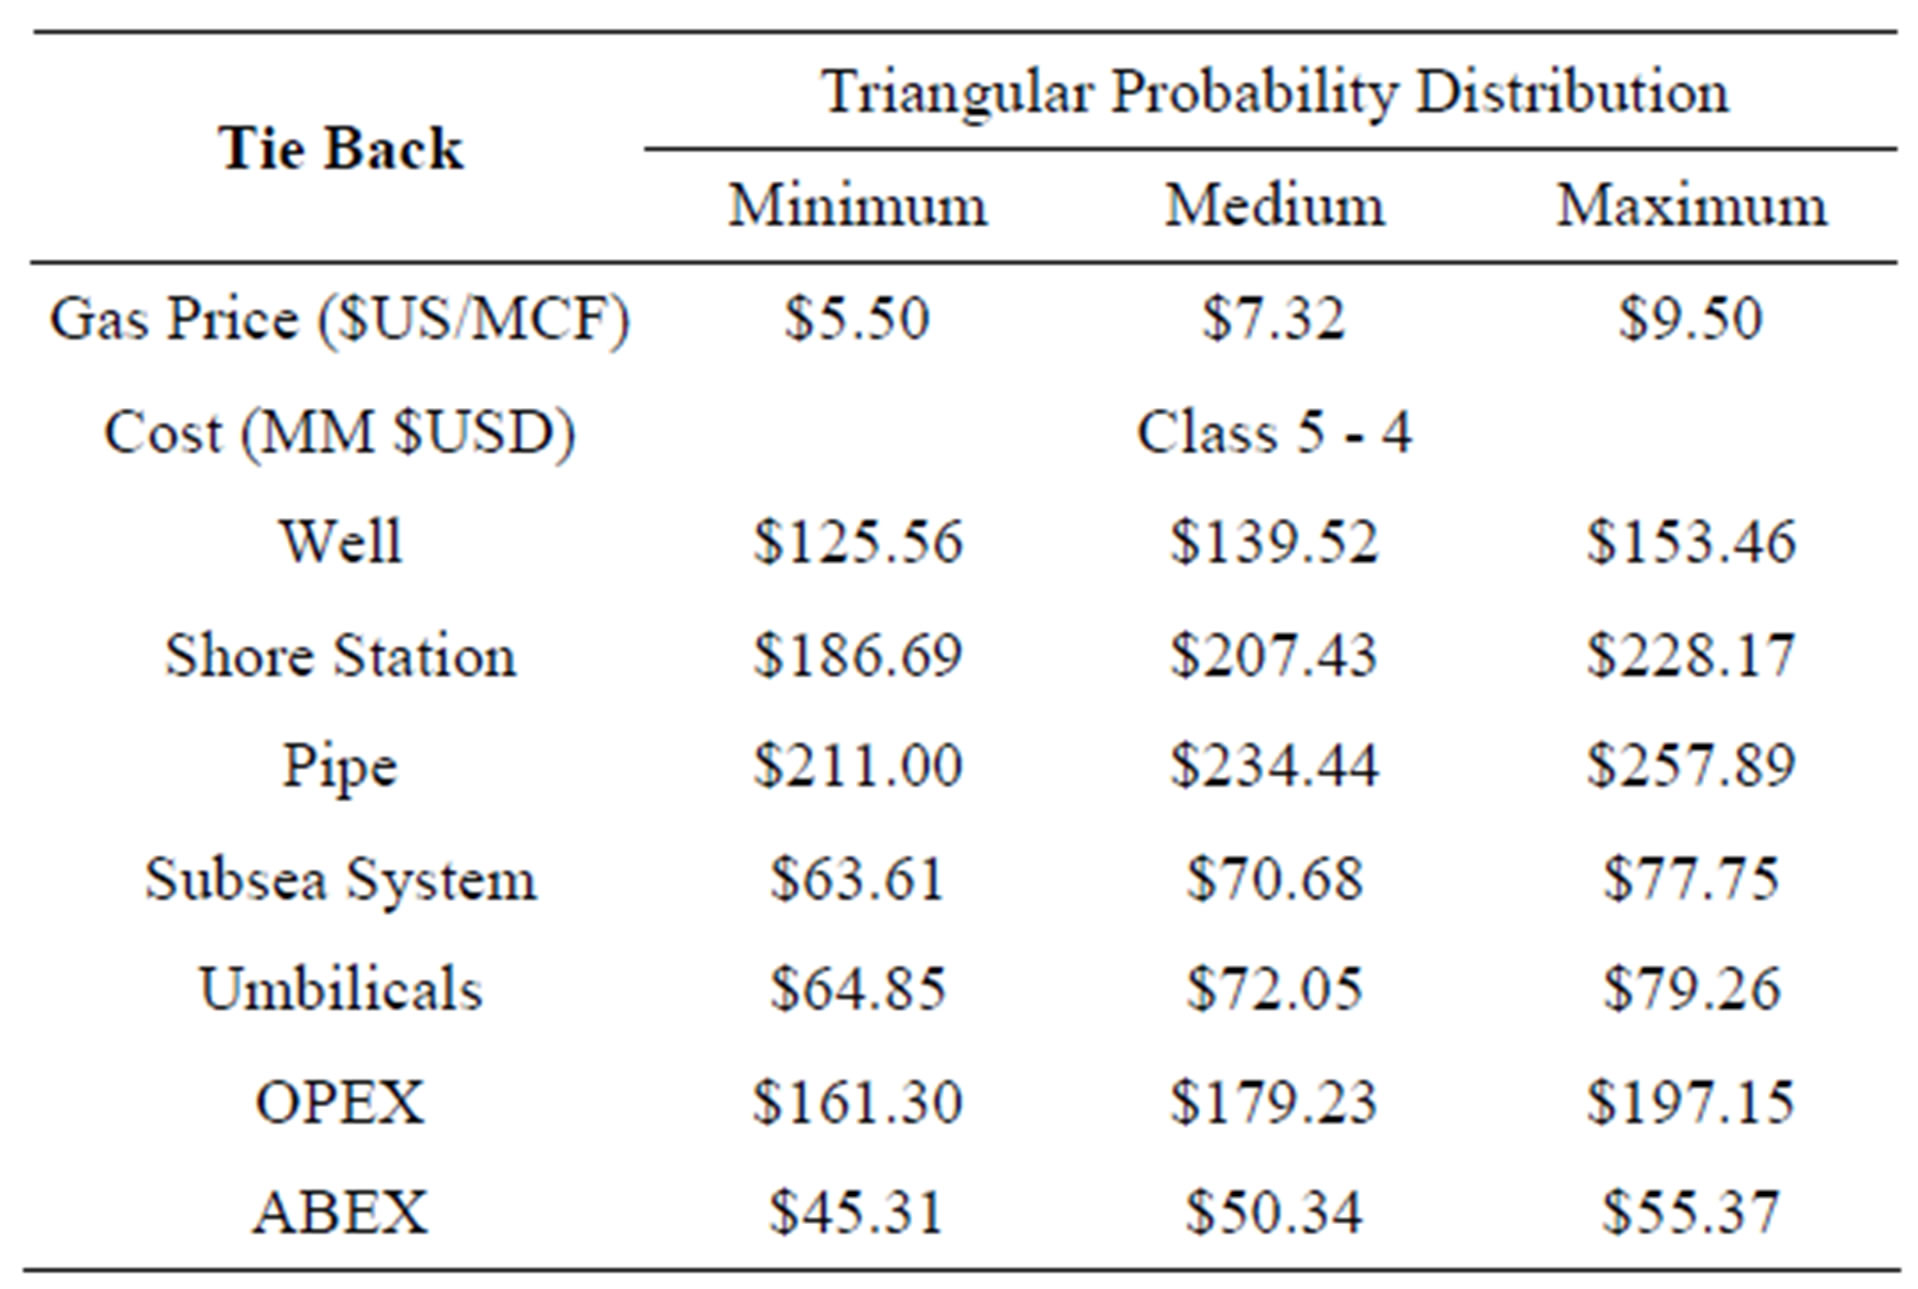
Table 3. Probability distributions for the tie back NPV and UI stochastic analysis.
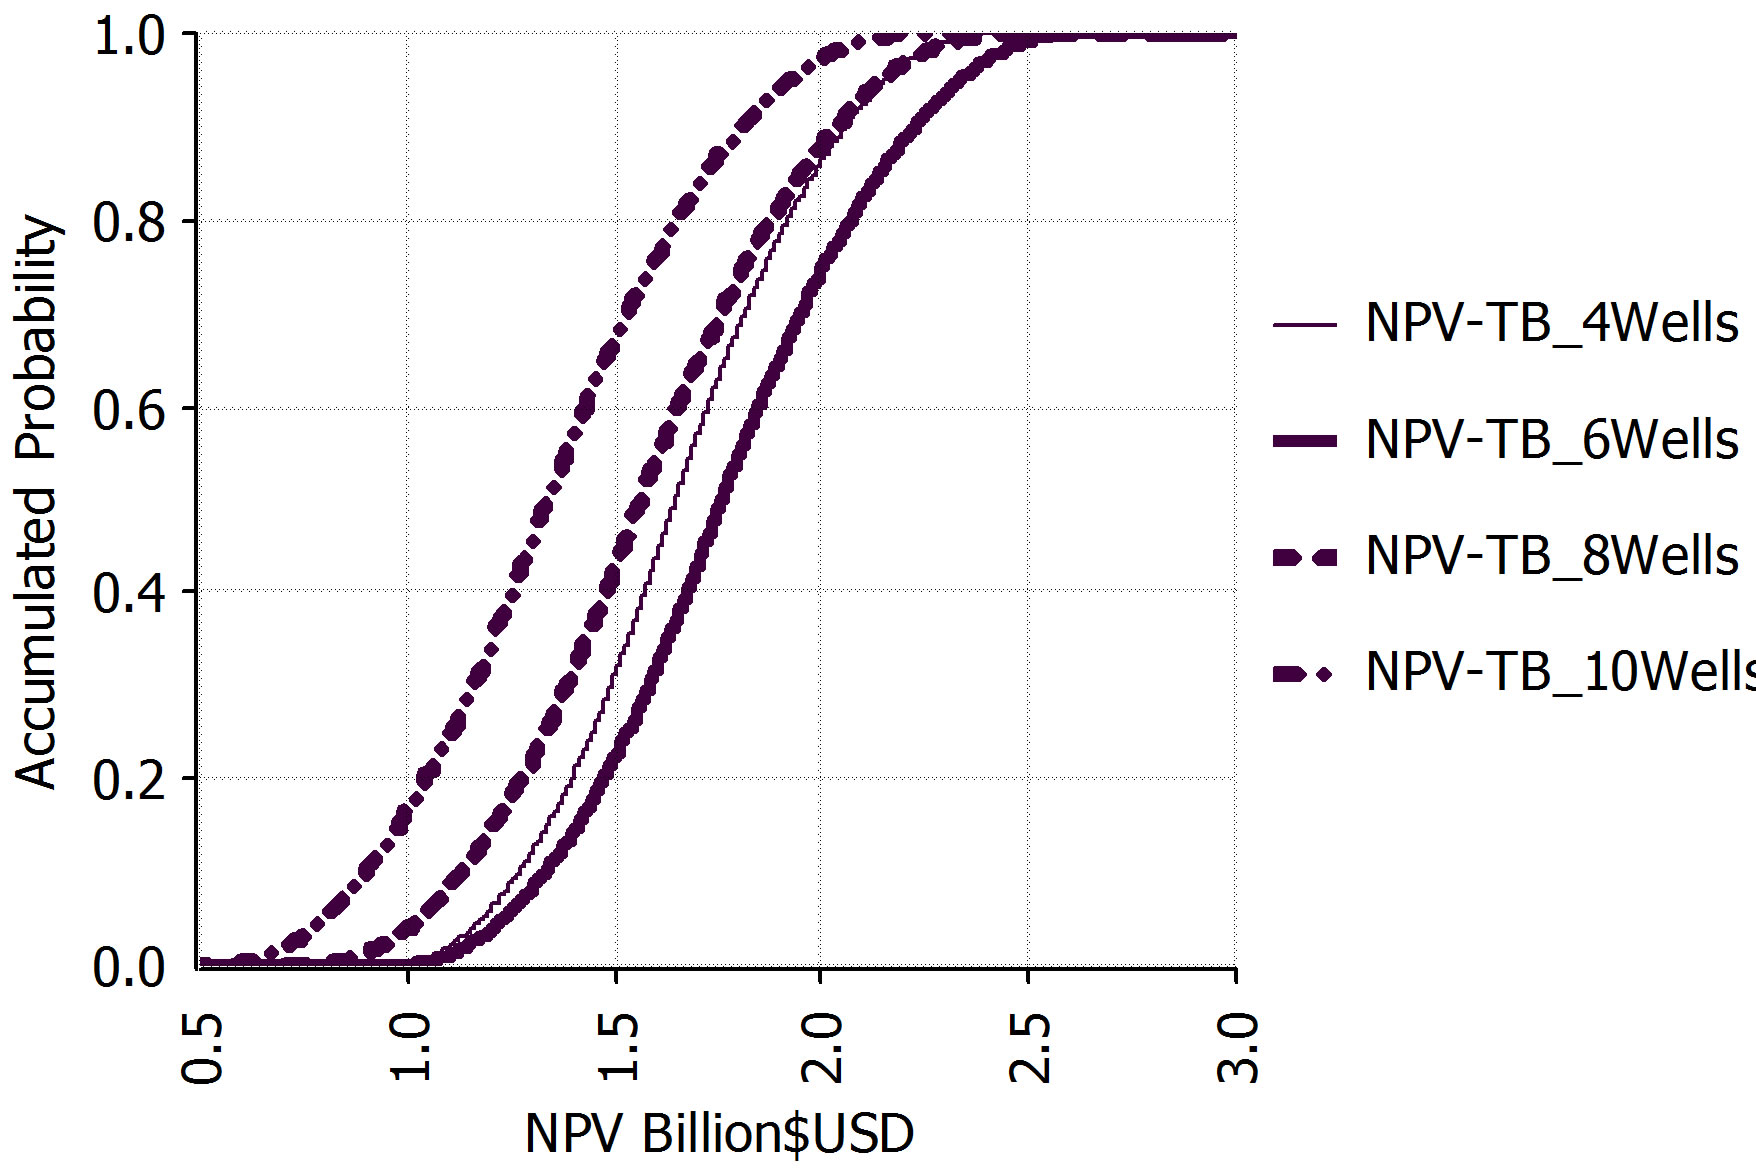
Figure 4. Tie back accumulated probability NPV curves for each well number.
hydrocarbons sale from the semisubmersible option is behind two years compared to the tie back and fixed platform concepts. This income delay effect is shown in Figure 5 and has a significant effect, it can be observed that the semisubmersible curve has moved to the extreme left when compared to Figure 3, and its NPV values are the lowest of the three concepts although from Table 2 it can be seen that it is not the option with the highest investment.
From Figure 5 it can be deduced that NPV is highly sensitive to the time interval between first investment and first production thus, the development option cannot be selected relying only on economical indexes since risk to have the first production delayed is related to the complexity to achieve production from a particular development option. Thus, a different approach that considers simultaneously economical indexes and other factors not easily appraised by economics have to be considered and is presented in this work as a subsequent step for development concepts selection after an initial economical screening has been completed.
To clarify the scope of this work the following premise has to be set: the procedure presented has the intention to optimize the screening and concept study process for concept selection undergone in the early stages of a project to exploit a hydrocarbon field thus, it is considered that a refined economical model is not required and is not usually used in the industry for these purposes. Screening and concept study are levels of project definition according to AACE.
It is well known according to AACE International’s Recommended Practices on Estimate Classification that for screening and concept selection purposes the project cost approximation used are Cost Class 5 and 4 respectively which allows a cost dispersion between +100% to –50% and +50% to –25% respectively depending on the project thus, given this allowance there is no point on building a complex economical model to include attributes like operability, time to first production, reliability, fabrication and installation which could be considered in qualitative terms but not in an economical model. It is worth to mention that even with the cost dispersion present in these initial stages of the project, the influence to increase the project value by making the right concept selection is highly relevant for the remainder of the project life, see Figure 6 where it is graphically showed the process were various technical feasible exploitation concepts are considered during the Planning stage and through a Front End Loading (FEL) process a final concept is selected which is extensively studied during the Define stage and a Front End Engineering Design (FEED) is produced for bidding purposes before the project is sanctioned for execution and expenditures rise considerably onwards.
3. Multiattribute Decision Model
It has been identified through the field development planning process that screening the exploitation concepts based only on economics do not take in account other aspects that can provide benefits additional to the economical ones during the service life. This is due to the fact that economics cannot easily appraise attributes like operability, reliability, constructability, schedule and future expandability as in contrast to attributes such as investment and income due to hydrocarbon production sale.
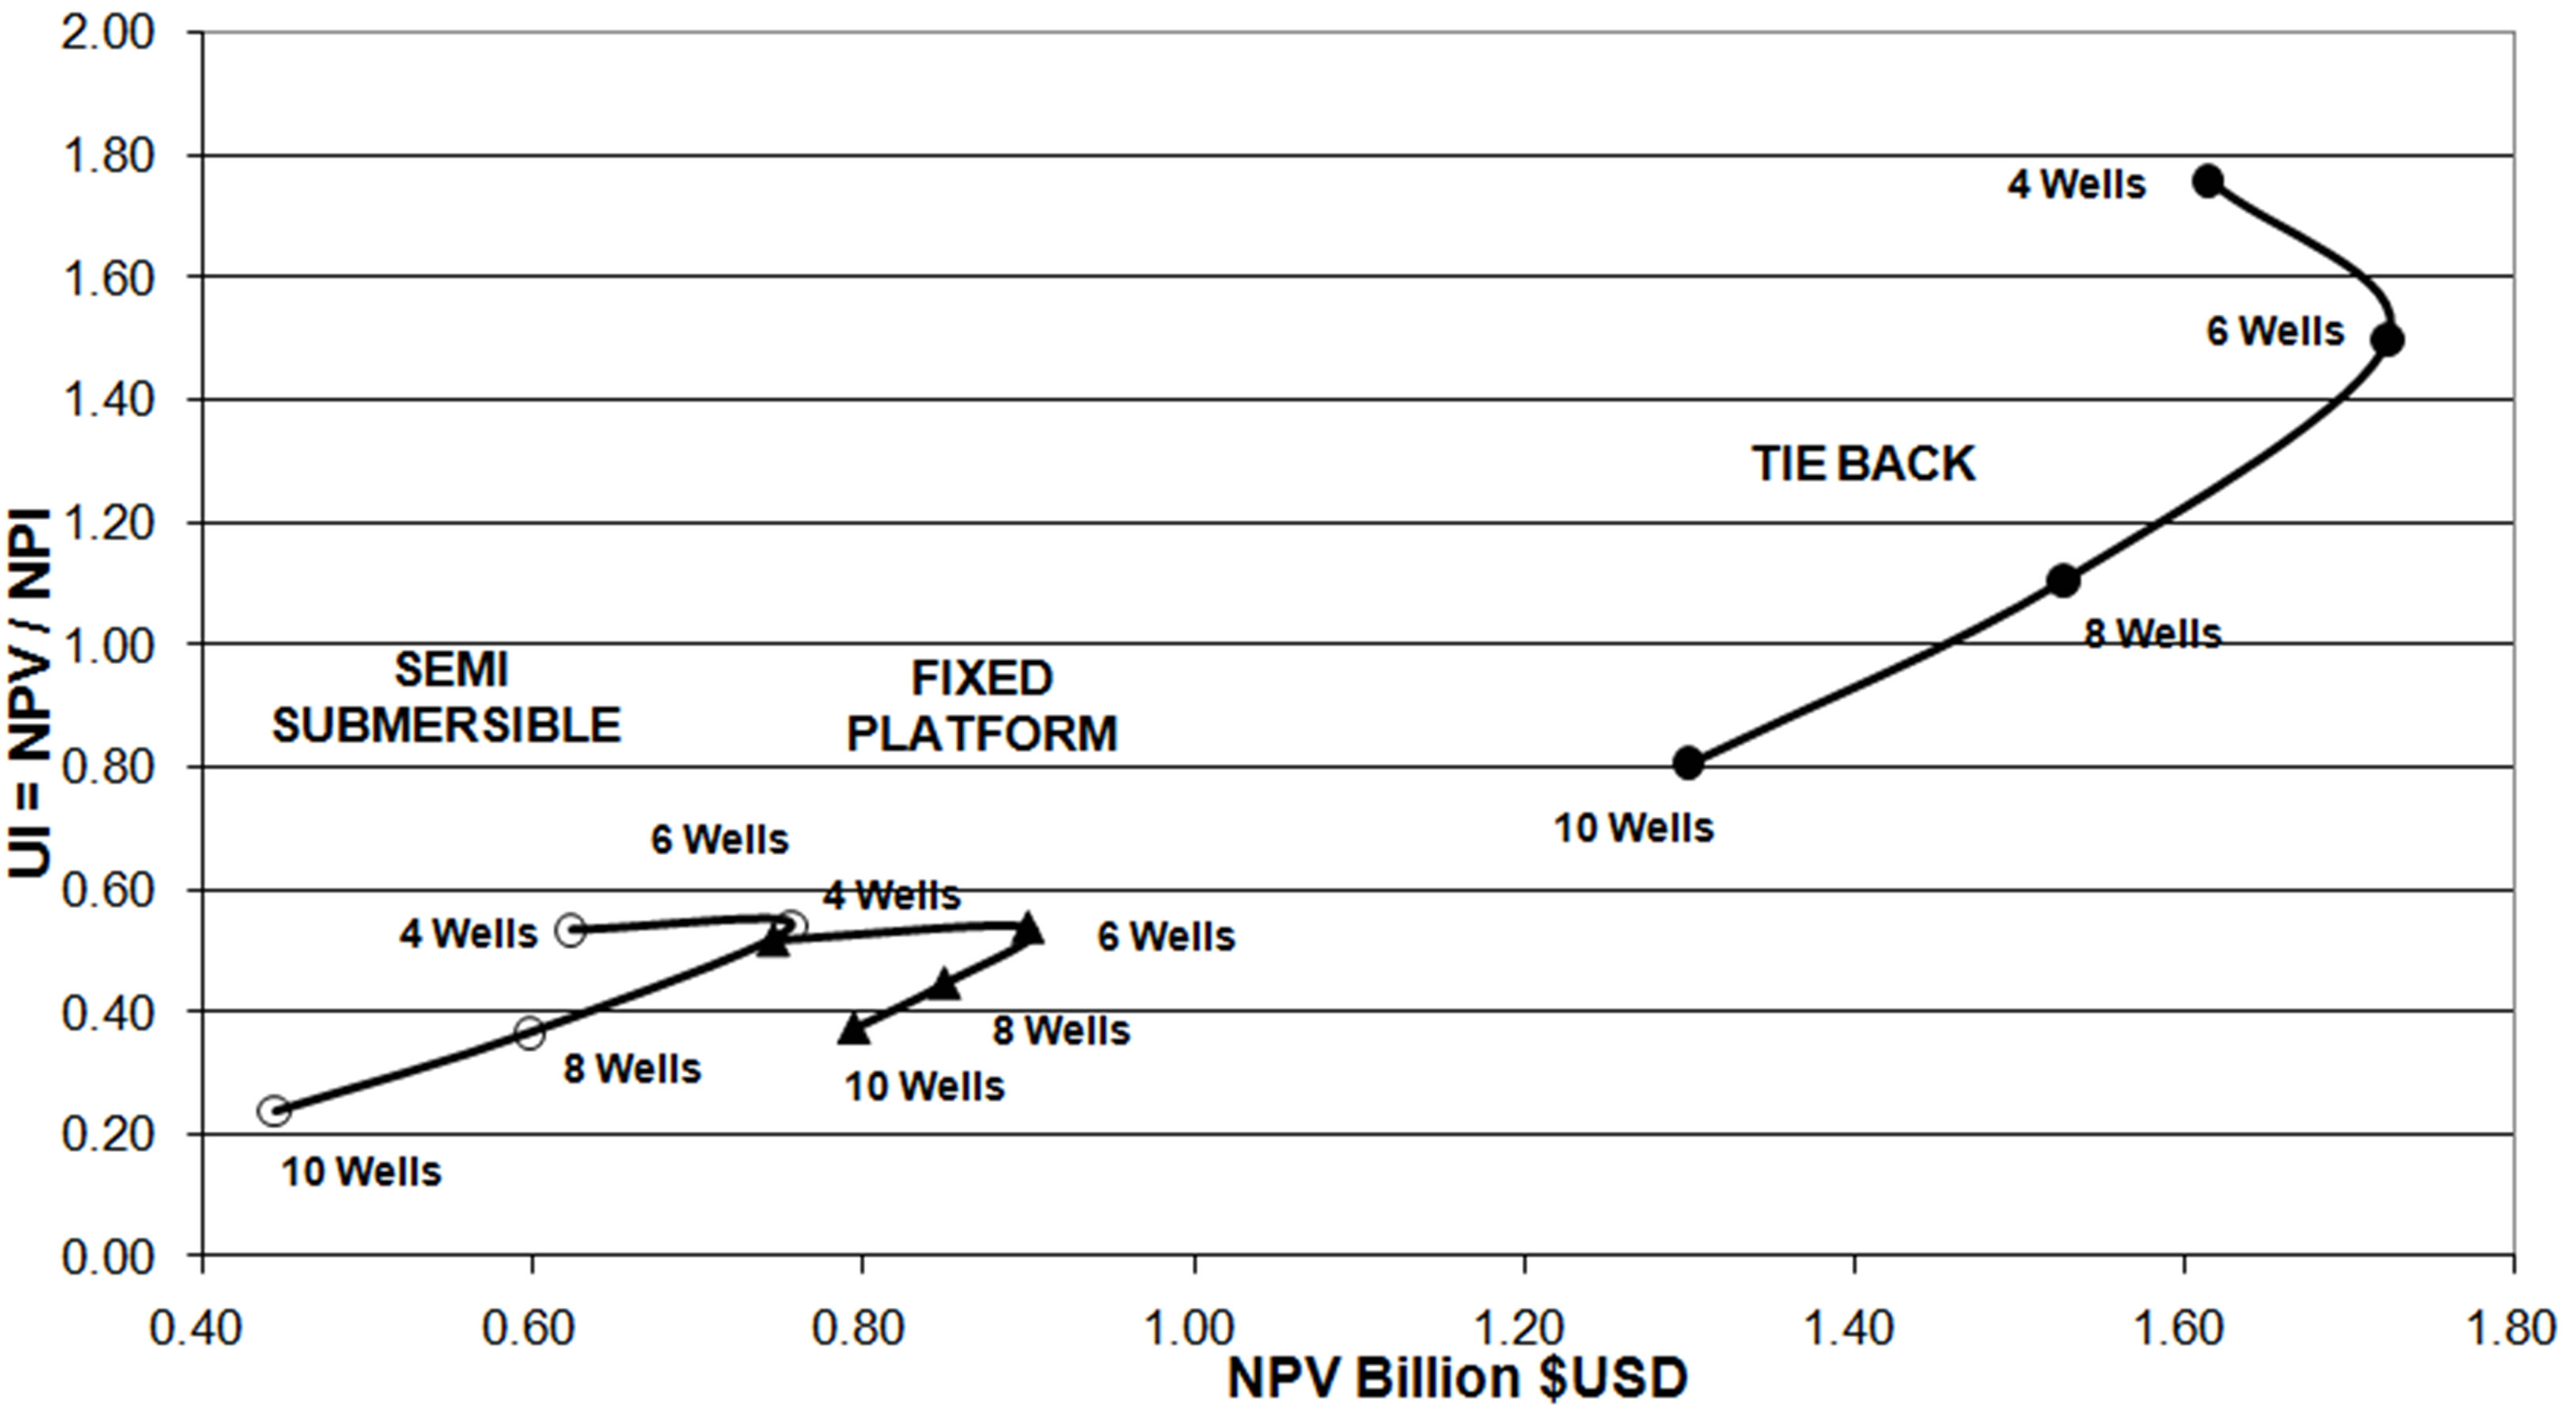
Figure 5. Effect of delay of first production on the economical performance for the semisubmersible option.
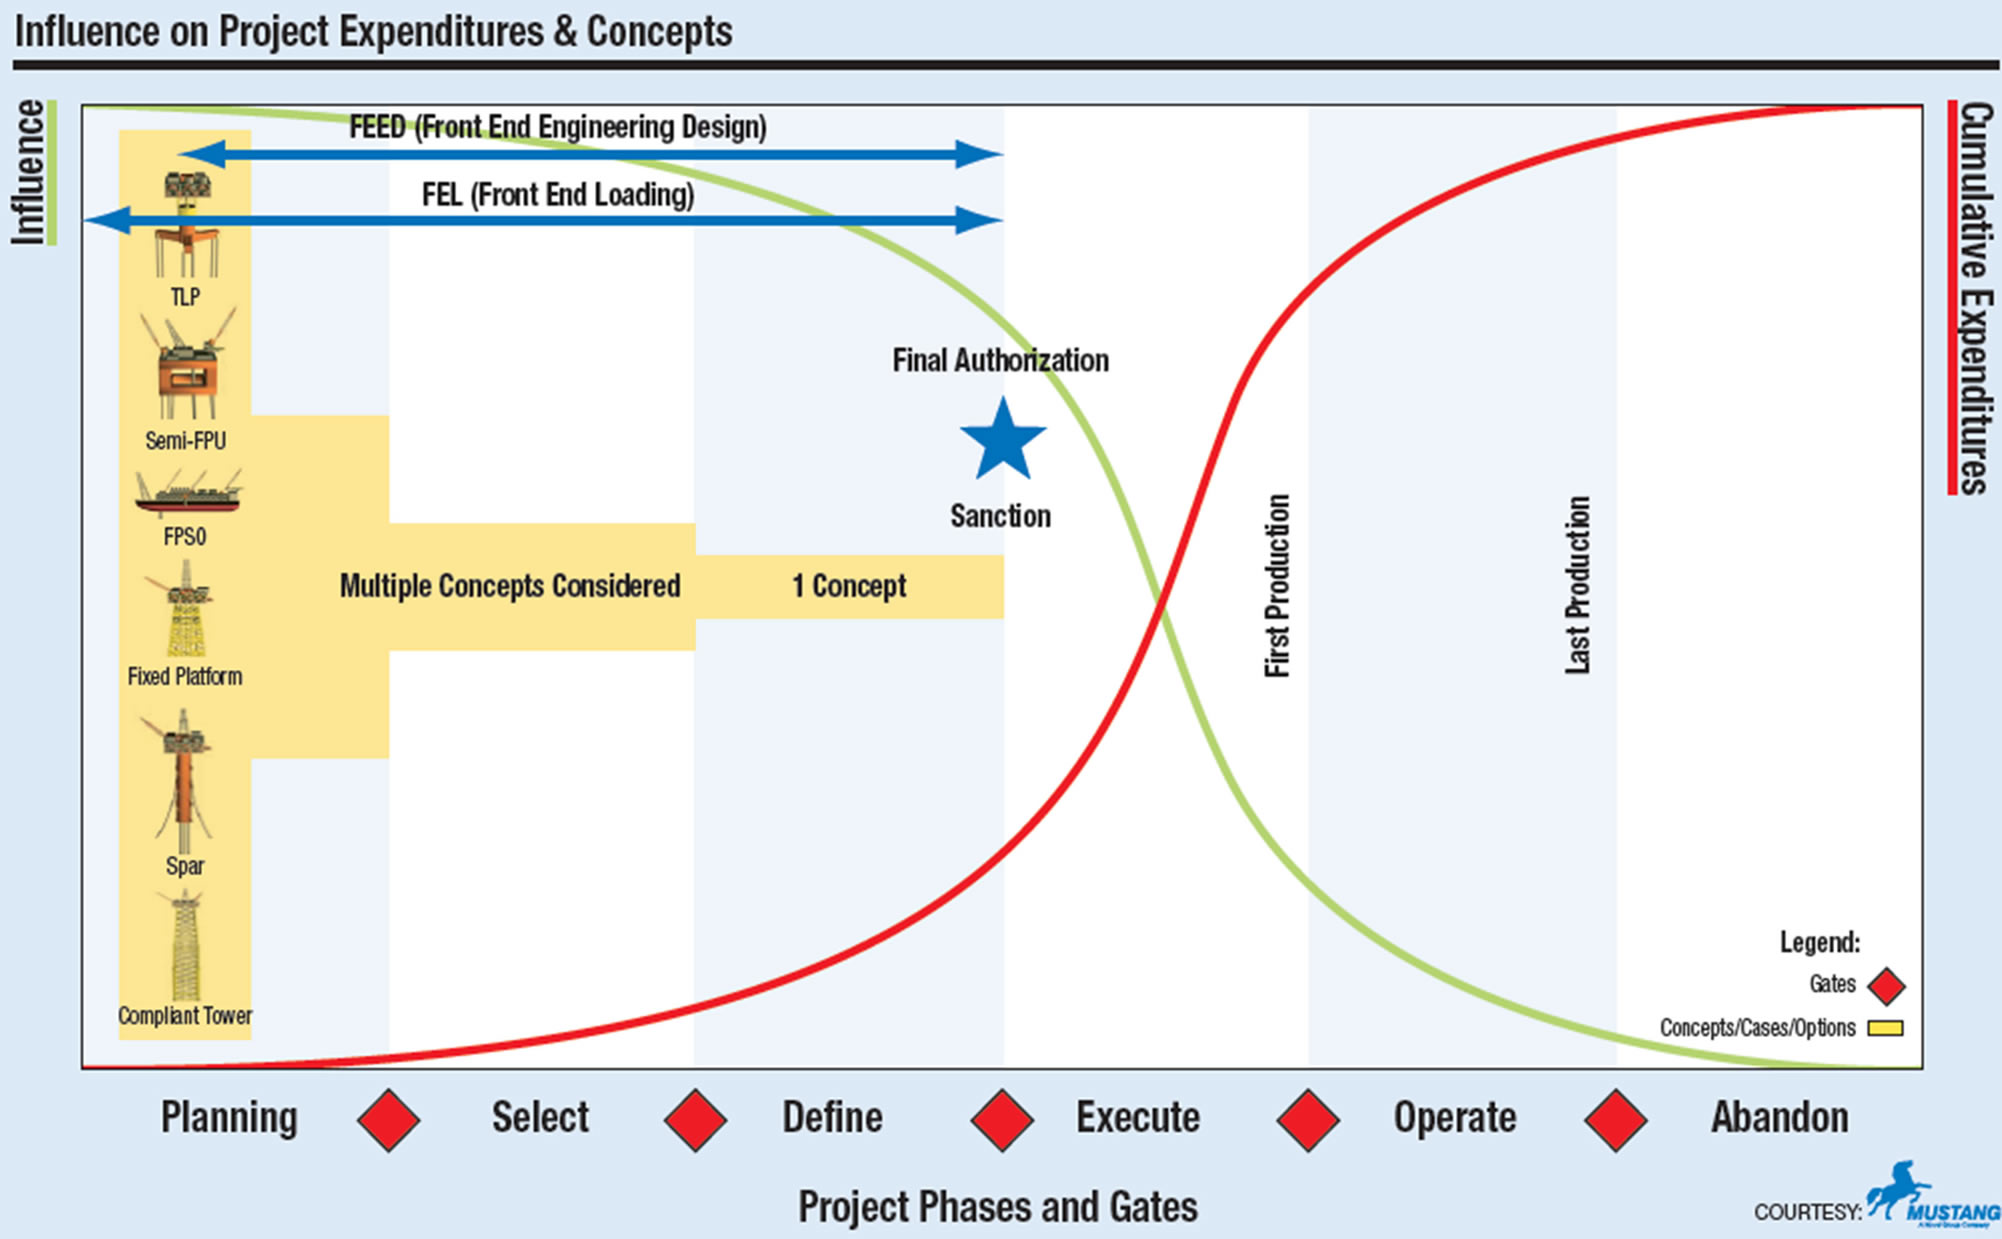
Figure 6. Influence of screening and concept selection on project future expenditures [3].
The weighted valuation method considering all these attributes directly and indirectly associated to economics is defined in this paper as “multiattribute decision model” (MDM) and is used as a second step for assisting on screening and concept selection.
Since MDM comprises attributes directly and indirectly associated to economics it is relevant to select the attributes to be appraised. A general recommendation is to select attributes that could make a difference among the concepts otherwise the attributes are scored identically for all the concepts. MDM valuation is used to support the process to prioritize the field development concepts according to the scored values for the attributes selected and the weights given to them.
The MDM valuation process proposed in this work is an application of the Analytical Hierarchy Process (AHP) which is often used as a decision making method for prioritizing concepts when multiple attributes must be considered [4]. The AHP guides decision makers through a series of pair wise comparison judgments to express the relative importance of a criterion in the hierarchy. It is not the intention of this work to describe the fundamentals of the AHP since it is widely documented thus, a direct application is presented describing the steps followed within the AHP.
A comparison of the MDM approach with the economical analysis made in the previous section is performed thus, the field development concepts shown in Figure 2 are considered. The attributes for the MDM analysis were selected in a workshop where experts on drilling, subsea systems, flow assurance, pipelines, floating systems and gas process participated. These experts selected attributes by brain storming considering those that make a difference between the three development concepts shown in Figure 2. Additionally, for each attribute a set of sub attributes was defined to characterize the concept considered in the attribute. Table 4 shows the attributes and sub attributes considered for scoring the three development concepts previously described.
Attributes have to be pair wise rated according to its importance in the exploitation system thus, experts made a matrix according to the AHP and weights were given according to the attributes relevance based on the understanding of the decision makers by assigning a weight between 1 (equal importance) and 9 (absolutely more important) to the more important attribute and the reciprocal of this value is then assigned to the other attribute in the pair, see Table 5, [5].
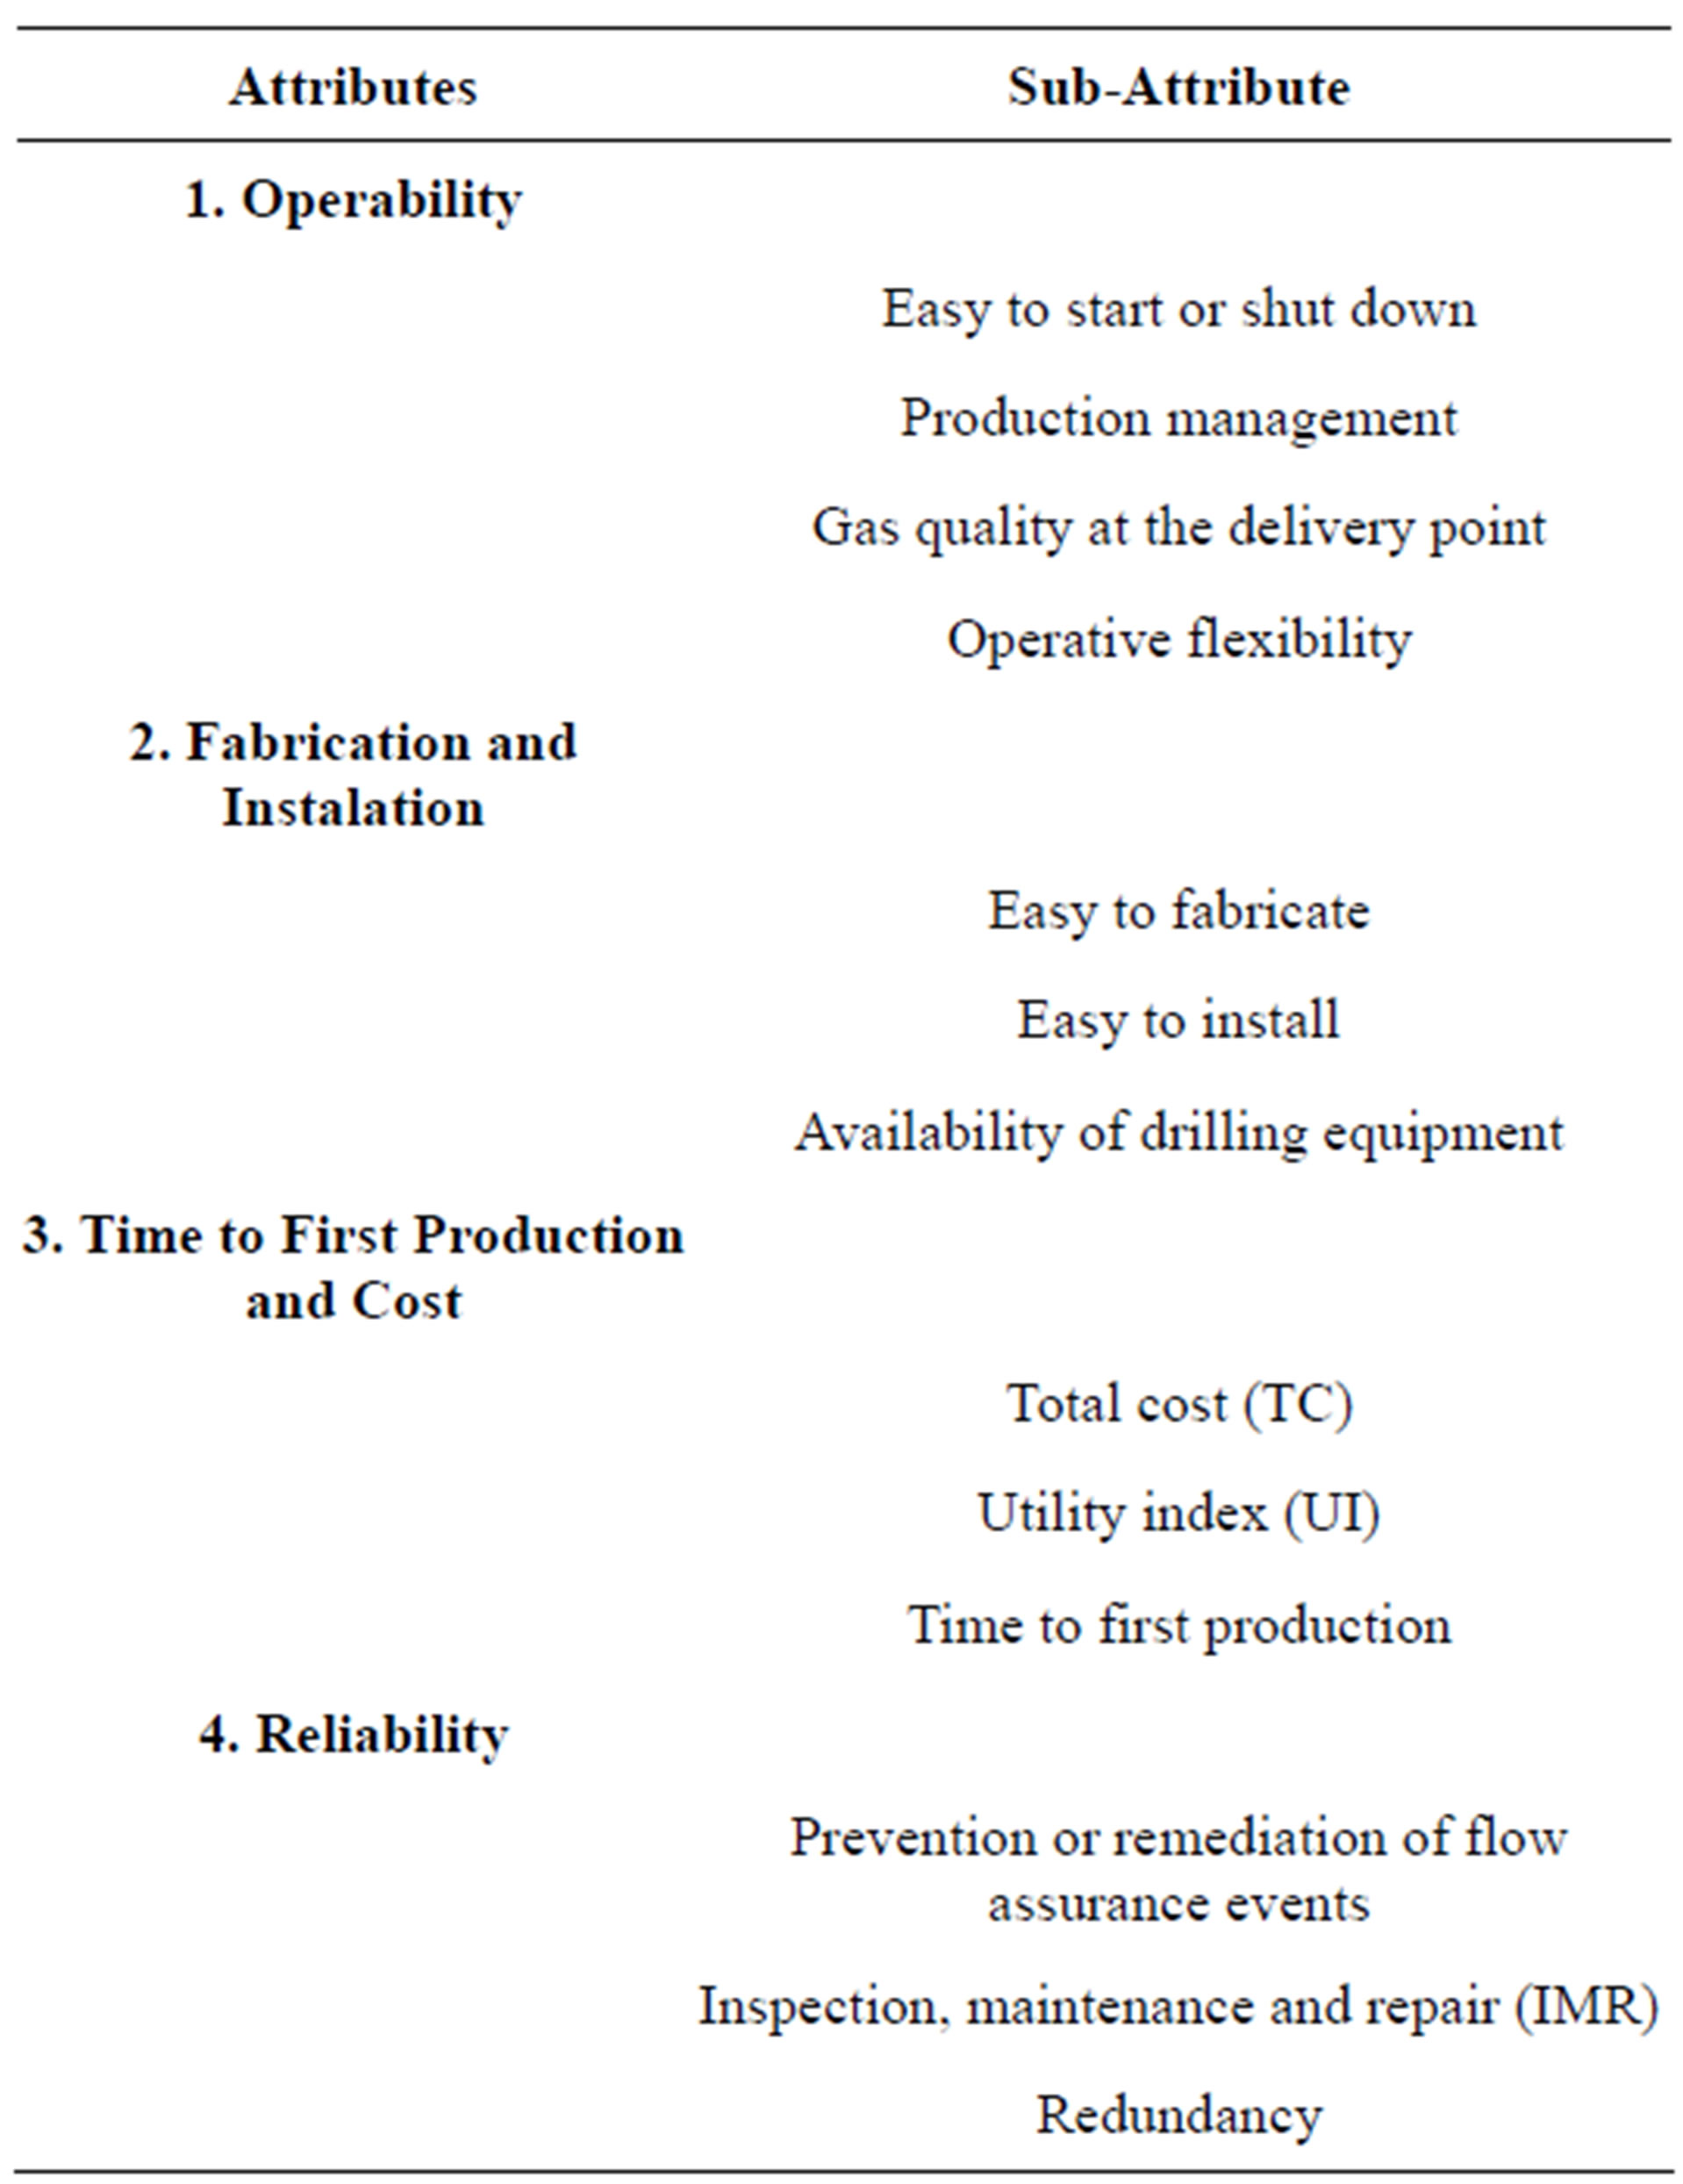
Table 4. Attributes and sub attributes for scoring development concepts.
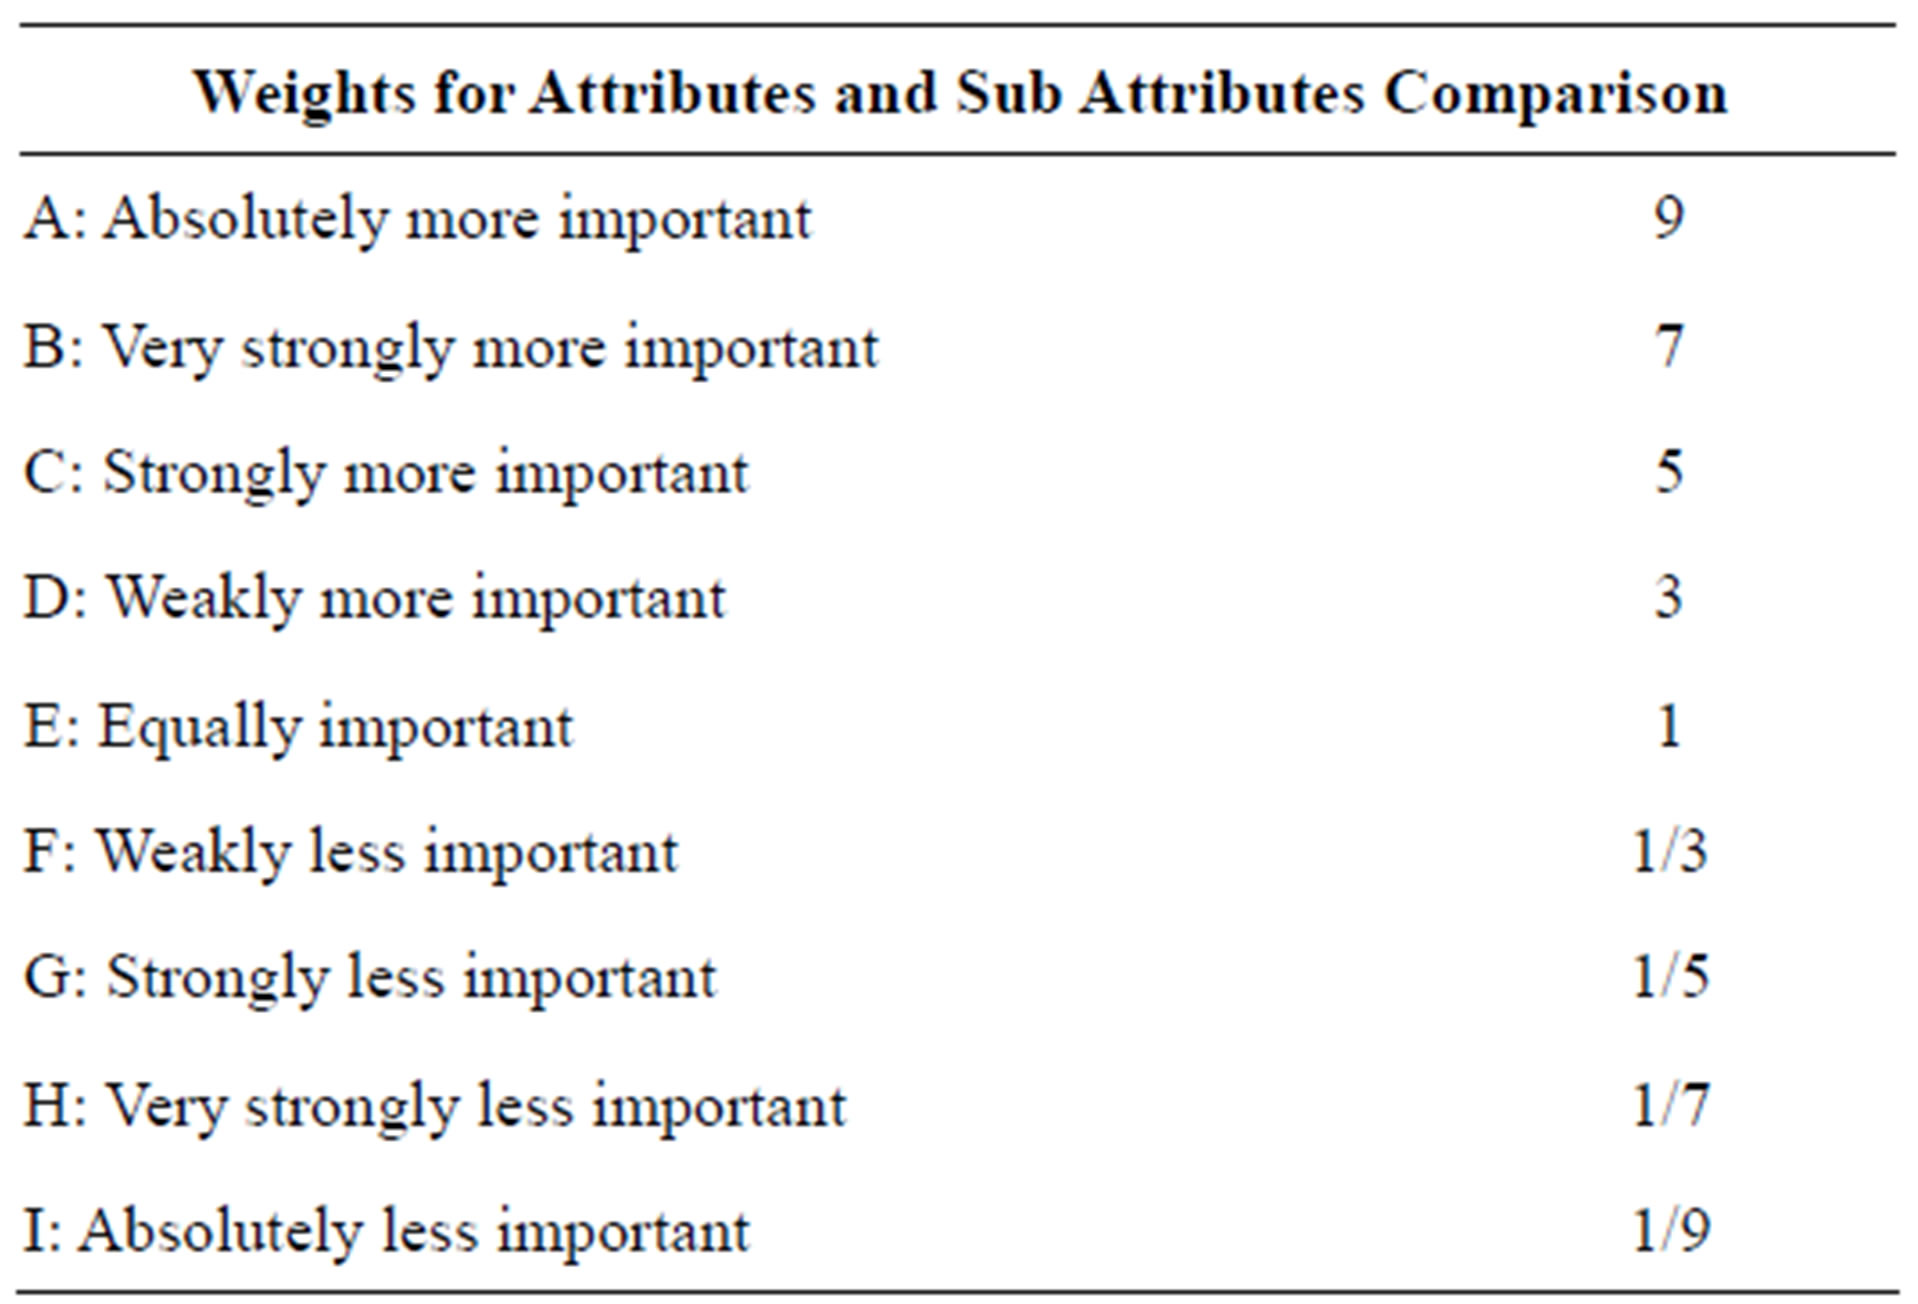
Table 5. Criteria for attributes and sub-attributes weights.
The results of this attribute weighting are presented in the top section of Table 6.
The weightings in the top section of Table 6 are then normalized, by dividing each entry in a column by the sum of all the entries in that column, so that they add up to one, see lower section of Table 6. Following normalization, the weights are averaged across the rows to give an average weight for each attribute, see lower right column of Table 6, results show for example, that operability is the most important attribute followed by time to first production and cost.
The weighting procedure presented previously is then applied to each set of sub attributes to determine their weight, Table 7 shows the weights for the attributes from Table 6 and the sub attributes associated to each attribute.
It is recommended to validate the consistency of the weights due to possibilities that during the pair wise, inconsistent weights can be provided since the process can become extensive when there is a long list of attributes and sub attributes to be weighted, it is not the objective of this work to present how to validate the consistency and reference [6] is recommended for this purpose.
The next step is to compare the three field development concepts thus, attributes and sub attributes weighted previously are used to rank concepts. Table 8 shows an extension of Table 7 where the three field development concepts are pair wised rated according to a criteria between 1 (poor) and 4 (excellent) to measure the performance of the option considering the knowledge and experience of the decision makers. The rating is normalized by multiplying the pair wise rate times the weight of the attribute and the sub attribute, the MDM is finally determined by the summation of the column corresponding to the development option.
From Table 8, fixed platform MDM = 3.33 provides more value than the tie back MDM = 3.08 and the semisubmersible MDM = 3.22, these results are opposite to those shown in Figure 3 which are based only on
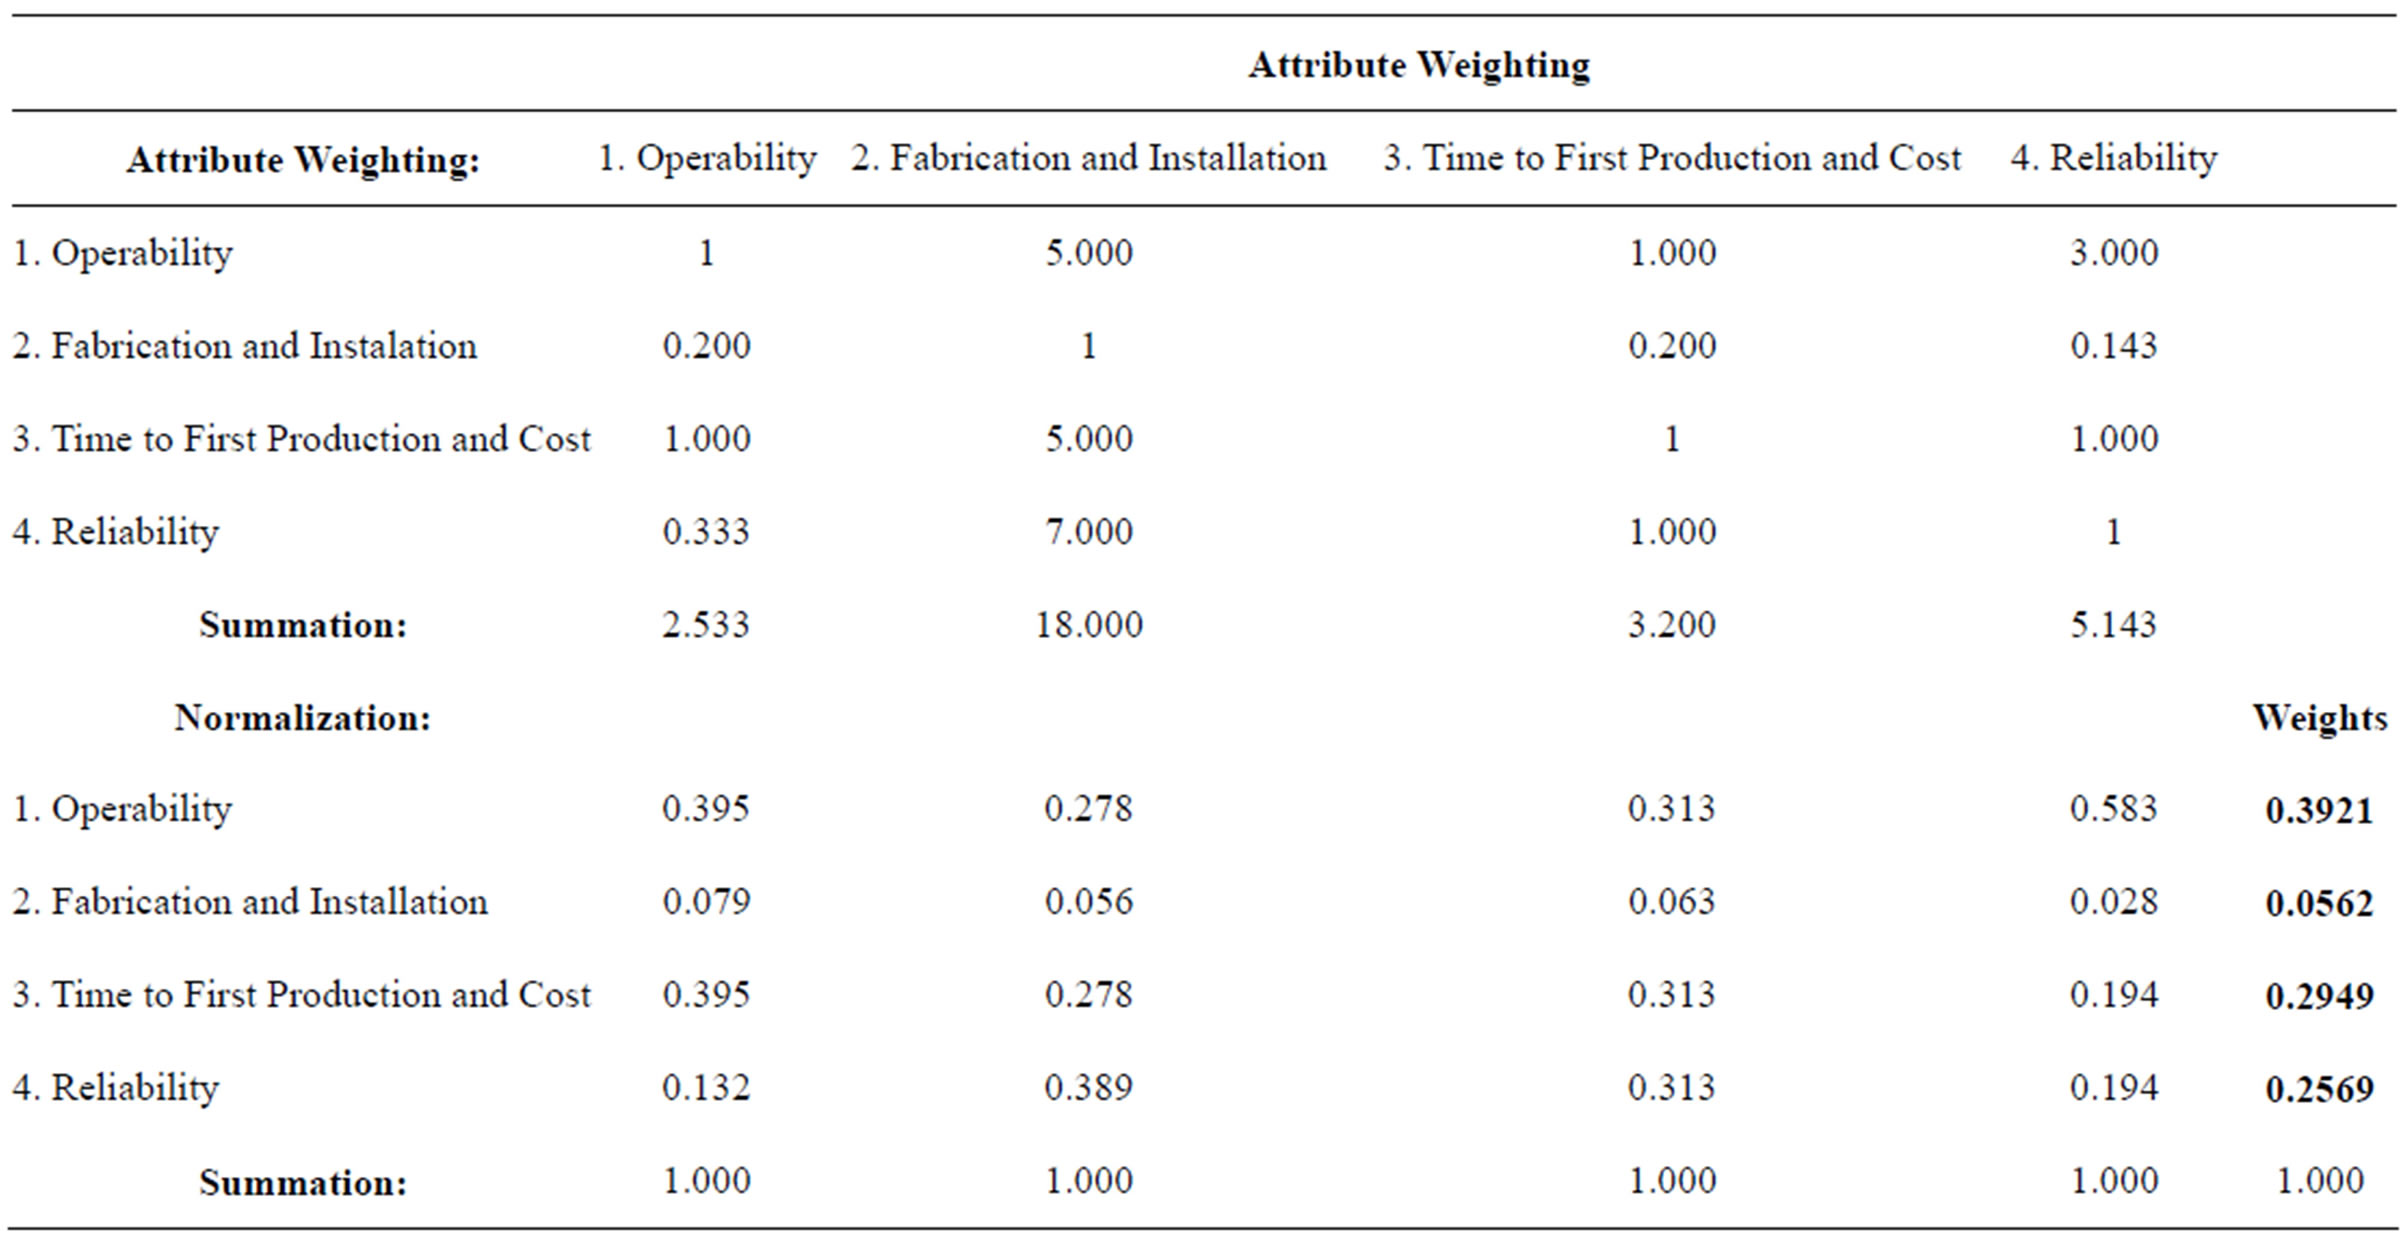
Table 6. Attributes weights.
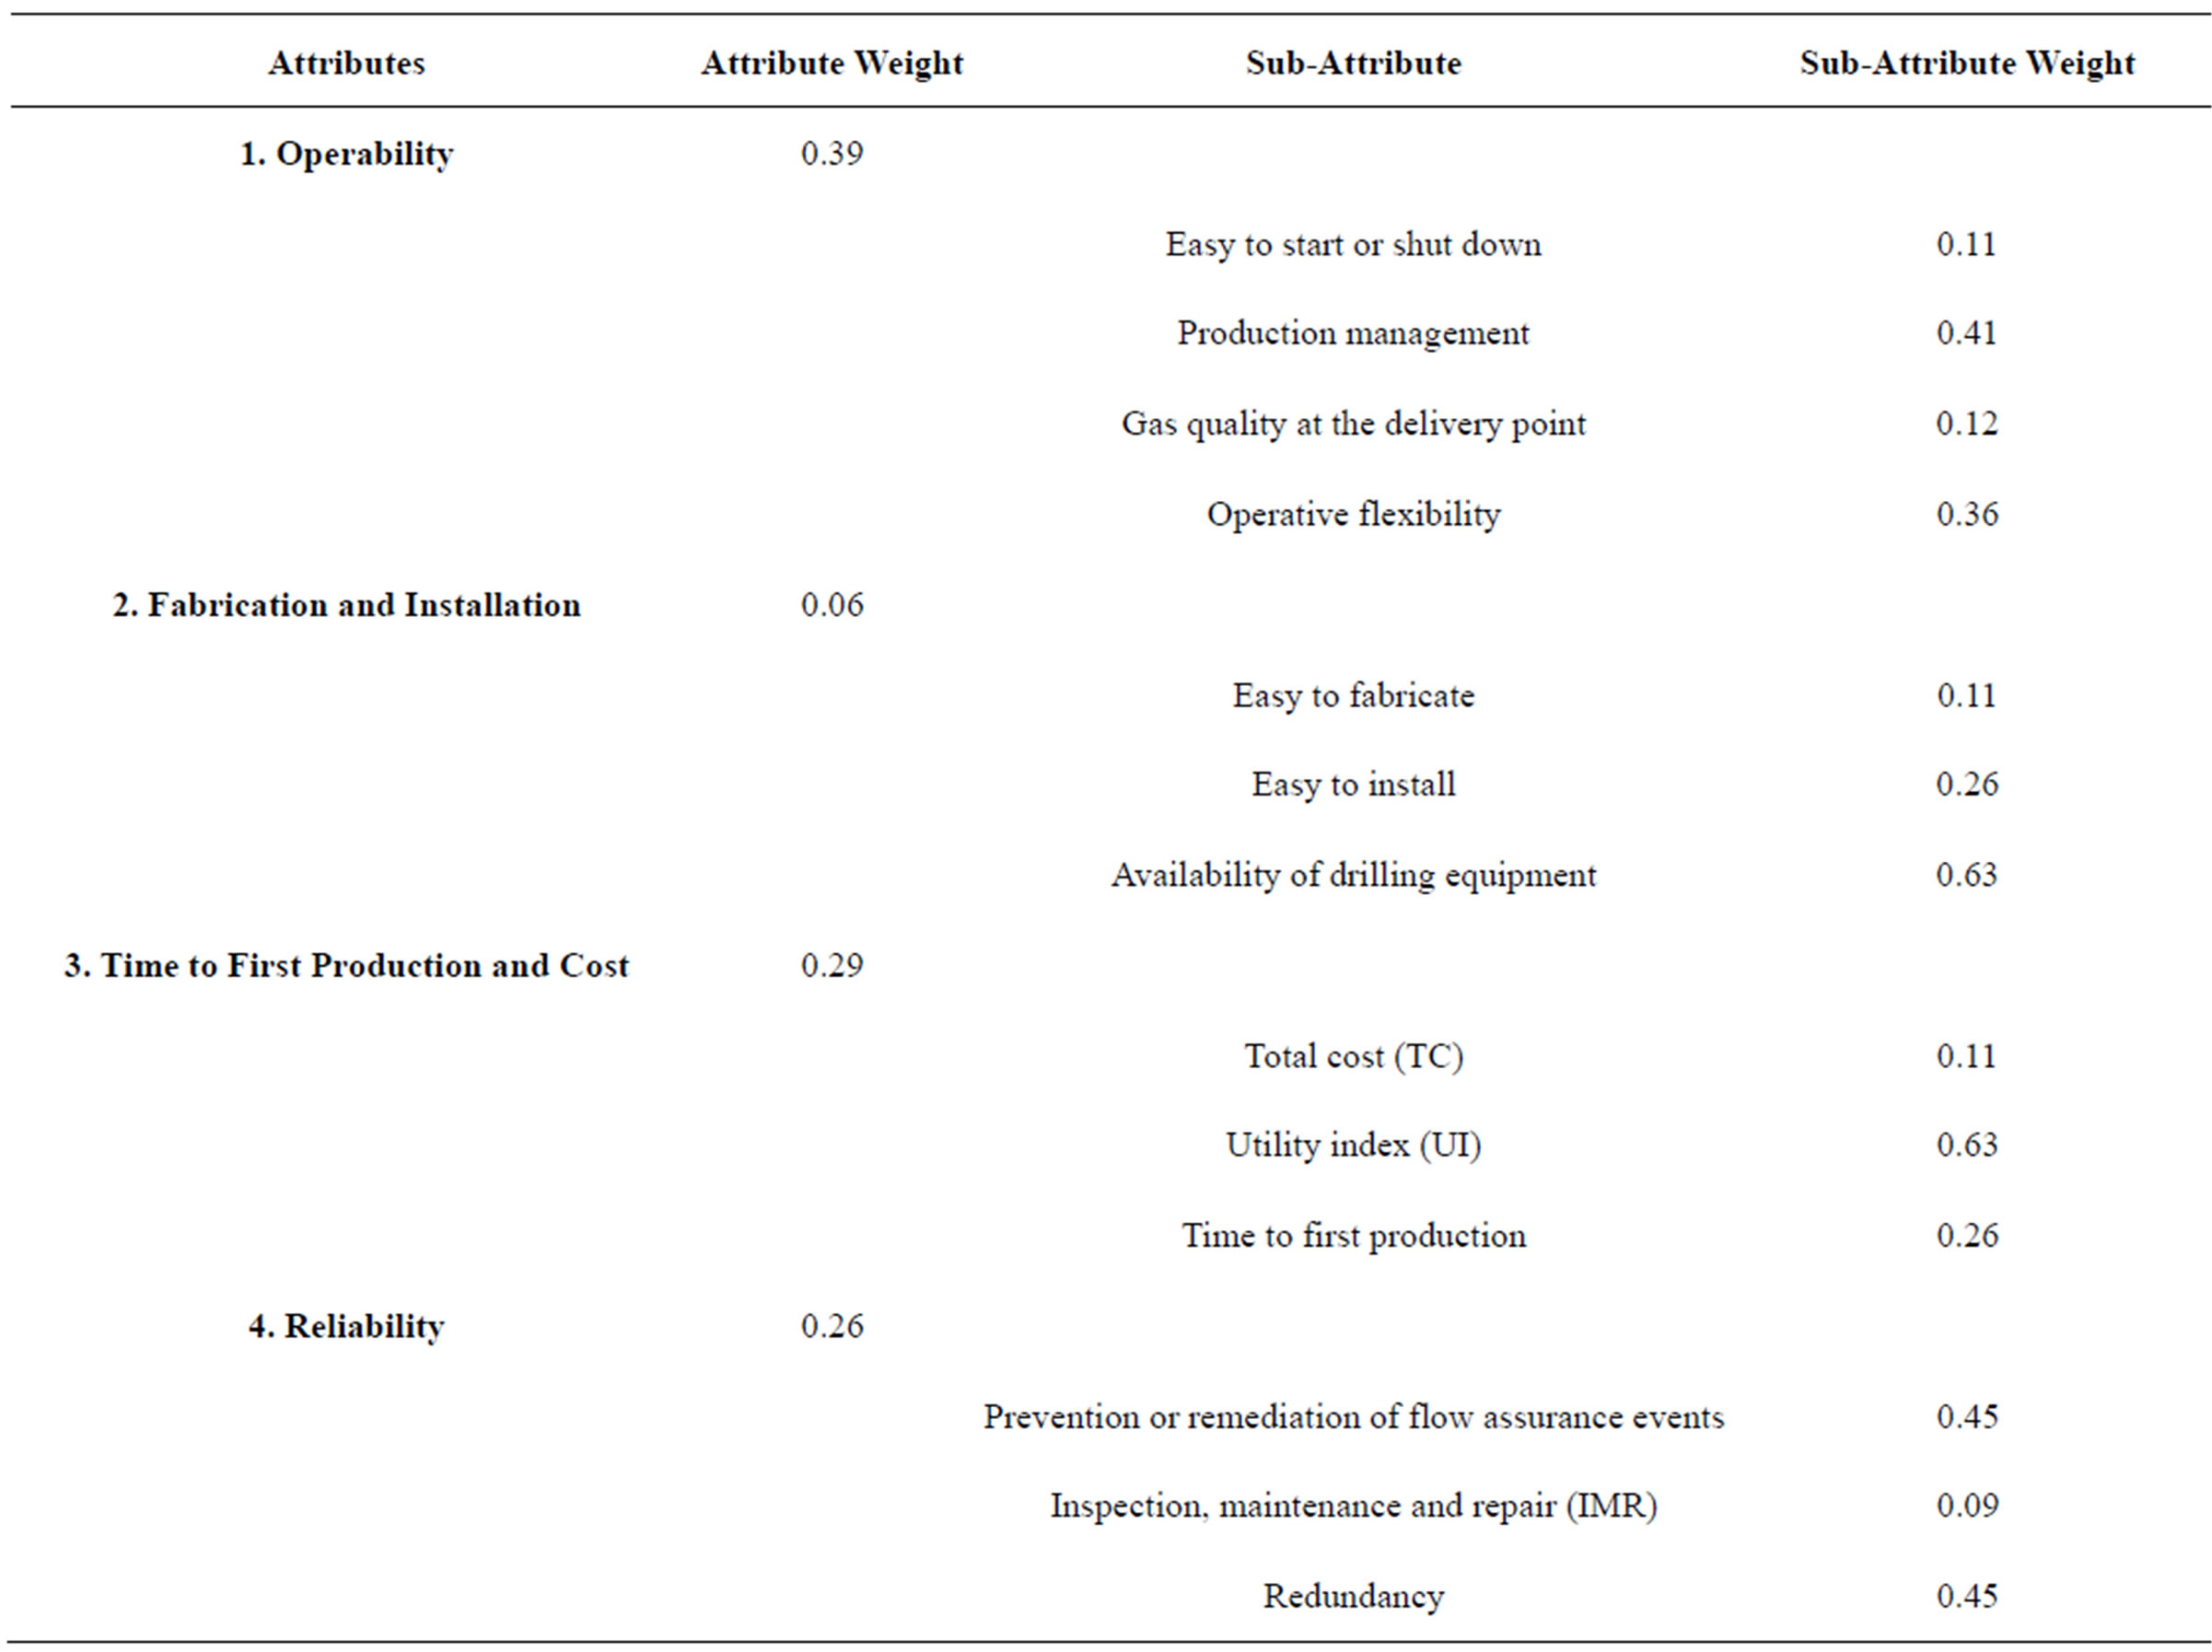
Table 7. Summary of attributes and sub attributes weights.
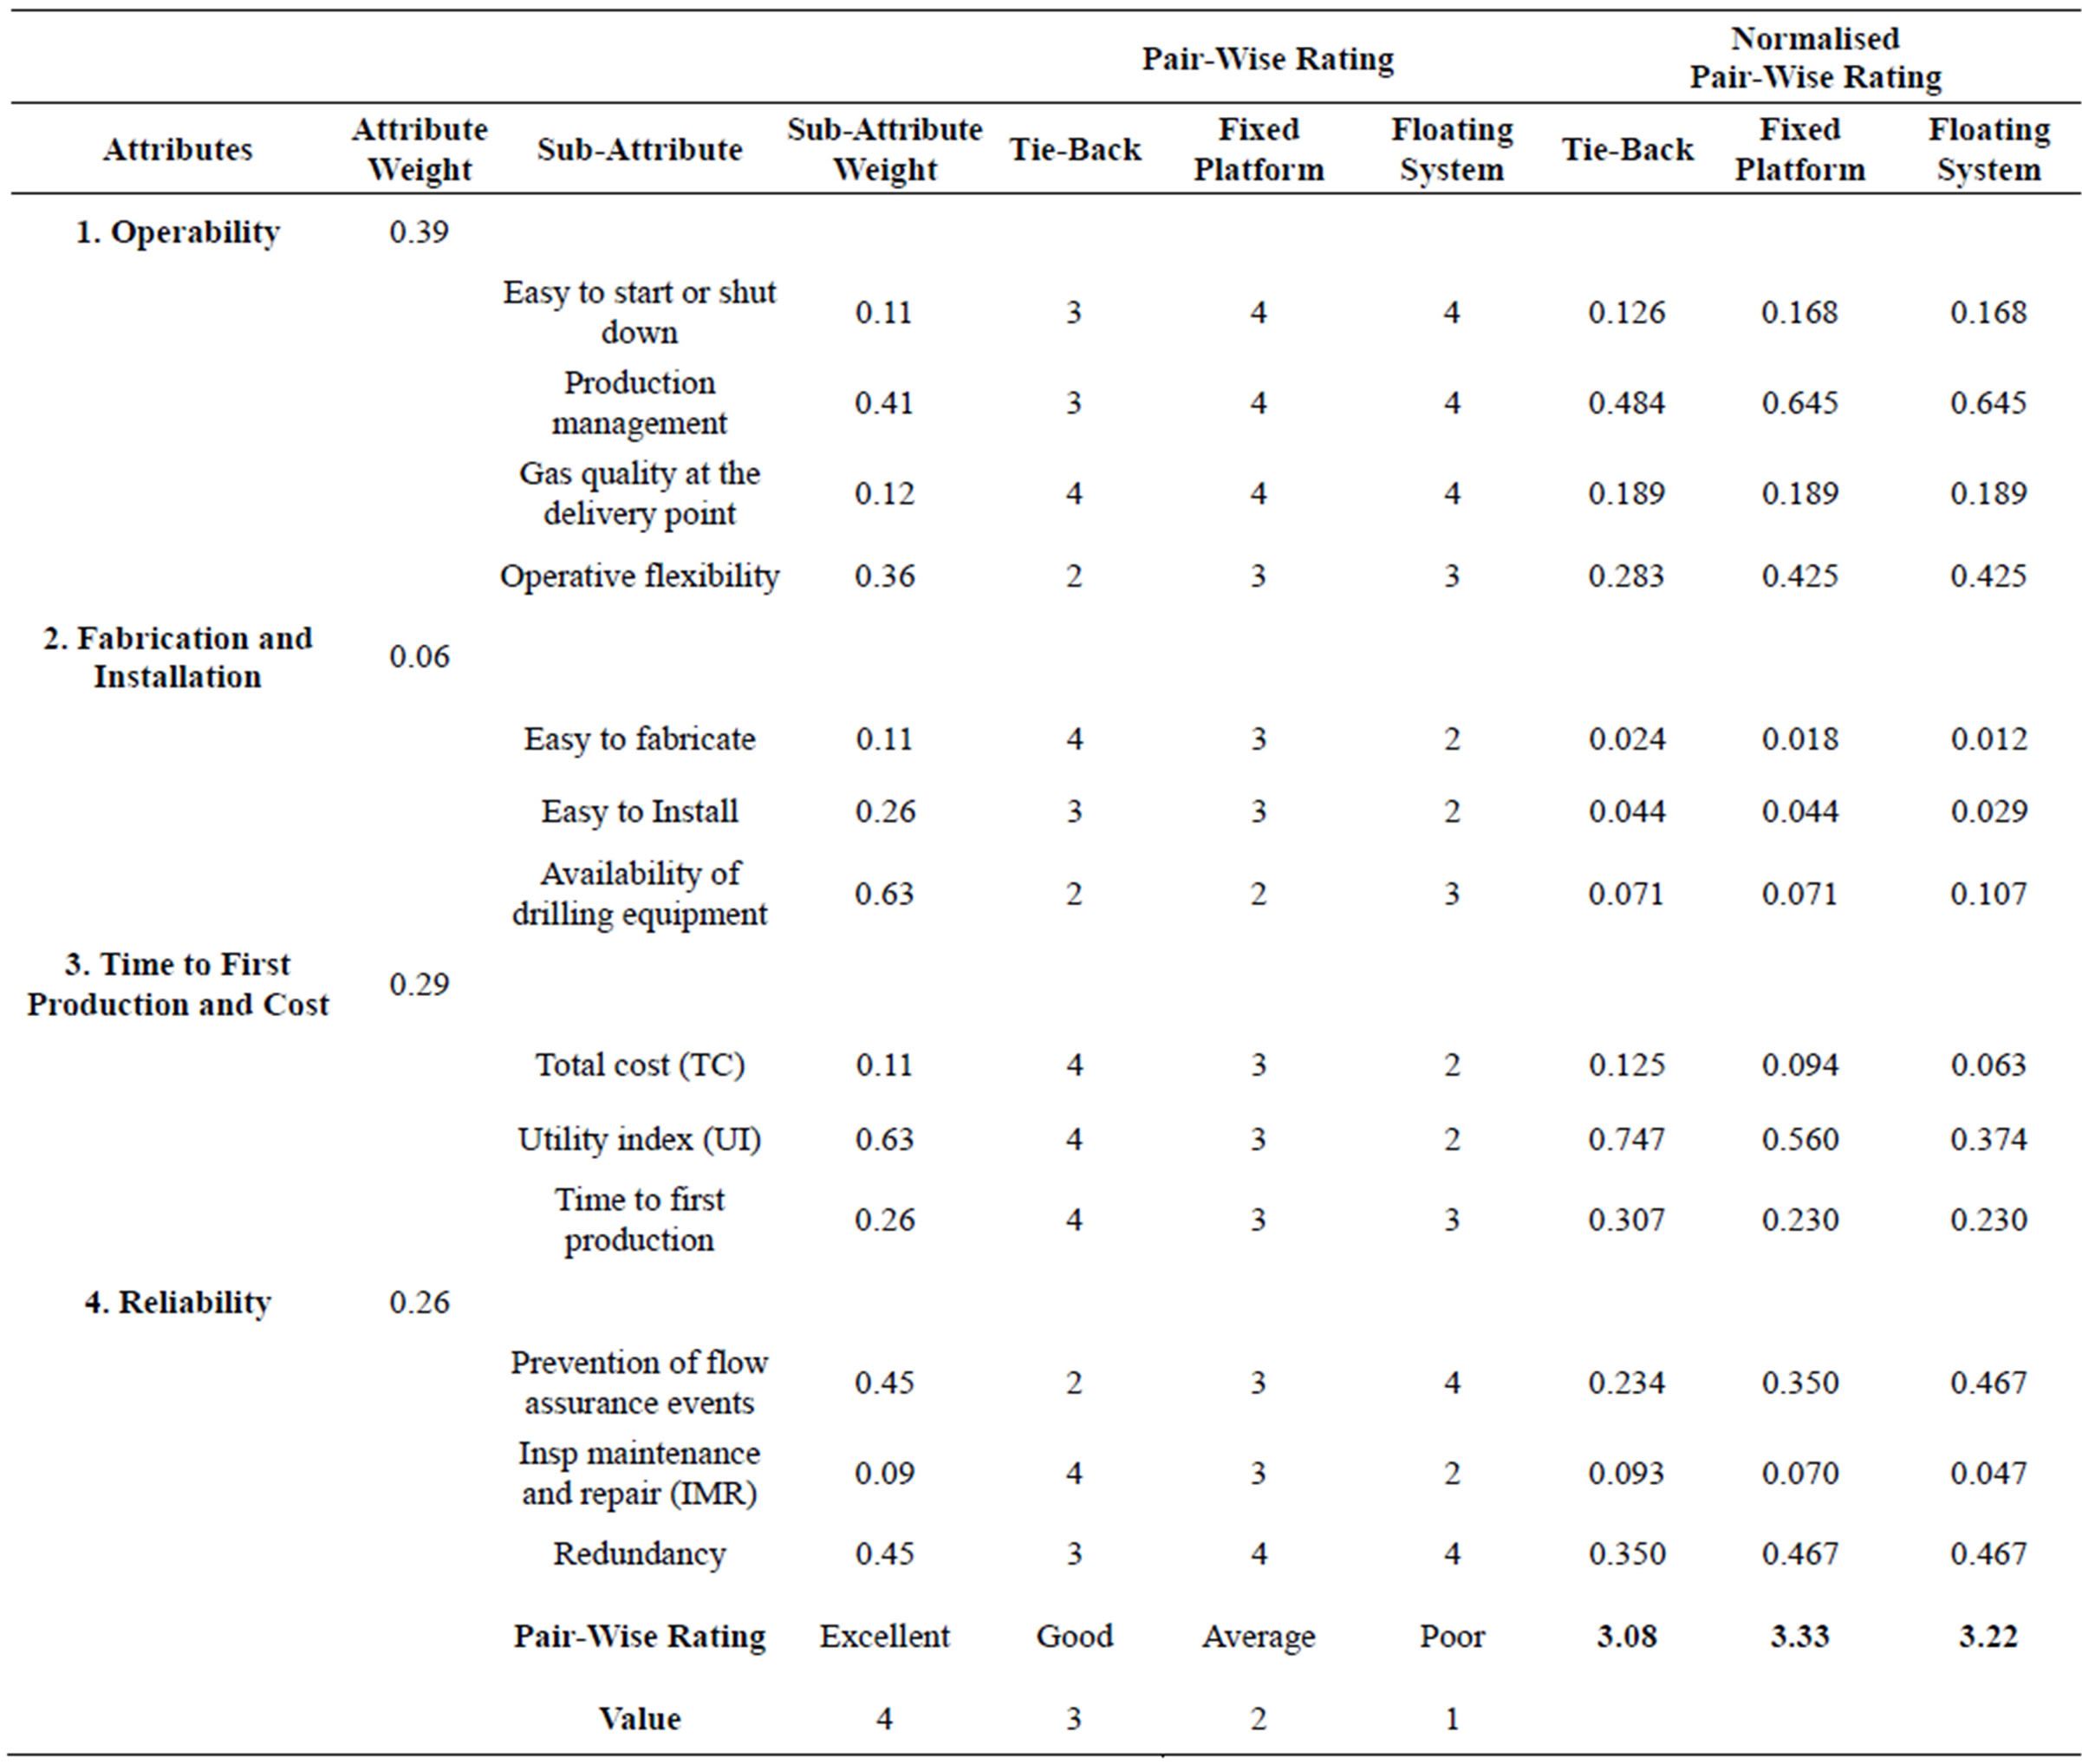
Table 8. Normalized pair wised MDM evaluation for field development concepts.
economical indexes, where the tie back option was the best ranked followed by the semisubmersible and fixed platform being the less economical option. This finding has to be considered for the selection of a field development option since it provides insight that economical performance is not a measure of all the attributes related to value such as operability and reliability. To complete the MDM analysis a semi quantitative risk assessment is usually performed to compare the value to the risk involved with each development option.
4. Risk Assessment
By definition, risk of an event is the product of the probability of occurrence by the severity of the consequences of such event [7] thus, for each risk event that could affect the project its probability of occurrence and consequences are qualitatively determined.
In a similar manner as for MDM analysis, risk events are identified by a group of experts of the technical fields involved. The same recommendation as for MDM analysis is valid this is, to select risk events that make a difference among the development concepts otherwise the events are risk scored identically for all the concepts. On the other hand, risk attributes also have to be identified to measure the consequences of the risk events on the safety policy described by the risk attributes. Risk attributes are usually descriptors of the operator safety policies, additional risk attributes can be also included to consider other important aspects of the project. Risk attributes could have different relevance thus, attribute weighting process as described in Table 6 could be implemented. Table 9 shows the risk events for the three development concepts described in Figure 2 and a set of risk attributes that represent the safety policy of an average operator [8]; a uniform attribute weight of 0.25 has been considered
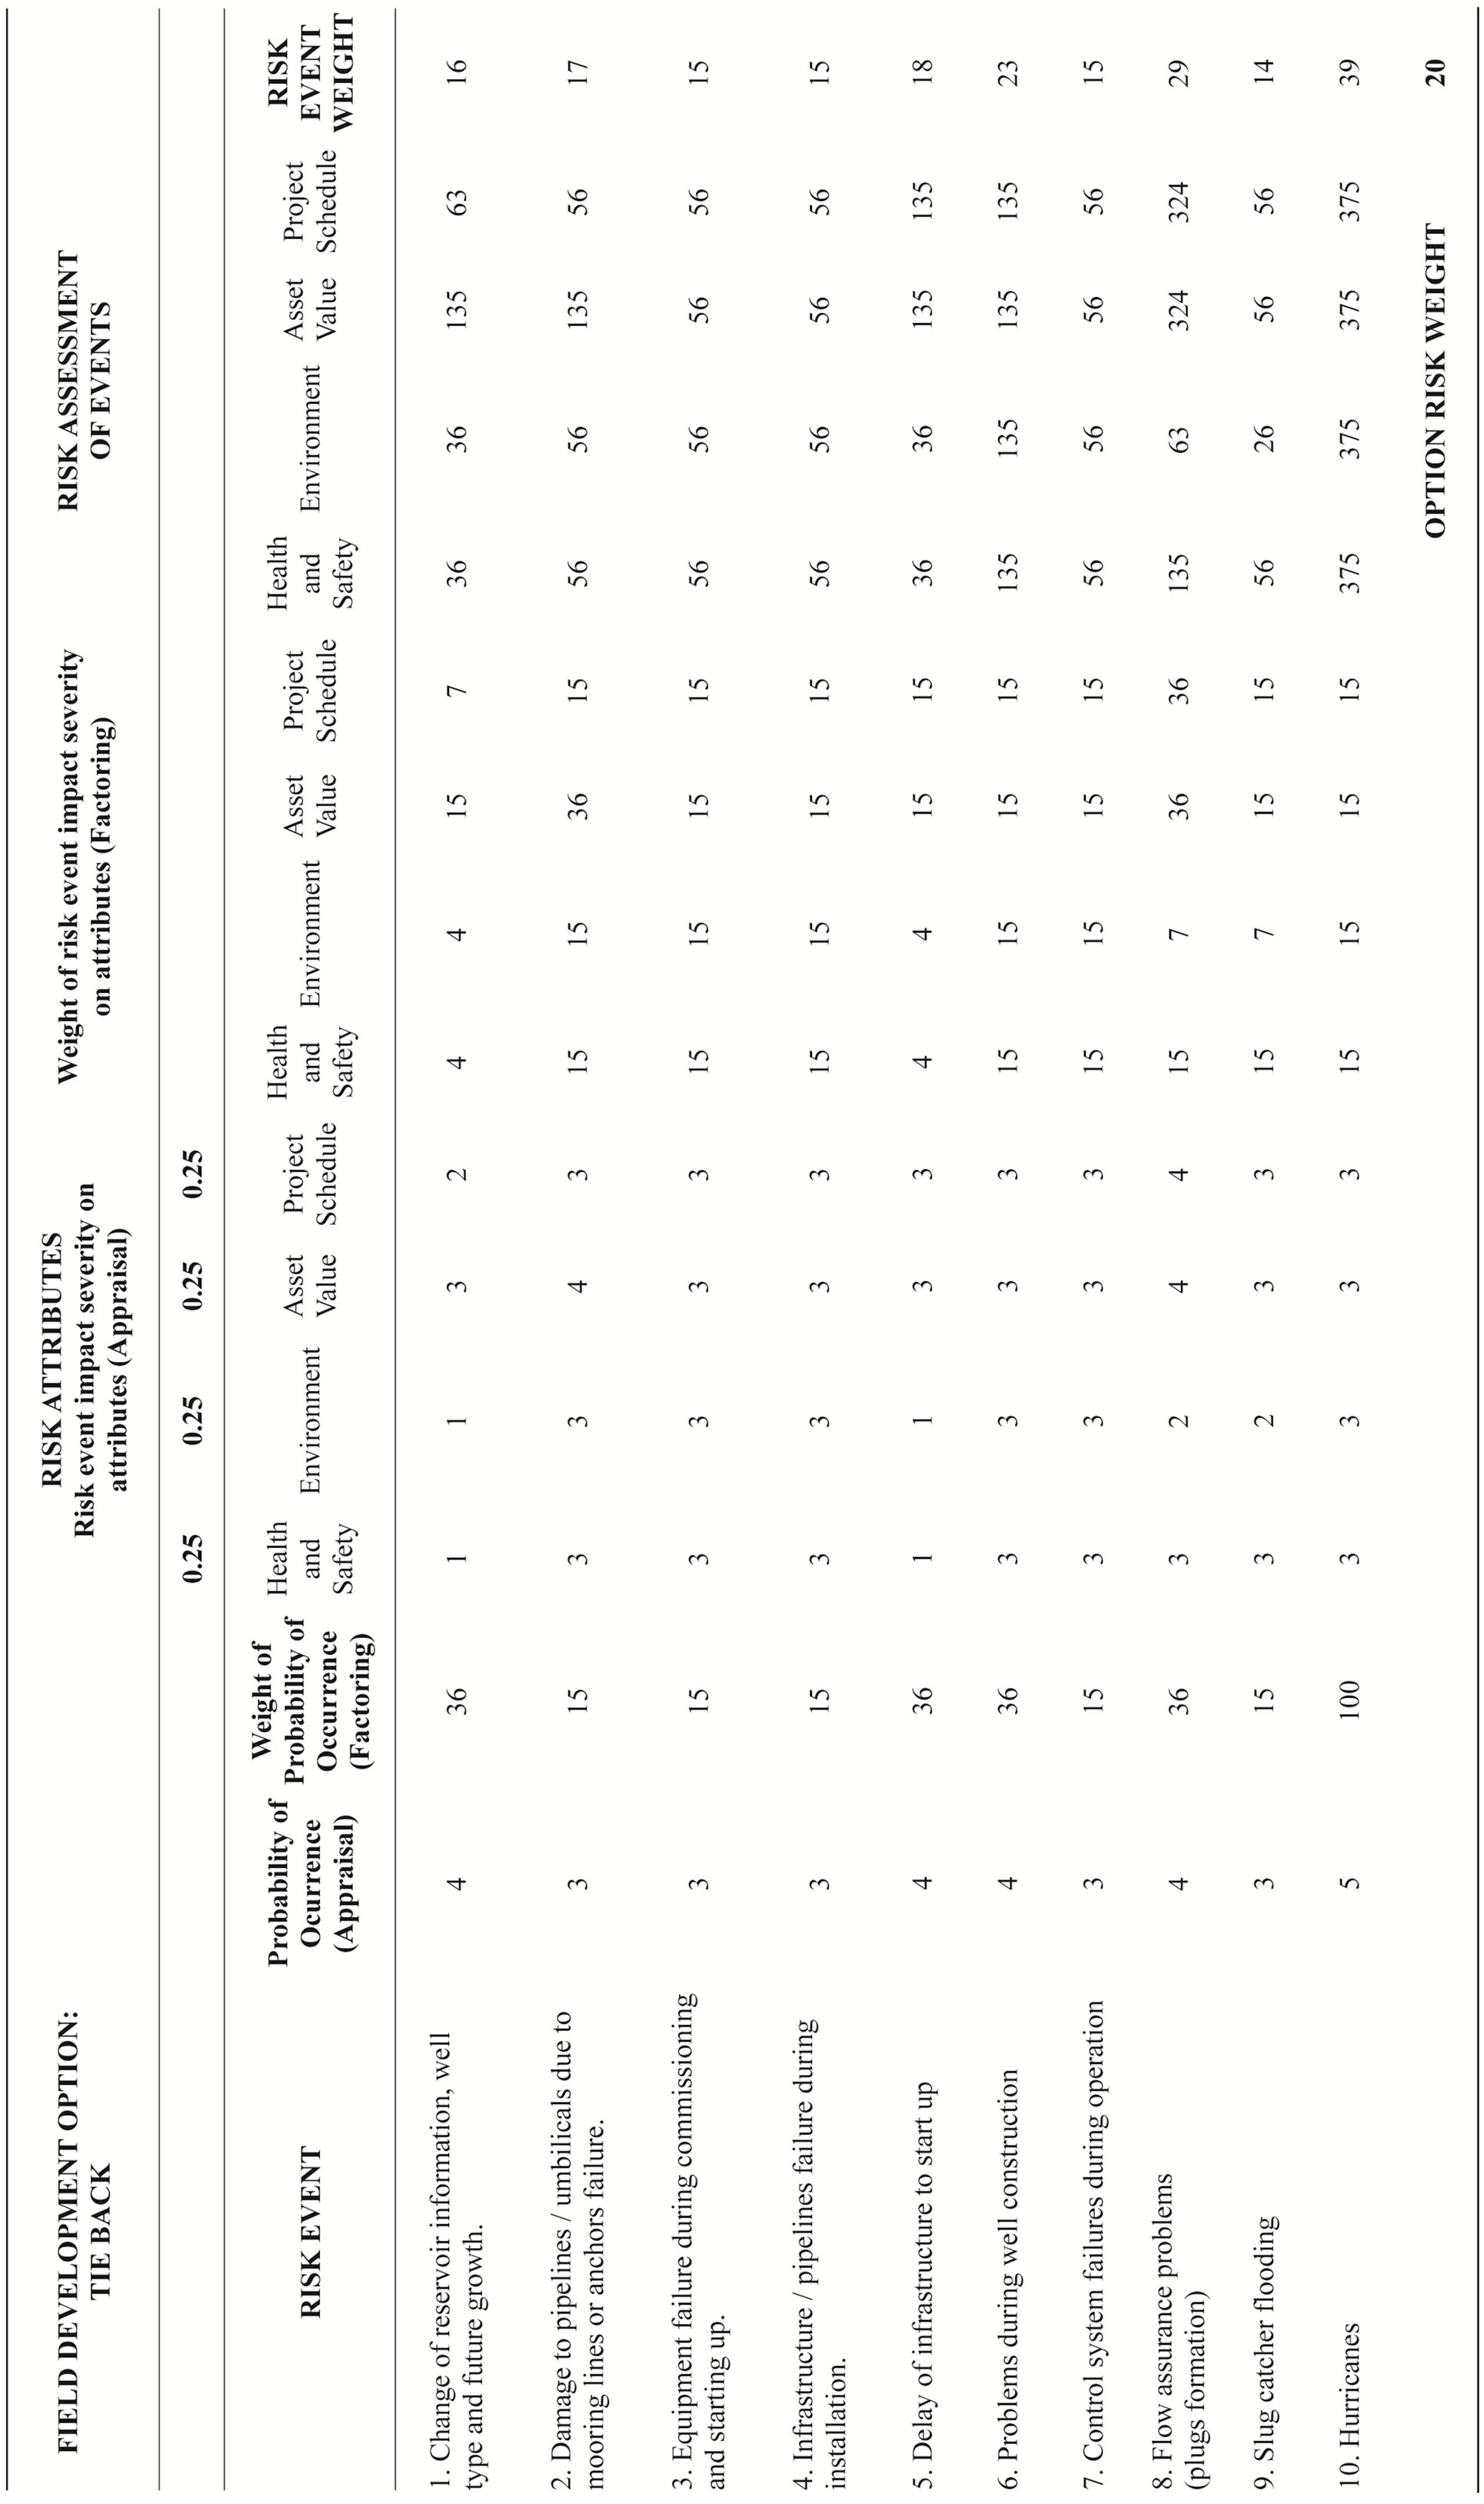
Table 9. Risk assessment for tie back development option.
for this work.
Probability of occurrence for the risk events has to be appraised by the group of experts, a qualitative scale of 1 to 5 is used to score in a consistent basis. This score has to be weighted by means of a probability curve (factoring) which includes the risk behavior of the decision maker this is, conservative or aggressive risk taker, see Figure 7, weight of probability of occurrence in Table 9 has an aggressive risk taker profile.
Impact severity of risk events on attributes is appraised by a group of experts using a qualitative scale of 1 to 5, see Table 10. Attributes impact description depends on operator’s safety policy, Table 10 shows an average industry description of impact severity for attributes in Table 9.
Impact severity appraisal is also weighted by means of a probability curve (factoring) which includes the risk behavior of the decision maker this is, conservative or aggressive risk taker, see Figure 7, weight of risk event impact severity on attributes in Table 9 has an aggressive risk taker profile to be consistent with the weight given to risk events.
From Table 9, to calculate the risk assessment for each event, the product of the weight of probability of occurrence times the weight of risk event impact severity times the weight of the attribute is performed. For example, for risk event “1.—Change of reservoir information, well type and future growth” the impact on attribute “Health and safety”, risk assessment event would be 36 × 4 × 0.25 = 36. Finally, from Table 9, the risk event weight would be the square root of the summation of risk assessment events on the attributes, for example, for risk event “1.—Change of reservoir information, well type and future growth”, the risk event weight would be (36 + 36 + 135 + 63)1/2 = 16. Table 9 corresponds to tie back field development option thus, the average of the risk events weights is the risk weight for the tie back option = 20.
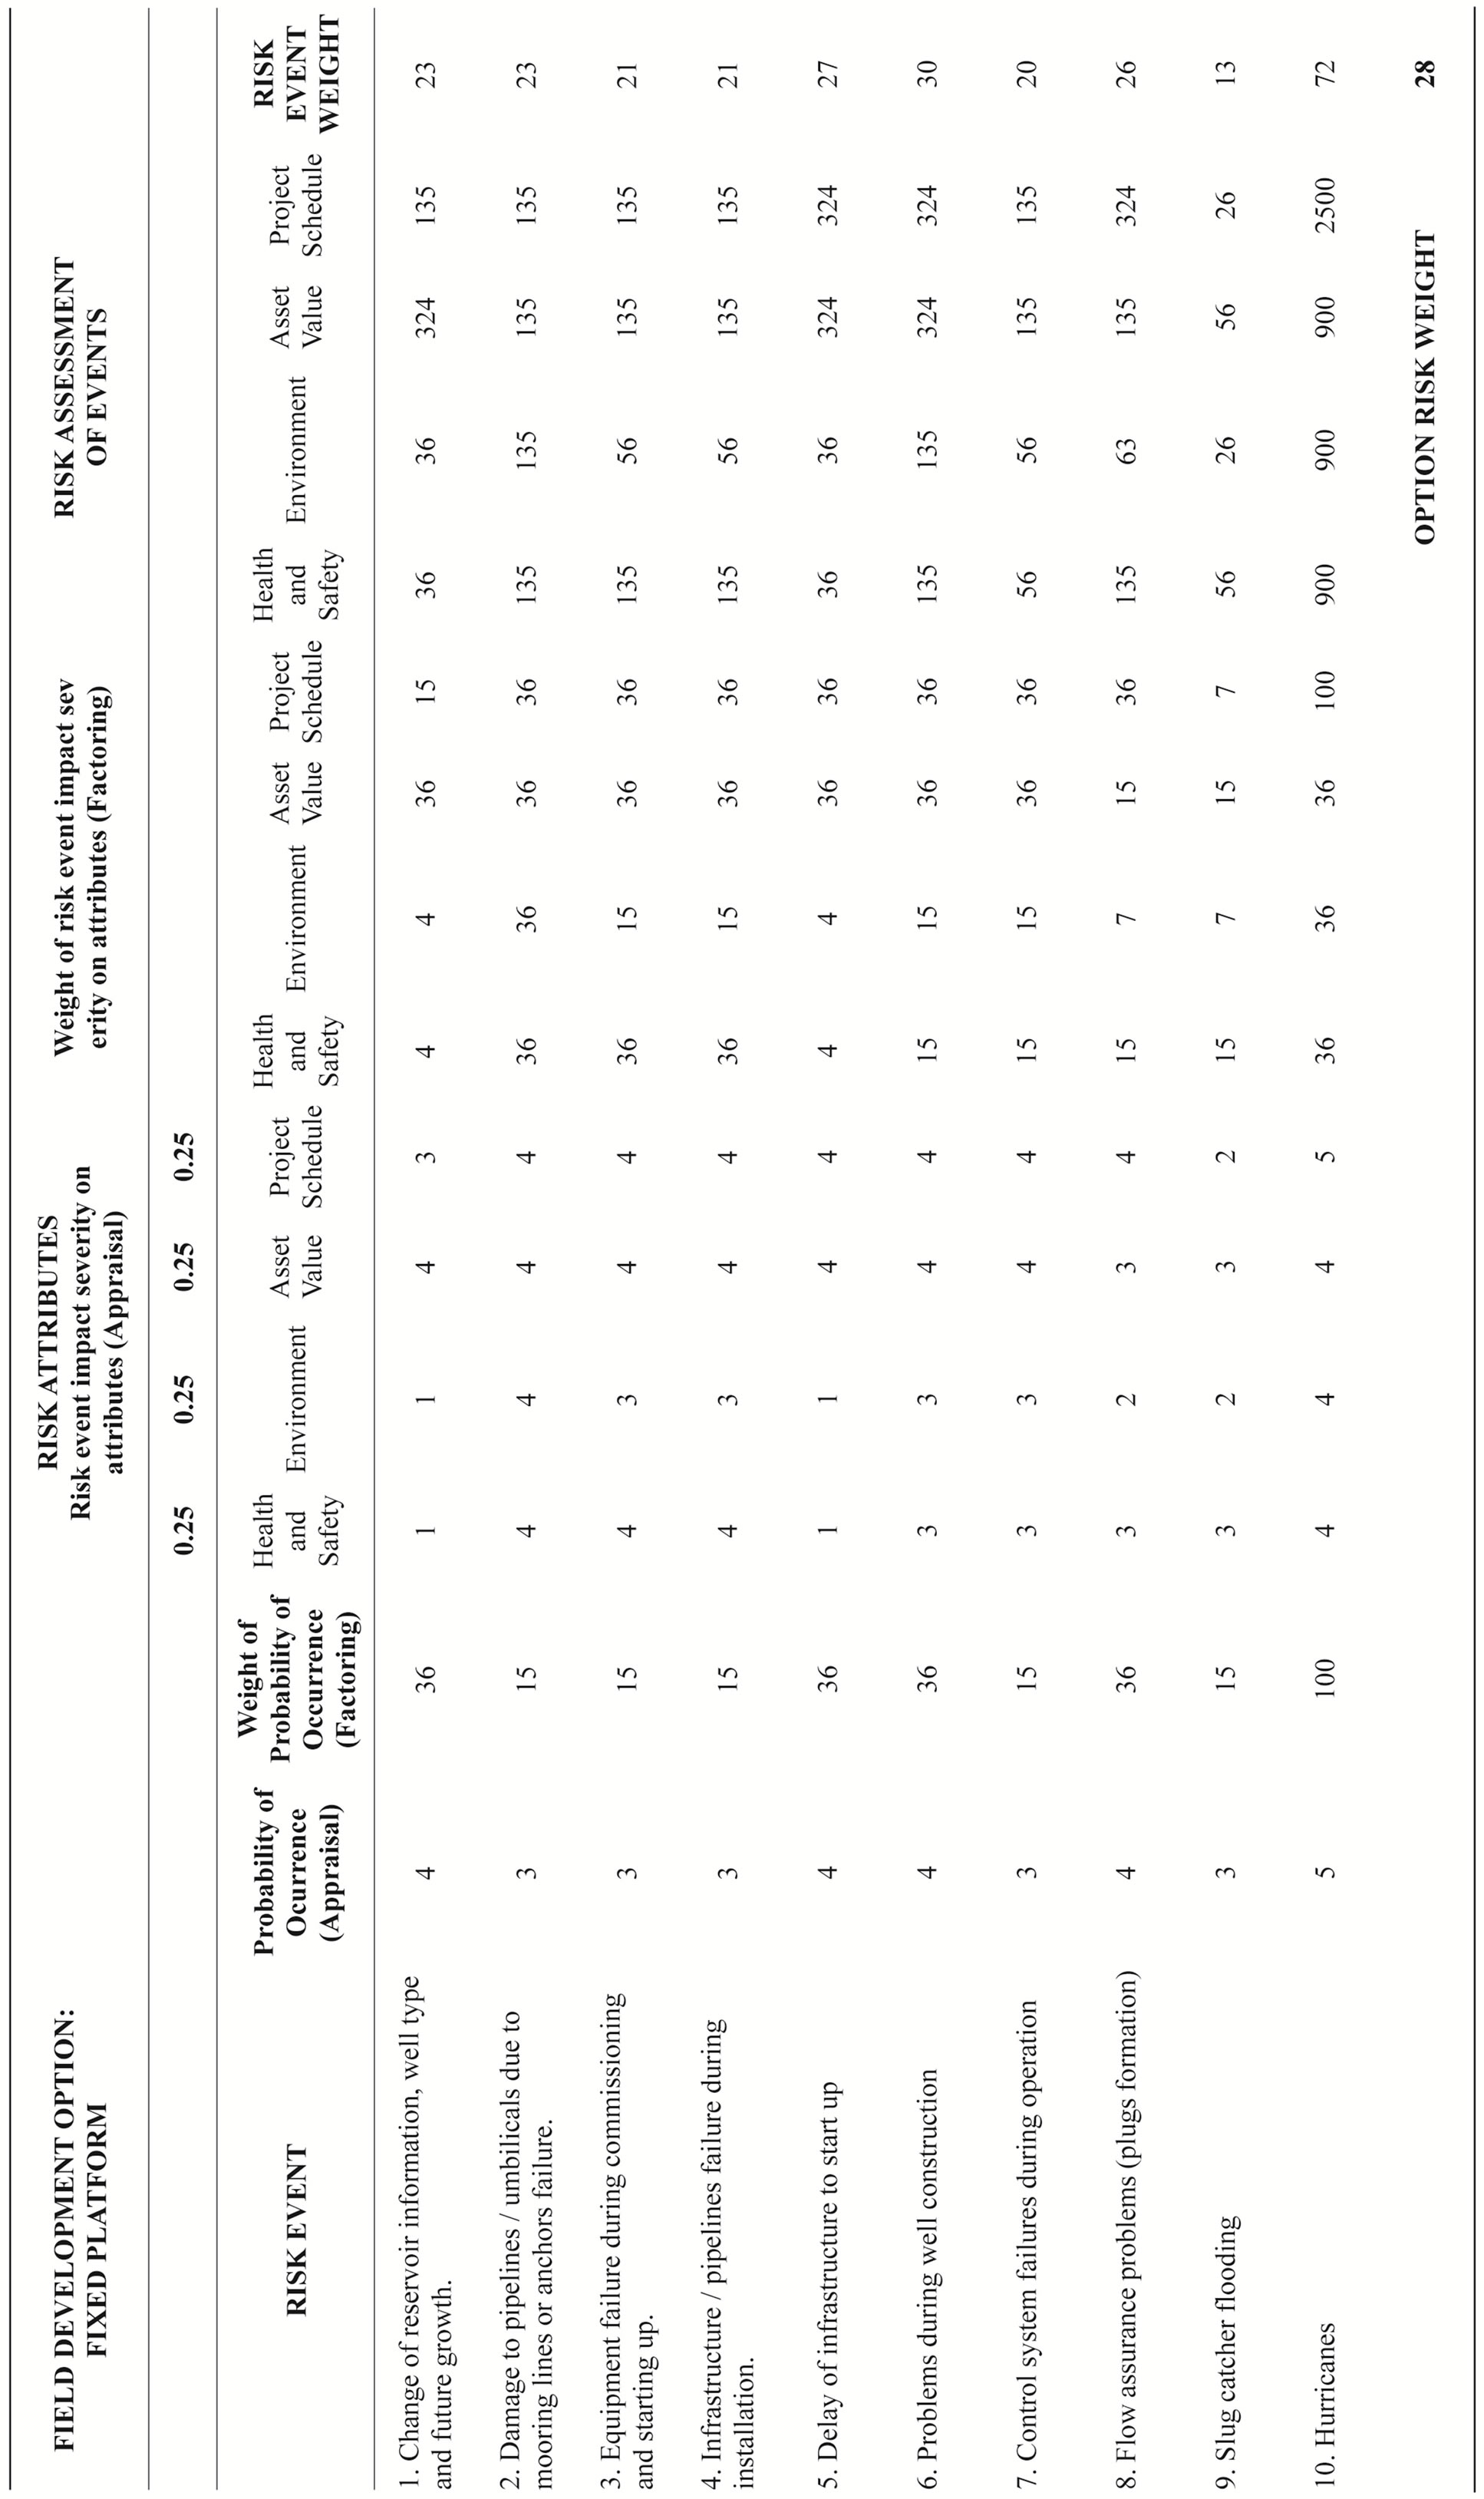
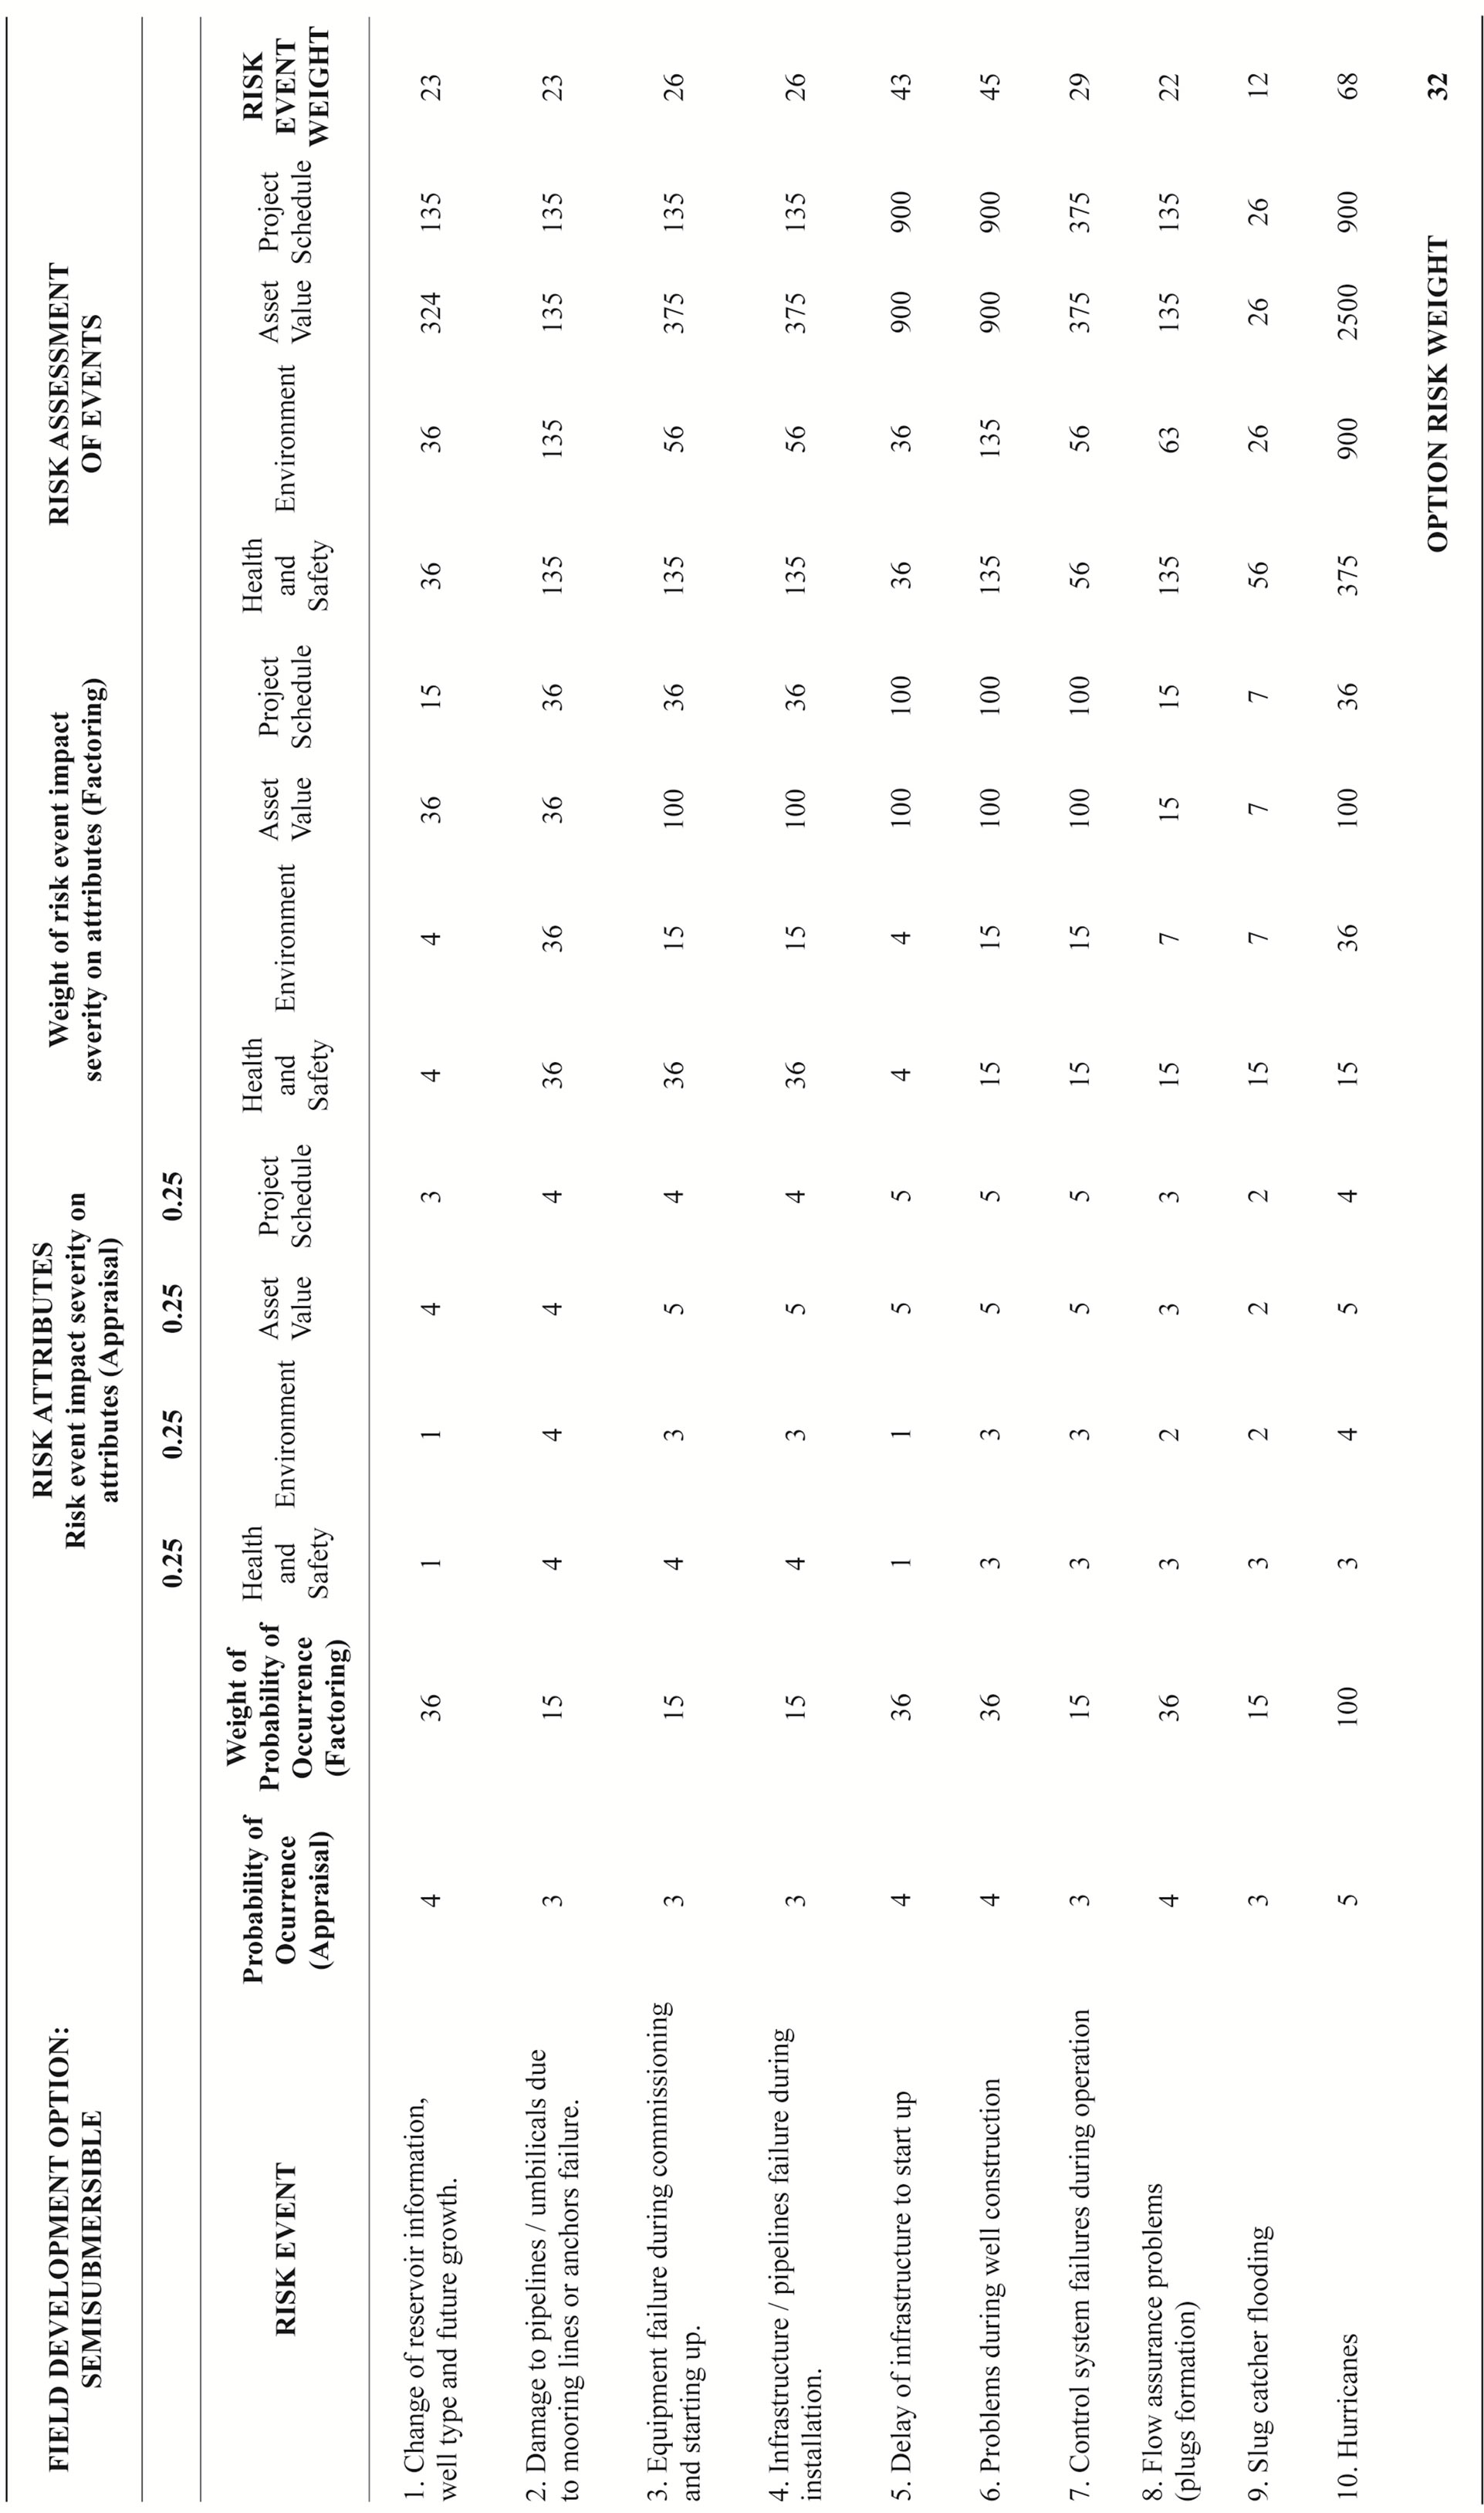
The risk weight process described in Table 9 for the tie back option was repeated for the fixed platform and the semisubmersible concepts, results are shown in Appendix 1; a summary of risk weights from Table 9 and Appendix 1 plus the qualitative value determined by MDM evaluation from Table 8 for the three development concepts is shown in Table 11.
A plot of data from Table 11 is shown in Figure 8(a), where it can be identified that the fixed platform option provides the best balance between risk weight and qualitative value determined by MDM.
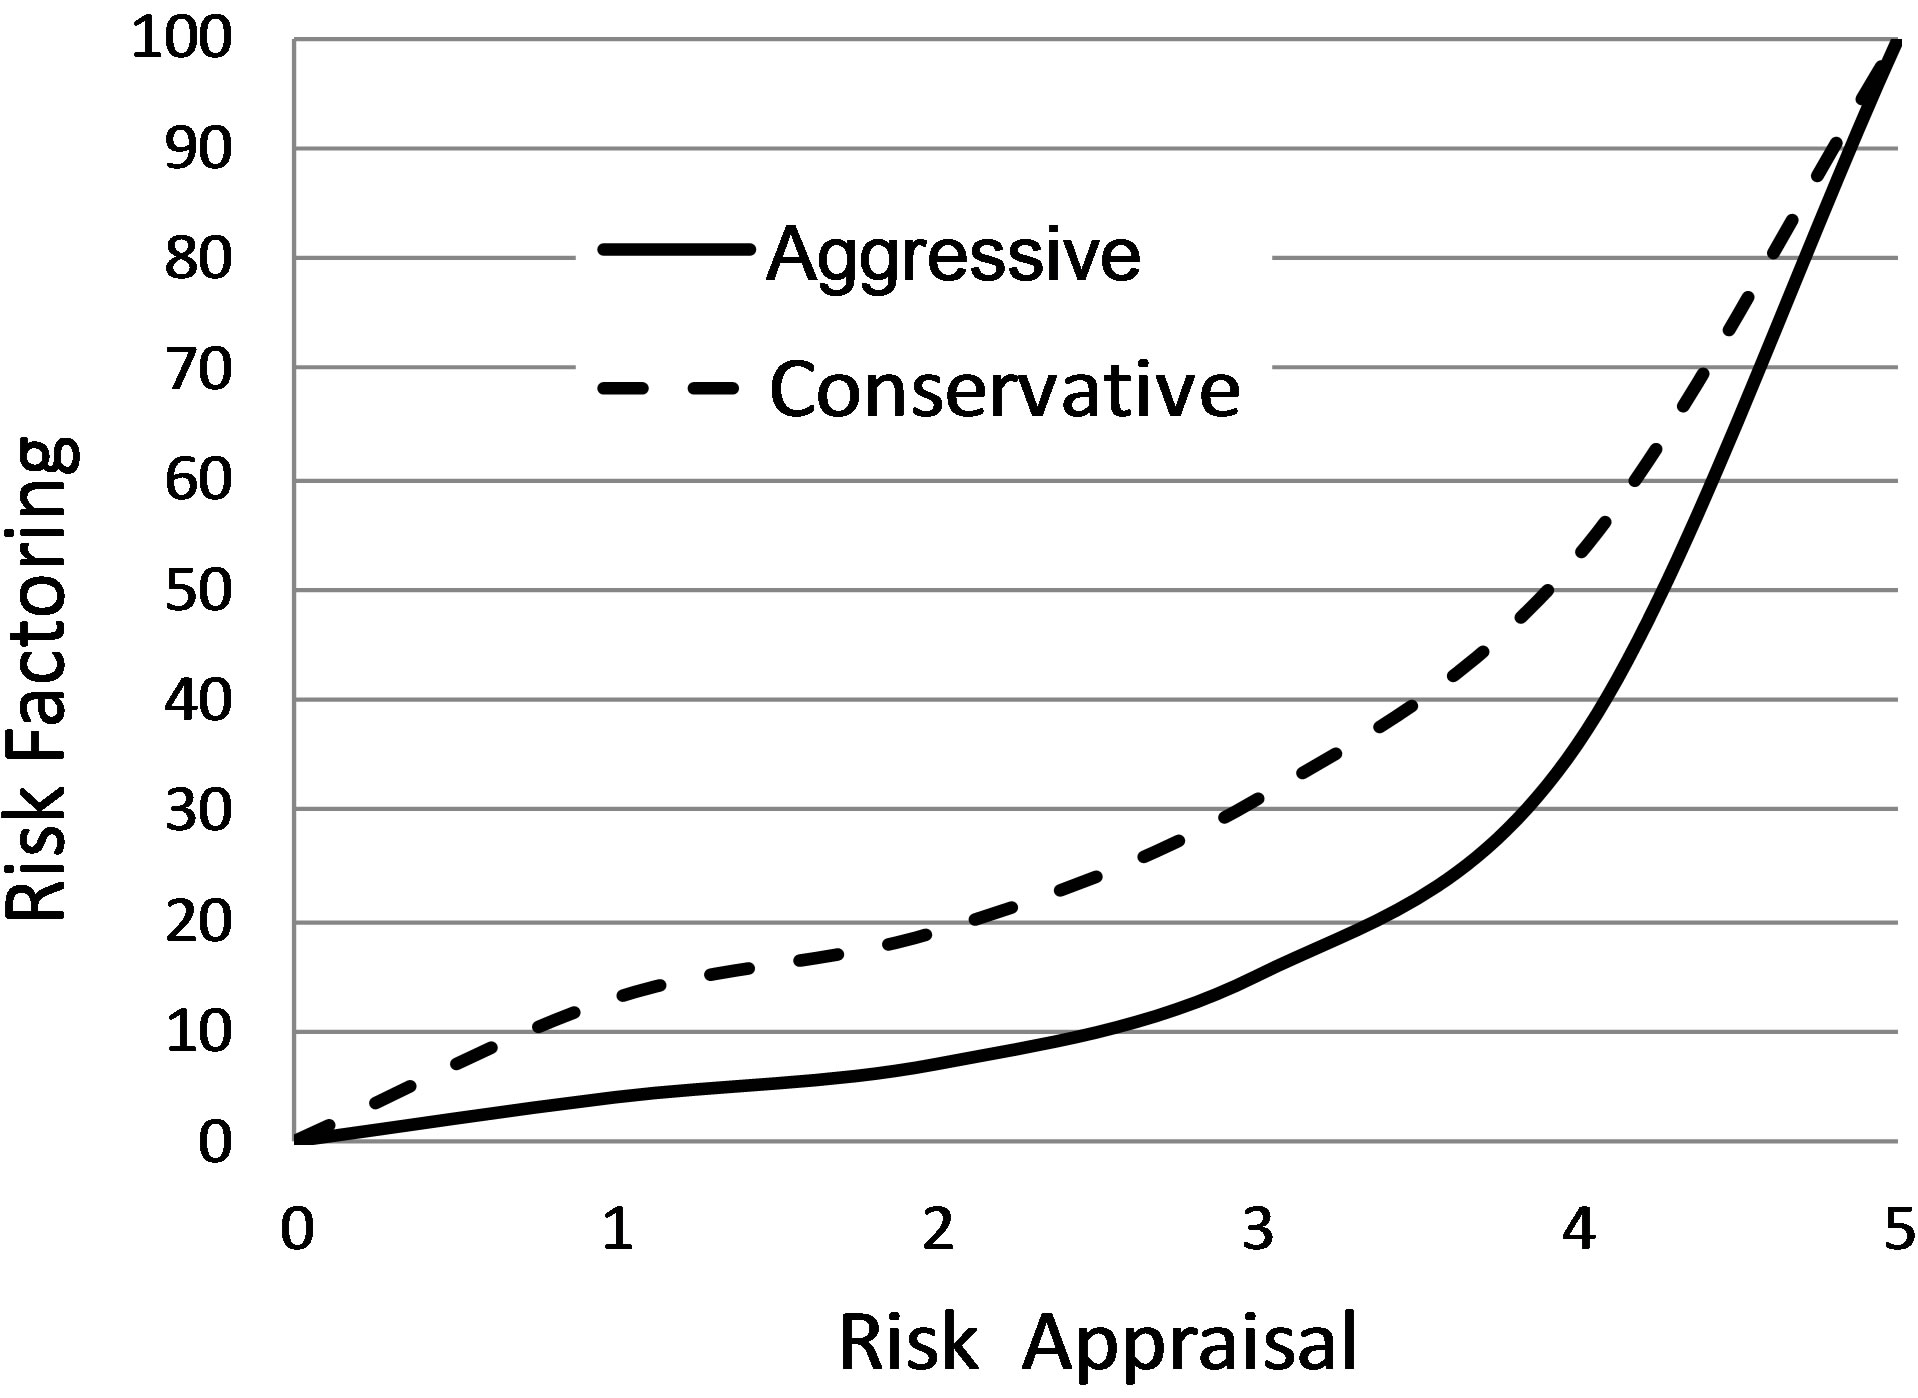
Figure 7. Risk taker profiles.
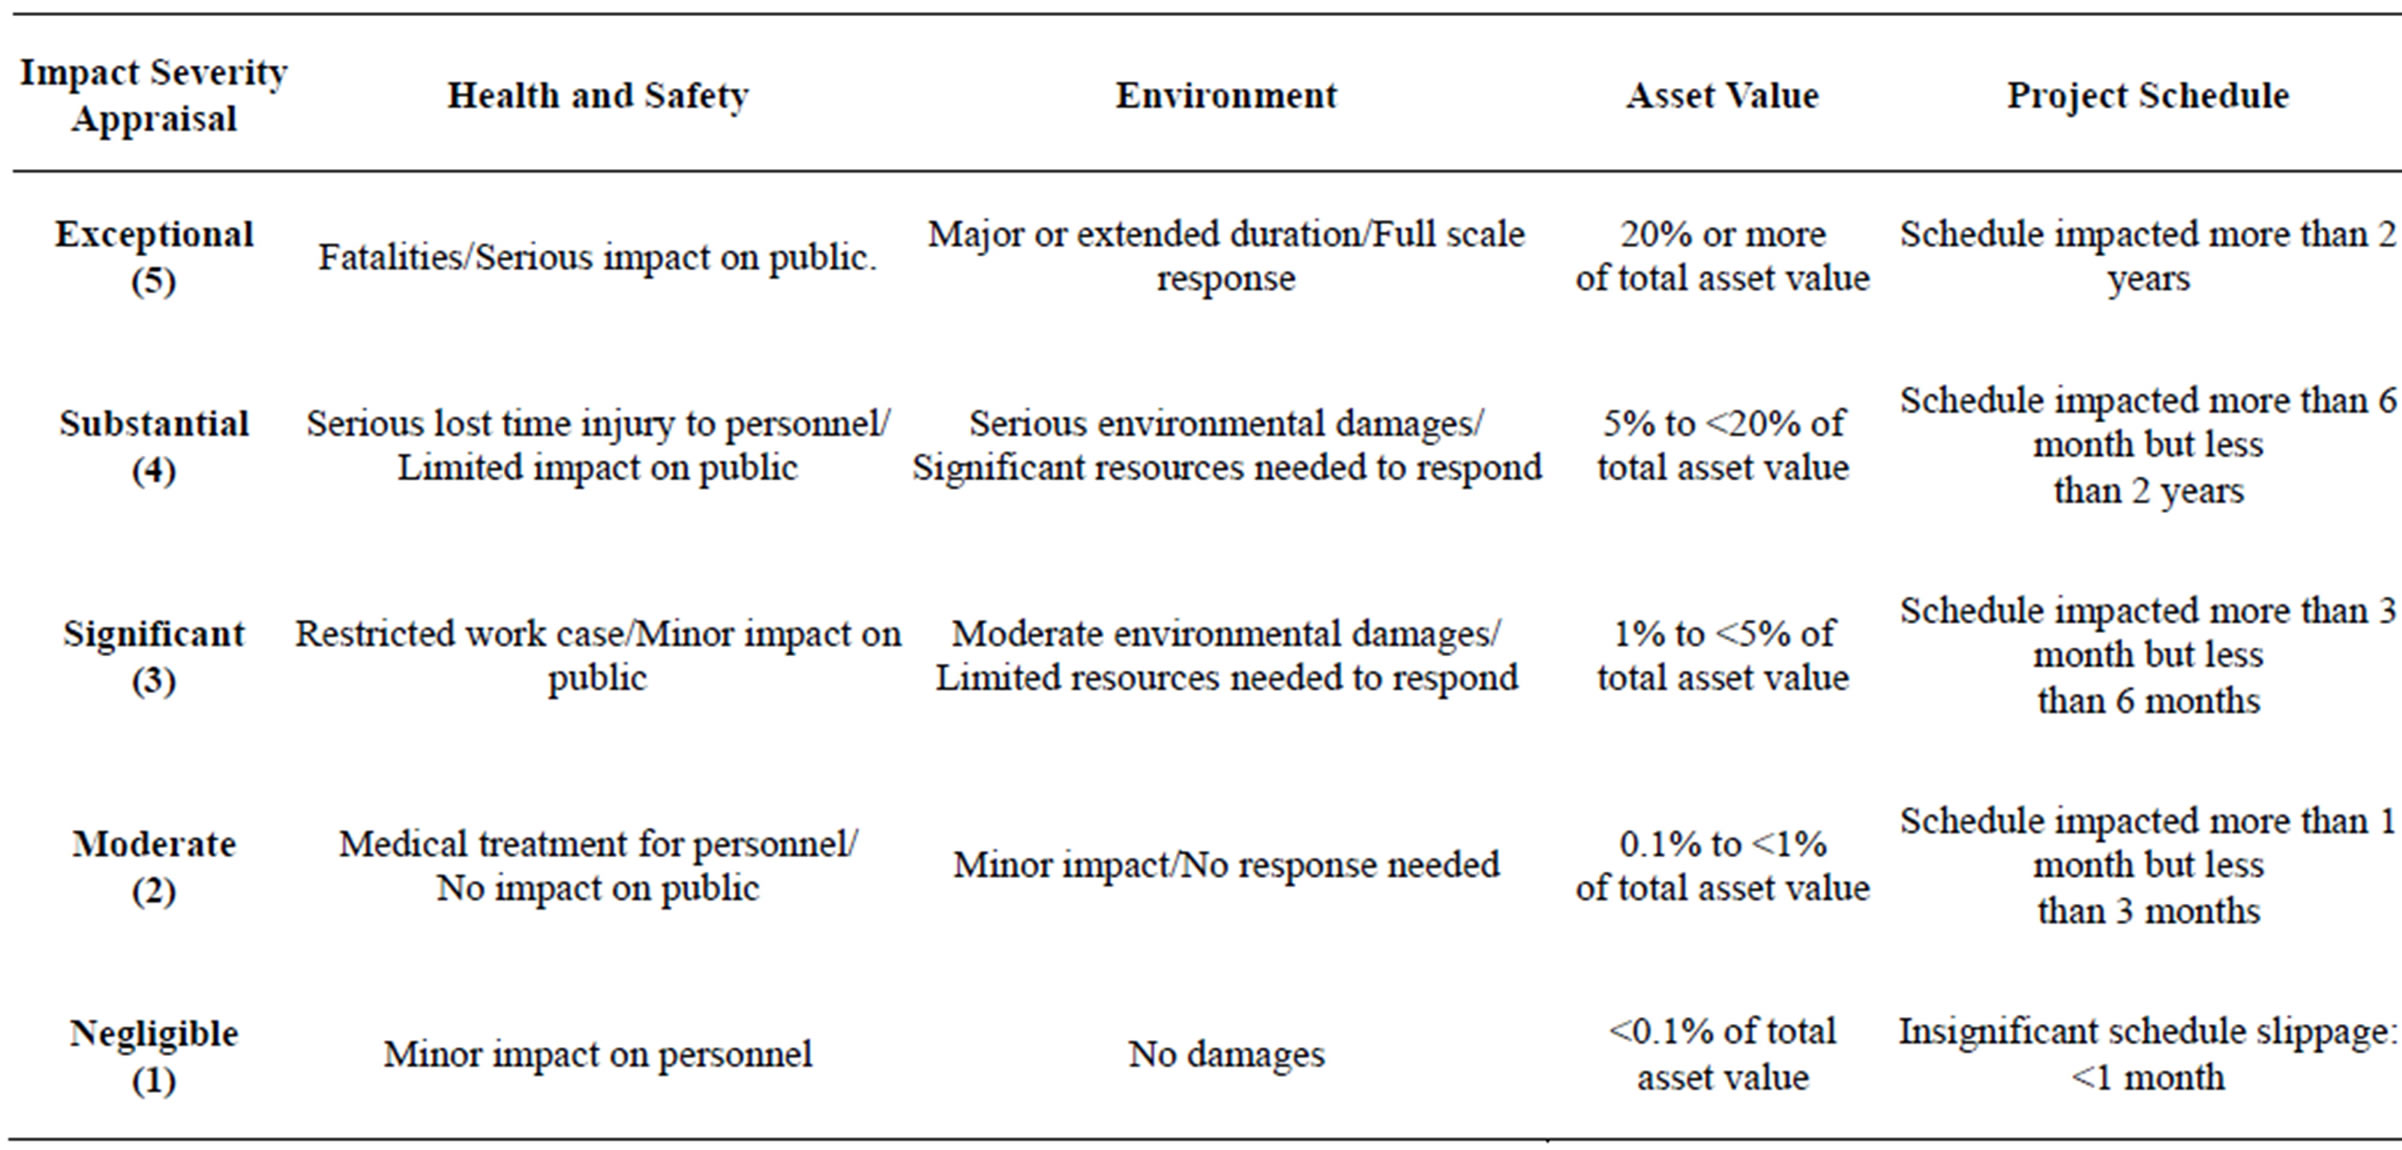
Table 10. Impact severity appraisal of risk events on attributes [9].
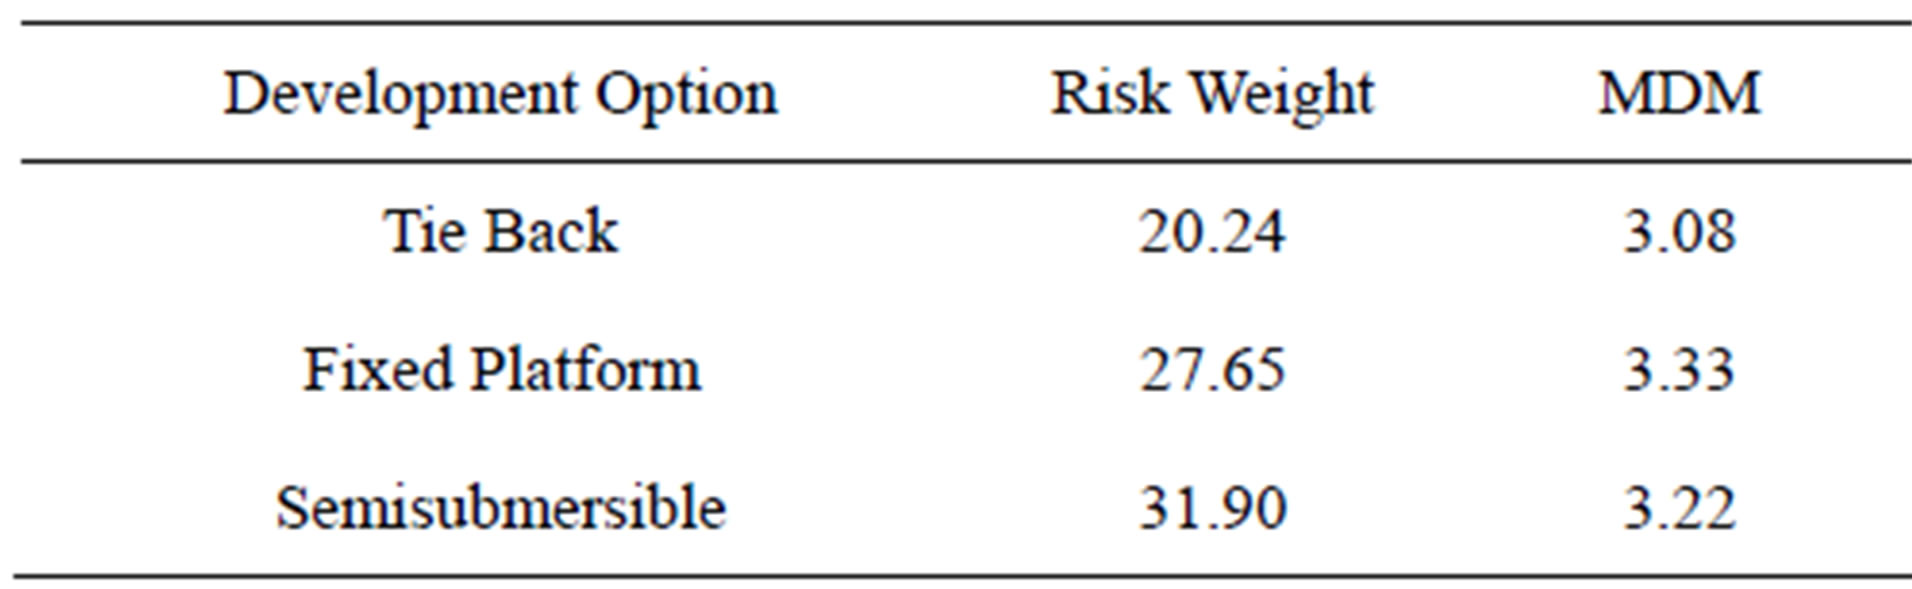
Table 11. Summary of risk weights and MDM evaluations.
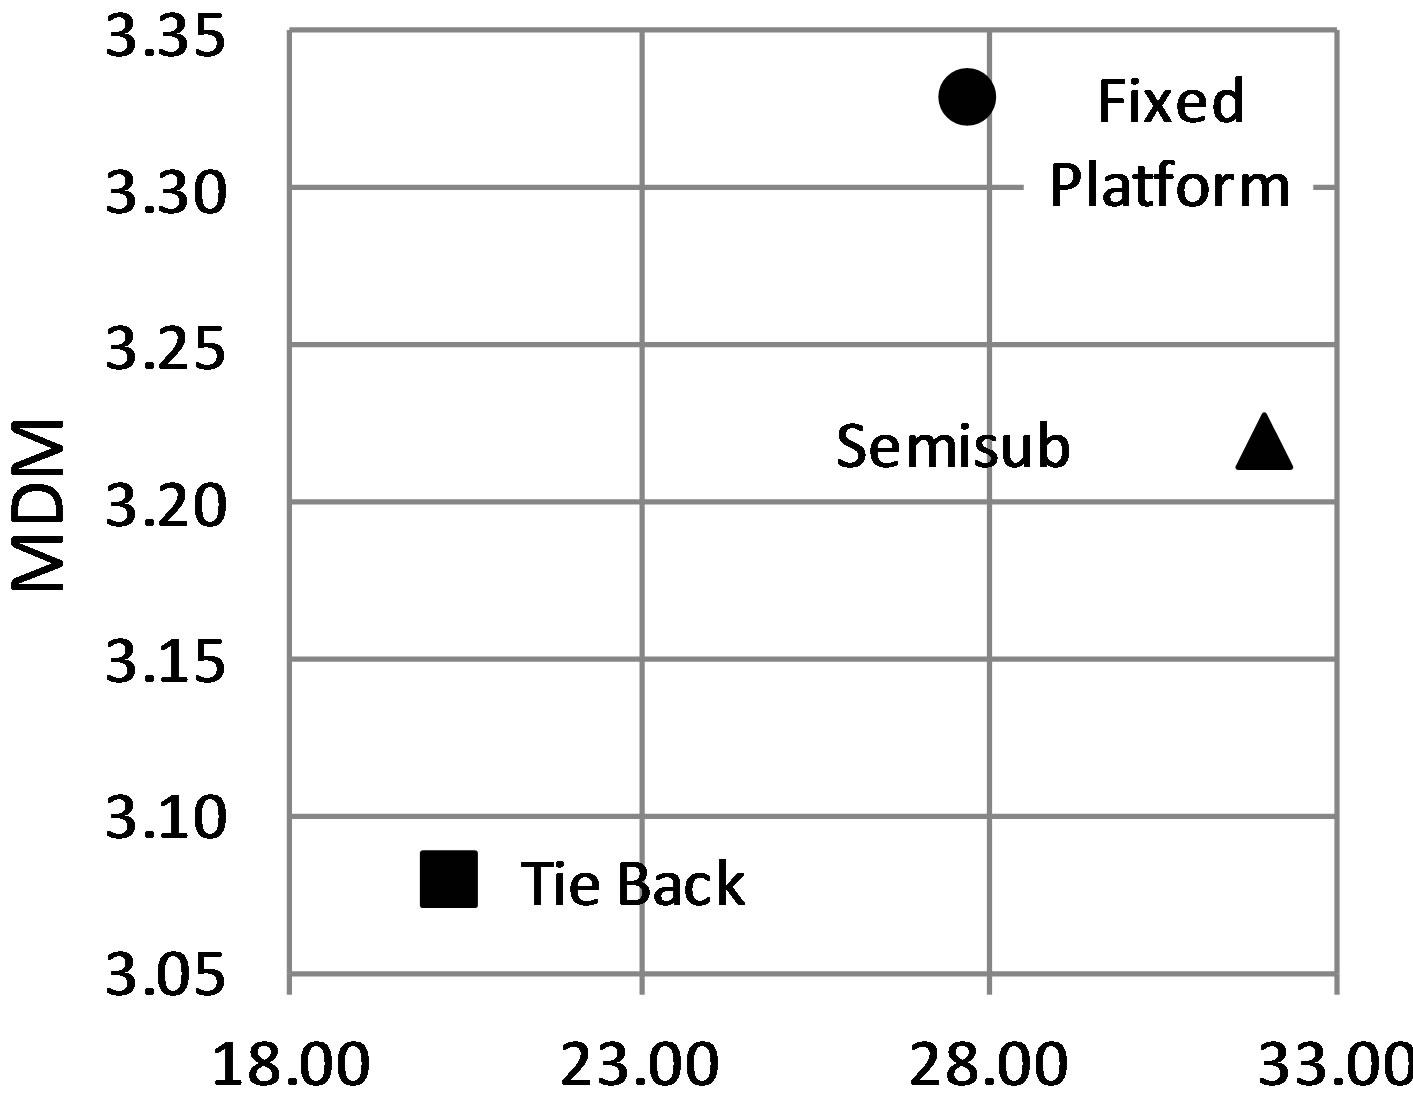
(a) Risk Weight
(b) Risk Weight
Figure 8. (a) Risk weight and MDM; (b) Risk weight and NPV.
5. Comparison of Economical Value and Multiattribute Decision Model
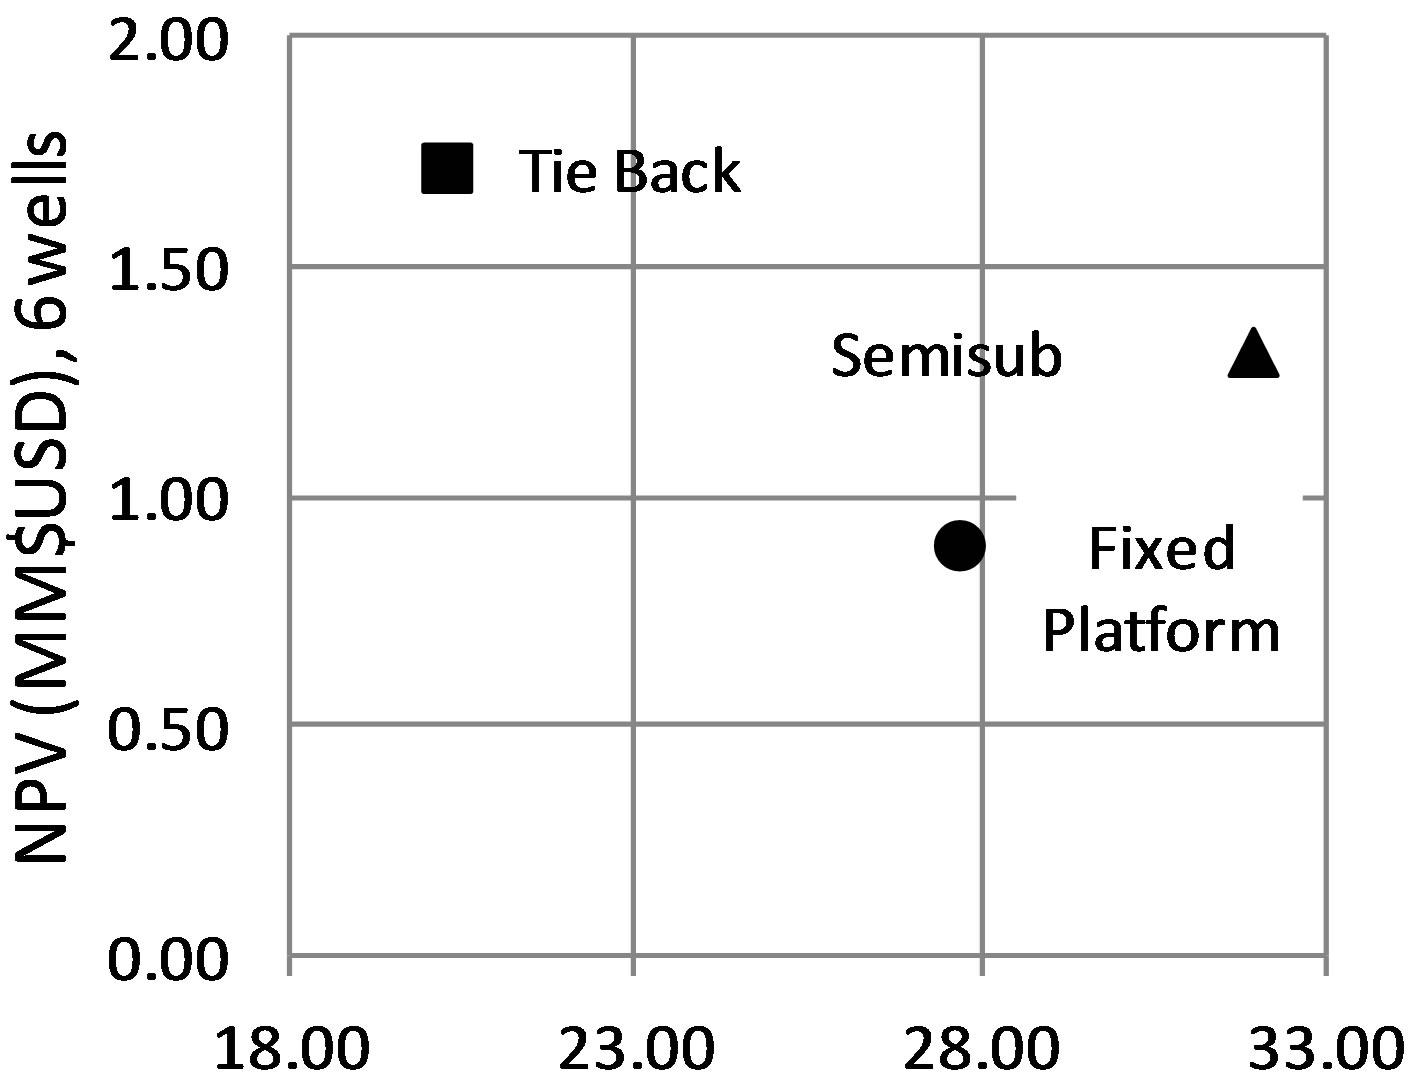
The main objective of this work is making a comparison between the economical value measured by the NPV and the UI with the MDM concept however, as mentioned previously it is relevant to incorporate the risk involved with each development option since the economical indexes are strongly related to the complexity to achieve production from a particular development option. Thus, in this work for comparison purposes, the risk weight from Table 11 and the best NPV from Figure 3 which is associated to the case of 6 wells for the three development concepts are considered; see Table 12.
A plot of data from Table 12 is shown in Figure 8(b), where it can be observed that the tie back is the best option since it provides the lowest risk weight and the highest NPV. Differences between Figures 8(a) and (b) are due to value MDM and NPV valuation approaches
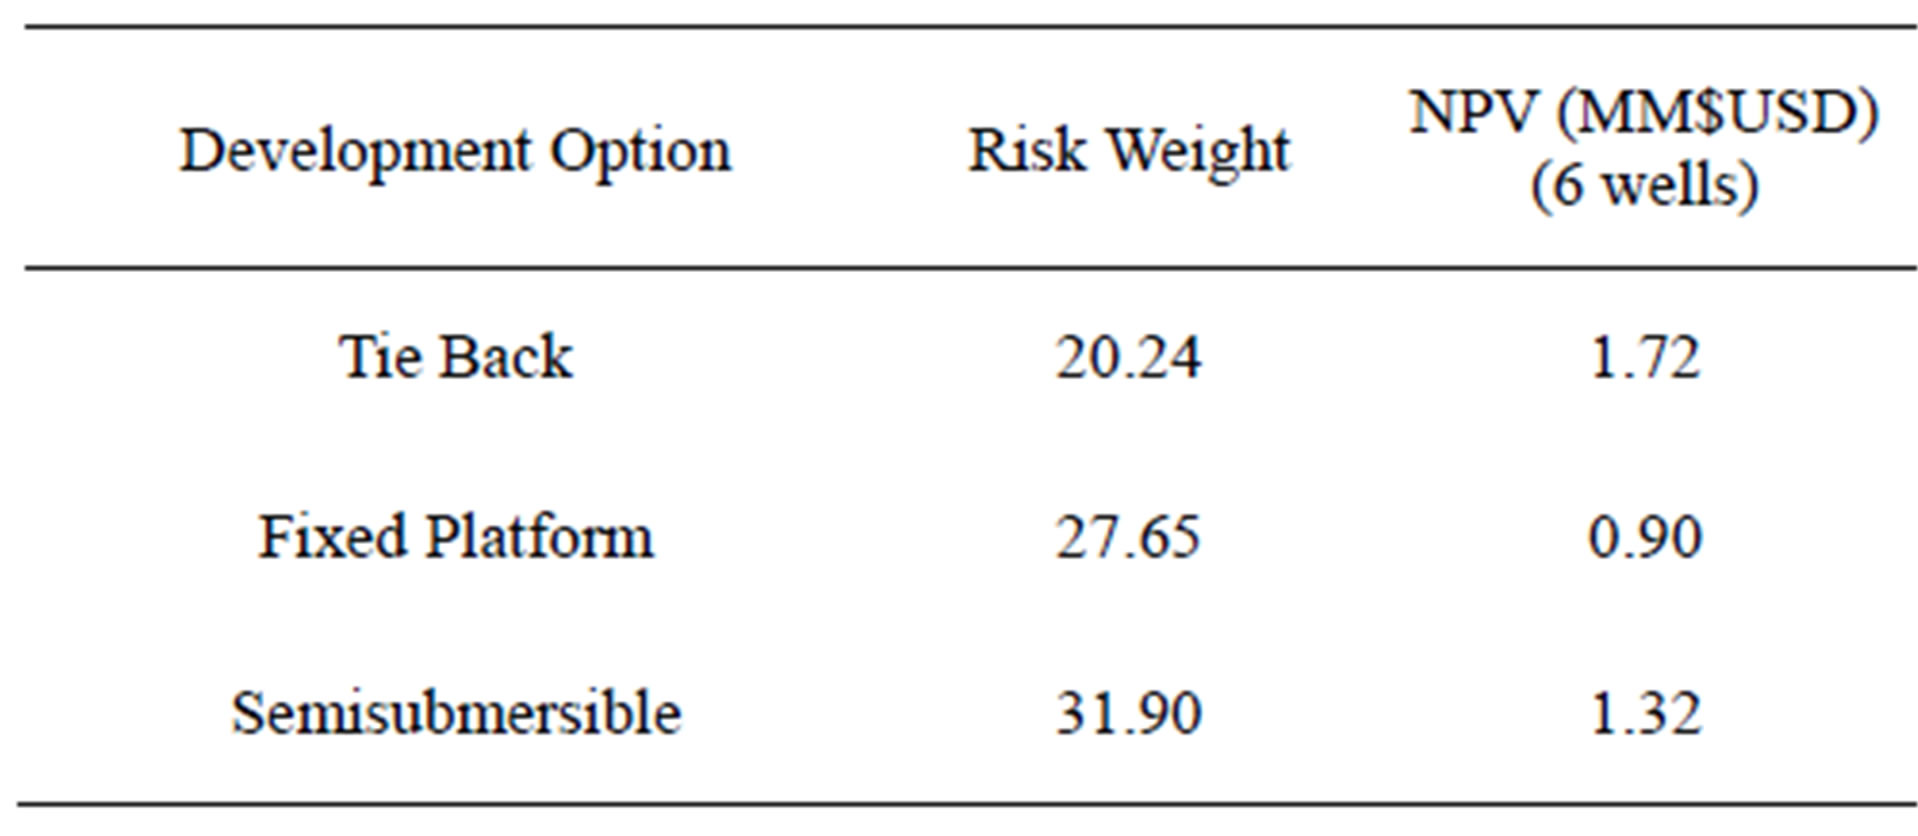
Table 12. Risk weight and best NPV for the three development concepts.
since risk weight values determined by MDM are the same for both figures. As mentioned, screening the development concepts based only on economics measured by economical indexes such as NPV and UI could discard concepts that can provide additional benefits during the service life measured indirectly by the MDM, since economics cannot easily appraise attributes like operability, time to first production, reliability, fabrication and installation; MDM represents the value appraised considering all these attributes.
Conclusions from Figure 8(b) show that the tie back option maximizes the NPV since it requires the lowest investment among the three concepts however, from the experts perspective who participated in the weighted valuation process to determine MDM and the risk weight, from Figure 8(a) it can be deduced that the fixed platform option can provide more value if relevant attributes present during the service life of the system such as operability, time to first production, reliability, fabrication and installation are considered.
It is not the intention of this work to debate on the best option to exploit an offshore gas field but to demonstrate that the economic perspective solely can differ substantially with the MDM approach when attributes that are not easily quantified in economical terms are considered in the MDM screening process.
On the other hand, the MDM approach presented in this work is the analytic hierarchy process and reference [10] shows that different MDM methods applied to the same problem can yield different results. Thus, it is highly expected that the MDM option selection can be different compared with an economical approach based on NPV.
The conclusion that can be derived from the comparison of these approaches could be that although inconsistencies are avoided when applying MDM methods due to the consistency indexes implemented within the MDM methodologies, there is always the bias effect present since attributes and sub-attributes are chosen by experts who assign weights according with their personal knowledge and experience.
Thus, would be recommended to compare the option selected based on economical means and the outcome by MDM methodologies with a third input such as the international industry experience. Since there is no close solution due to the fact that economics may lead to minimum investment which might not be the most reliable option and MDM would reflect experts’ bias so, a third input would help to have a wider view for decision making based on experience from other similar projects performed internationally.
6. Stochastic Analysis
It is well known that the engineering judgment, which is the main tool to assign attributes weights, may vary depending on the information available, time frame to deliver results and even on the experts relationship thus, it is important to perform a stochastic analysis to identify how dependant is the development option selection to variations in the attributes weights.
Attributes weights from top section of Table 6 were set as the base case and a variation range up or down the base case was defined considering a usual dispersion shown by experts during attribute weight evaluation workshops which is usually one scale unit of the analytical hierarchy process evaluation criteria as shown in Table 5.
A Monte Carlo model based on Tables 6 and 8 was setup to measure the stochastic multiattribute decision model difference between the three development concepts studied in this work when the attributes weights vary. In this model, the attributes weights shown in Table 6 considered as the base case, were made to vary randomly on 10,000 trials between one up or down scale unit of the analytical hierarchy process evaluation criteria as explained before, see Table 5. This process allowed determining the extreme attribute weights values shown in Table 13.
To measure the stochastic MDM difference between the three development concepts, the range within the lower and upper attributes weight values from Table 13 was randomly sampled on 10,000 trials and inputted in the Montecarlo Model based on Table 8.
Stochastic analysis results are shown in Figure 9, it can be observed that the highest values of MDM are associated to the fixed platform development option since the frequency diagram is positioned on the extreme right
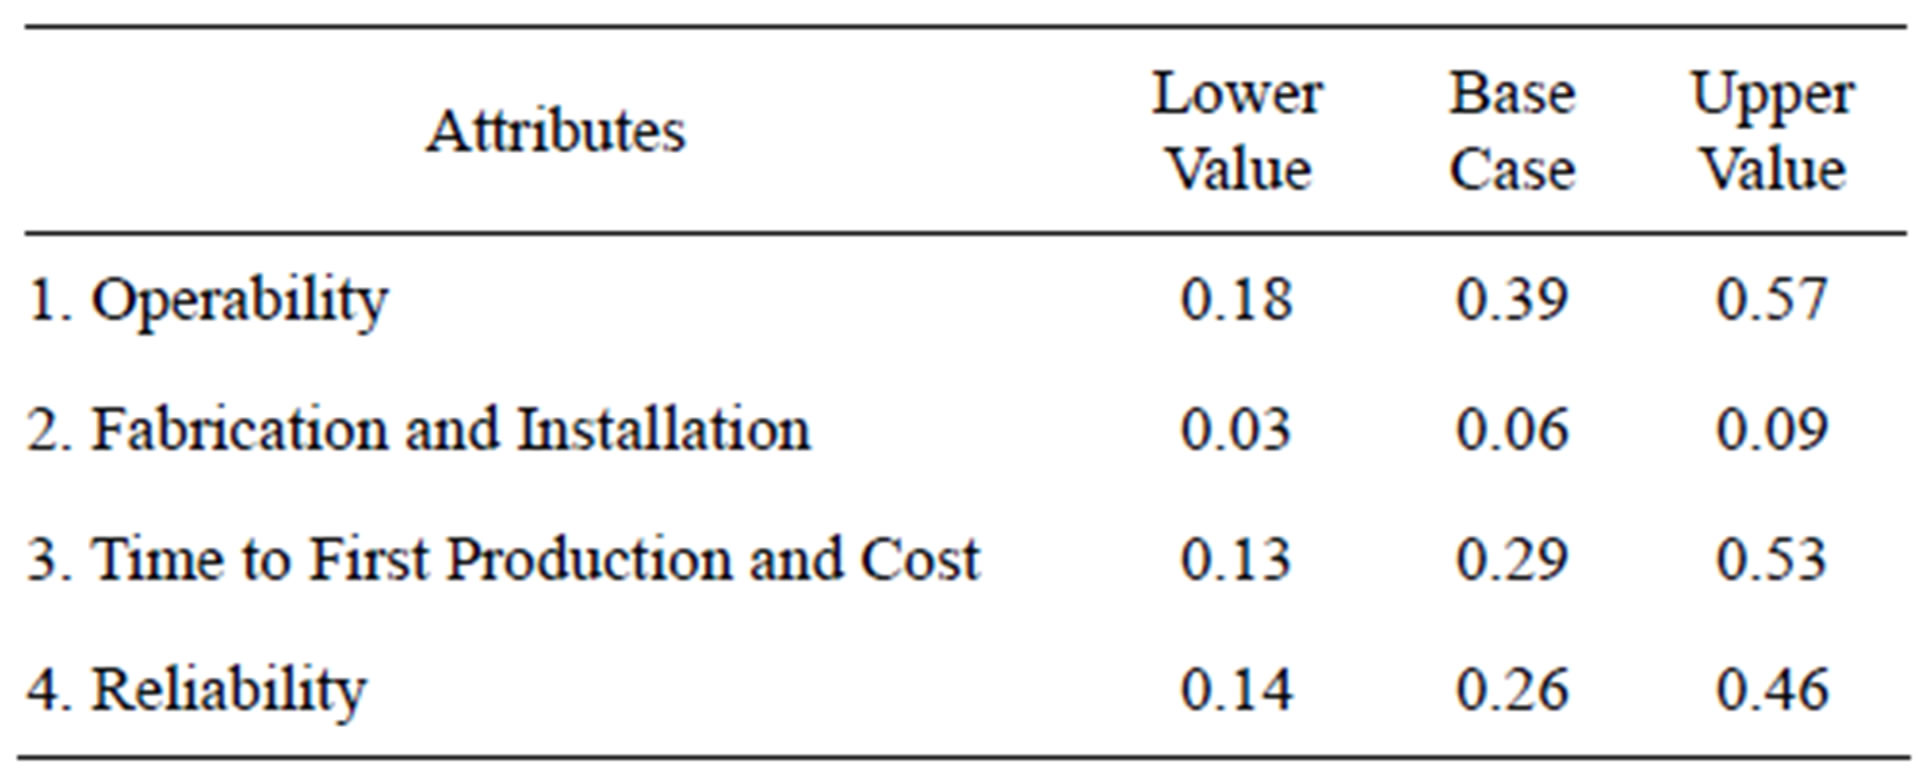
Table 13. Attributes weight value range.
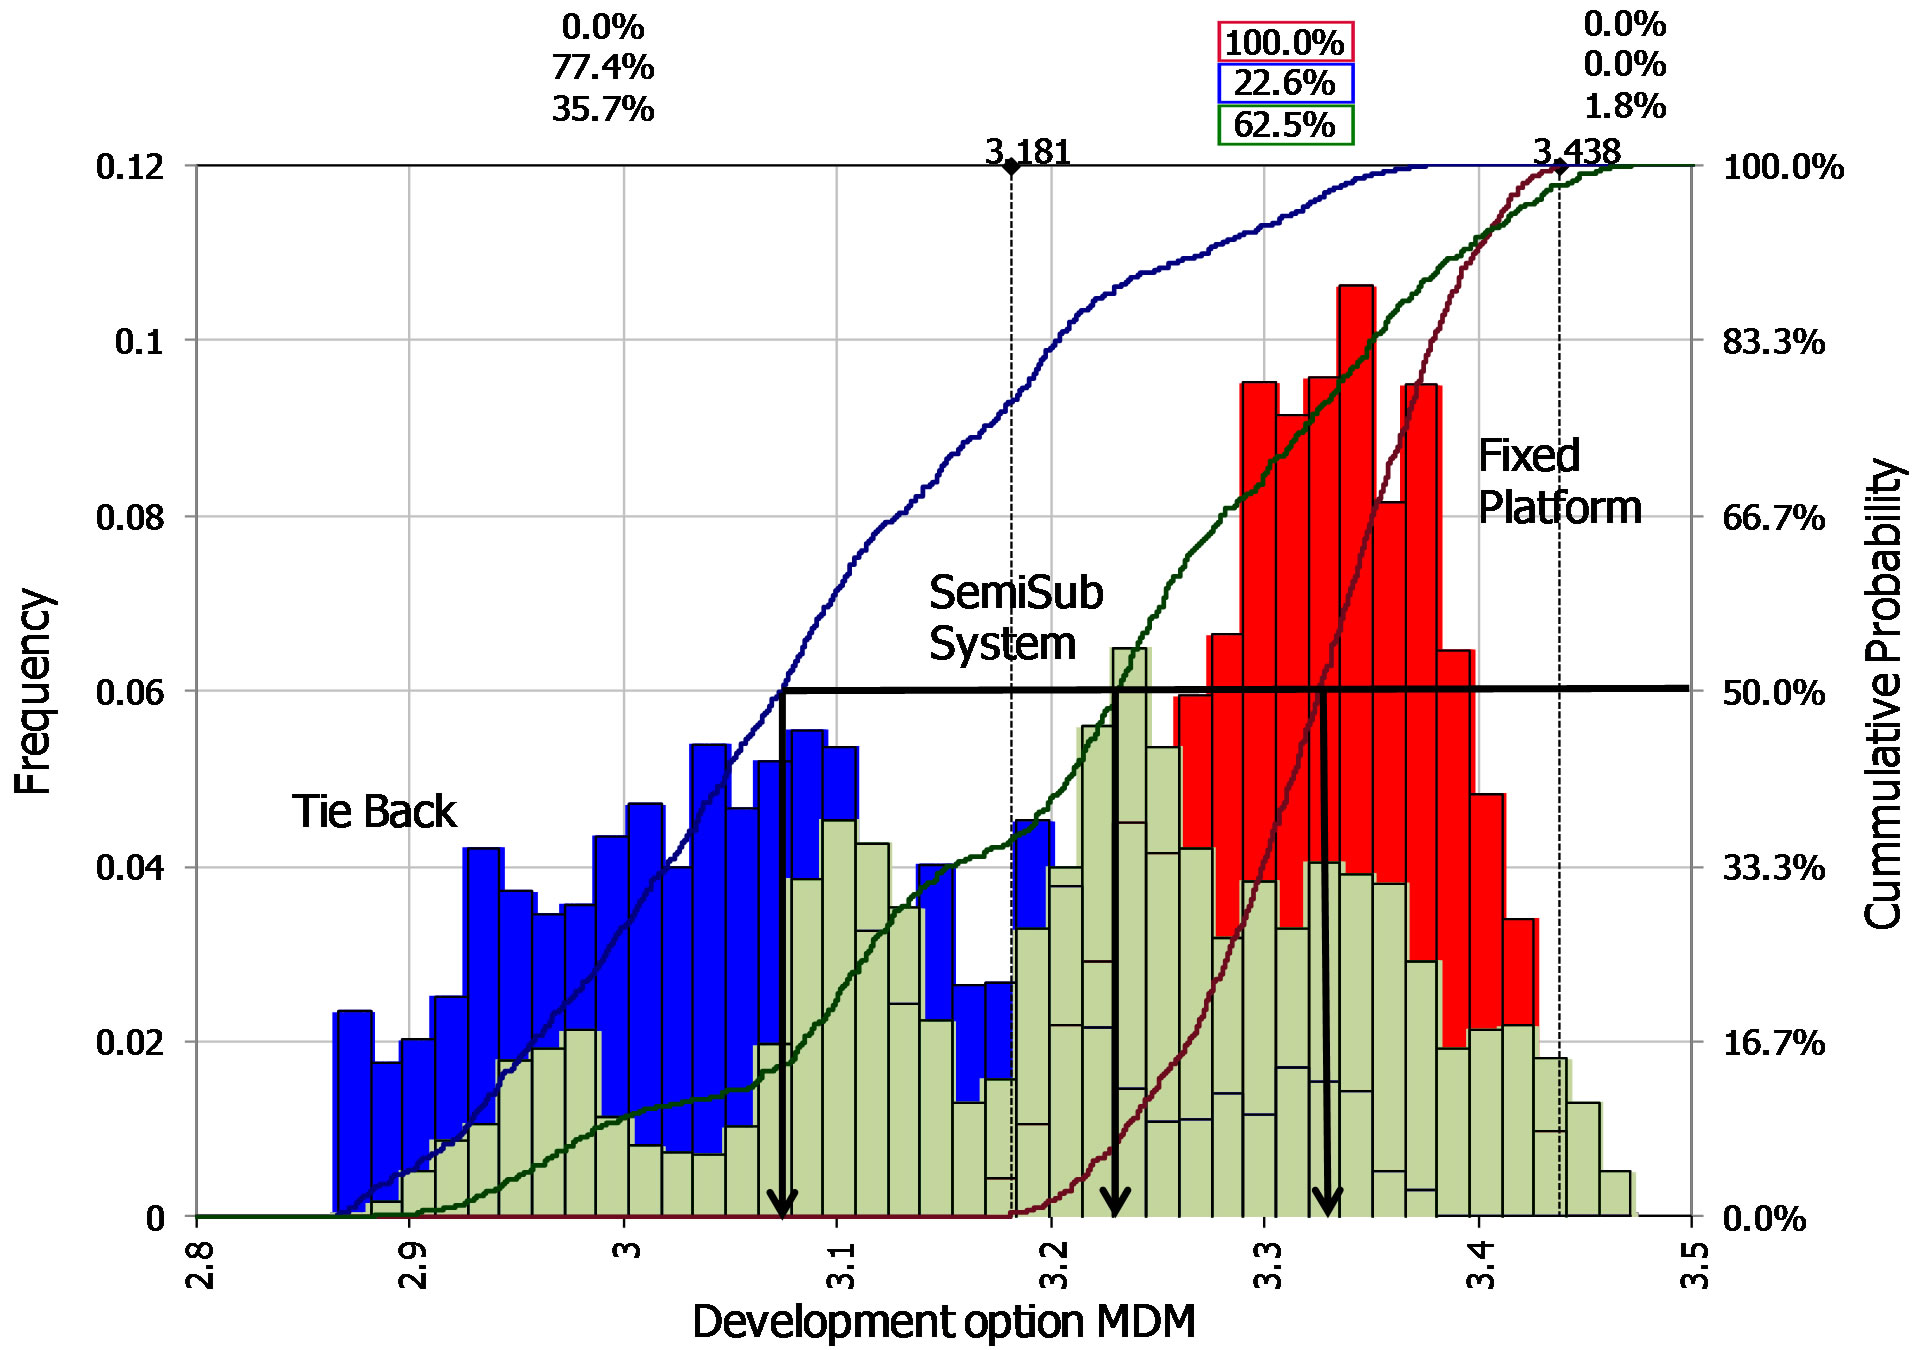
Figure 9. Stochastic analysis of MDM.
of the plot. Two delimiters on the top horizontal axis show the lower (3.181) and upper (3.438) extreme MDM for the fixed platform development option thus, the cumulative probability within these values is 100%.
The semisubmersible system development option has 62.5% probability of having the same MDM as the fixed platform, 35.7% probability of having MDM less than the fixed platform and only 1.8% probability of having MDM greater than the fixed platform.
Finally, the tie back development option has 22.6% probability of having the same MDM as the fixed platform and 77.4% probability of having MDM less than the fixed platform.
Additionally, from Figure 9 the median of the multiattribute decision model values which is 50% of cummulative probability are 3.32, 3.23 and 3.07 for the fixed platform, semisubmersible system and tie back development concepts respectively which are almost the same as determined from the experts’ workshop shown in Table 11. From previous results, it can be concluded that the fixed platform development option is associated to the highest probability of greater MDM.
From the economical perspective the tie back is the best development option since it provides the highest NPV, see Figure 8. However, by the multiattribute decision model used in this work, it is possible to identify that the fixed platform could be a better development option considering attributes that cannot be directly appraised in economical terms such as operability and reliability but as mentioned before the experts’ bias also plays an important role in this result.
7. Conclusions
Different concept selections for hydrocarbon field development planning based on economic and on multiattribute decision analysis can be obtained. If different multiattribute decision models are applied to the same problem they can yield different results. Thus, it is expected that the concept selection outcome from multiattribute decision models can be different compared with an economical approach.
Field development concept selection based on maximizing NPV calculated from a basic economical model as it is usually done in the stages of screening and concept selection could lead to exclude aspects that are relevant during the infrastructure operation service life such as operability and reliability.
The outcome from the multiattribute decision analysis relies on the attributes selected and experts’ knowledge and experience performing attributes weight valuation. Experts’ bias effect can be appraised by introducing a stochastic analysis of attributes weight valuation.
Since there is no close solution due to the fact that concept selection based on economics may lead to minimum investment which might not be the most reliable option and multiattribute decision models would reflect experts’ bias thus, a third input based on international industry experience from similar projects would help to have a wider view for decision making.
A method to identify the optimum number of wells based on NPV and on what is called in the paper as UI (utility index) is presented; this method is also compared with a full stochastic analysis which confirms its usefulness.
8. Acknowledgements
Authors would like to thank Instituto Mexicano del Petroleo for providing the opportunity to produce and publish this work.
REFERENCES
- R. D’Souza and S. Basu, “Field Development Panning and Platform Concept Selection for Global Deepwater
- Developments,” Offshore Technology Conference, Houston, 2-5 May 2011, pp. 1-7. doi:10.4043/21583-MS
- AACE International, “Cost Estimate Classification System: As Applied in Engineering, Procurement, and Construction for the Process Industries,” AACE International Recommended Practice No. 18R-97, 2005.
- “2011 Deepwater Solutions & Records for Concept Selection,” Offshore Magazine, 2011. http://www.offshore-mag.com/content/dam/etc/medialib/platform-7/offshore/maps-and_posters/0511OS_DeepwaterPoster040711Ads.pdf
- T. L. Saaty, “The Analytic Hierarchy Process: Planning, Priority Setting, Resource Allocation,” McGraw-Hill, New York, 1980.
- T. L. Saaty and L. G. Vargas, “Prediction, Projection, and Forecasting: Applications of the Analytical Hierarchy Process in Economics, Finance, Politics, Games, and Sports,” Kluwer Academic Publishers, Boston, 1991.
- J. A. Alonso and M. T. Lamata, “Consistency in the Analytic Hierarchy Process: A New Approach,” International Journal of Uncertainty, Fuzziness and Knowledge-Based Systems, Vol. 14, No. 4, 2006, pp. 445-459. doi:10.1142/S0218488506004114
- US Minerals Management Service, “Steel Catenary Riser Integrity Management,” Joint Industry Project, Summary of JIP. No. 4-4-5-010/TN08, Rev.1, 2008.
- A. B. Chakraborty, “Holistic Approach to HSE Performance Asset, Monitoring and Management in an Integrated Upstream Oil/Gas Corporation,” SPE International Conference on Health, Safety, and Environment in Oil and Gas Exploration and Production, Calgary, 29-31 March 2004, Document ID: 86744
- Instituto Mexicano del Petróleo, “Internal Report on Concept Selection,” 2008.
- L. Virine and D. Murphy, “Analysis of Multicriteria Decision-Making Methodologies for the Petroleum Industry,” International Petroleum Technology Conference, Dubai, 4-6 December 2007, Document ID: 11765.
NOTES
*Corresponding author.