Journal of Information Security
Vol. 3 No. 2 (2012) , Article ID: 18826 , 7 pages DOI:10.4236/jis.2012.32019
Effect of Network Traffic on IPS Performance
Department of IT, Khajeh Nasir University, Tehran, Iran
Email: mohammadi@kntu.ac.ir, {vahidallahvakily, mojtaba.khaghani}@gmail.com
Received December 22, 2011; revised January 26, 2012; accepted February 27, 2012
Keywords: Network Security; Network Intrusion Detection and Prevention System; DOS Attack; Network Traffic Generation
ABSTRACT
The importance of network security has grown tremendously and intrusion prevention/ detection systems (IPS/IDS) have been widely developed to insure the security of network against suspicious threat. Computer network intrusion detection and prevention system consist of collecting traffic data, analyzing them based on detection rules and generate alerts or dropping them if necessary. However IPS has problems such as accuracy signature, the traffic volume, topology design, monitoring sensors. In this paper, we practically examine the traffic effect on performance of IPS. We first examine the detection of DOS attack on a web server by IPS and then we generate network traffic to see how the behavior of IPS has influenced on detection of DOS attack.
1. Introduction
Over the past few years, computer security has become a great concern in computer science. Intrusion detection and prevention system has become important tools in network security. Operation of intrusion detection/prevention system can be divided into five modules, as given in Figure 1 [1,2]. First, the sensor module gathers data for processing. This module can be categorized into two classes, Network IPS and Host IPS. The former captures network traffic in promiscuous mode (Network IPS), while the latter gathers characteristics of hosts (Host IPS). The second module is the decoder which identifies each layer header. Third module is responsible to look for abnormality in packet header or host information and organizes data and information to be further analyzed by detection engine. The Fourth module is the detection engine which detects attacks and threats base on misuse and anomaly detection. In the former, detection is occurred base on comparing the packet to known pattern attacks, while in the latter, detection is occurred base on normal profile that defines normal activity and anything that doesn’t have that behavior considered as a threat. The final module is responsible for taking care of identified attacks. Dropping the packets and generating alerts for administrator is the main configuration for this module.
The structure of these modules can be changed on demands; For Example sensor module can act as centralized or distributed module. There has been much progress in detection engine and algorithms used in misuse detection and anomaly detection; however, there are many
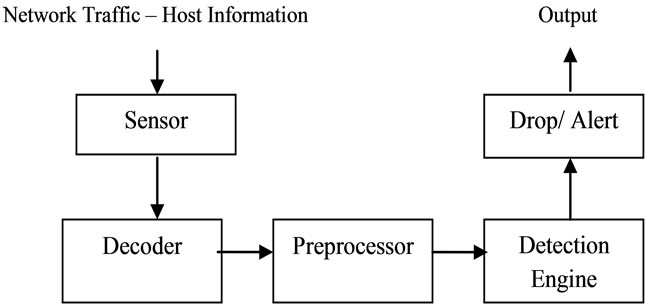
Figure 1. Operation of intrusion prevention system.
challenges to overcome in this field. The main issues in IPS are accuracy signature, the traffic volume, topology design, quota usage logging, monitoring sensor and protecting intrusion detection and prevention system, more discussion on this issues can be found on [3].
In this paper, we want to study the effect of traffic volume on performance of IPS. In the previous works which has been done on IPS, metrics such as TP, TN, FP and FN has been introduced for measuring the performance of IPS [3,4]. These metrics evaluate the accuracy of detection engine module in IPS, for example TP (True Positive) points to the number of attacks which IPS correctly identified related to the number of packets that IPS analyzed. In this paper, we measure the performance of IPS base on number of packets that IPS captures but cannot be analyzed because of resource limitation. If intrusion prevention system cannot analyze the packets, the probability of happening attack, without IPS/IDS knowledge, increase and this is a great risk to our network security. According to Murphy’s Law, attacks are happening when IPS/IDS is overloaded [5].
The rest of this paper is structured as follow. In Section 2, we go over the related works in this area, in Section 3 we explains our approach and the tools which we use in our network scenario. In Section 4, we evaluate IPS performance and result of each step in test, Section 5 we explain our results from the experiments performed in this paper, and finally we conclude our paper results and future works.
2. Related Works
In this section, we points to some of the previous works which has been done on IDS/IPS performance; we give the main idea in each of them and compare our works with them.
The subject of Master thesis in [6] is about the performance testing of intrusion detection server. In this thesis, the writer specifically concentrates on snort as IDS and measures the delay which snort puts in network traffic. He talks about the modules in snort and focuses more on the preprocessing modules in snort. As the final results of his work, he mentions that the flow and stream4 preprocessing are the most expensive modules of snort in detection of intrusions; however, he doesn’t examine attacks while monitoring the network traffic. The main contribution of this thesis is about the effect of IDS in network performance.
In paper [3], the writers count the trends of IPS which are accuracy signature, the traffic volume, topology design, quota usage logging, protecting intrusion prevention system, monitoring sensor, and collaboration of UTM. This paper explains these issues and gives some solutions to minimize these effects; however, the writers don’t statistically reason these trends and only give a summery about these problems. In this paper, we focus on traffic volume and logging issue and examine them in IPS.
In paper [1], the writers analyze the strengths and weaknesses of different types of IDS. They introduce four metrics for their comparison which are false positive, false negative, true positive and true negative. These metrics evaluate the accuracy of detection engine module in IPS but we focus on number of packets that IPS captures but can’t be analyzed because of resource limitation. They also didn’t consider the complexity of the environment and the overload of network traffic in their experiment.
There is a good survey on [7] which categorized intrusion detection systems based on data source, processing, time of detection, environment, reaction and alert. The architecture of intrusion detection system is perfectly explained in this paper which we use as the basic understanding for IPS modules.
All of these above articles didn’t consider the effect of network traffic on performance of IPS in identifying attacks.
The main contribution of this paper is to analyze the performance of IPS in controlled environment base on network traffic. In the next section, we explain the tools which we use in this experiment.
3. Approach
We want to scrutinize the effect of network traffic on IPS performance. To evaluate IPS performance, we use an attacker in our network. IPS should detect this attacker and prevent it from disturbing the network; here we focus on attacks to a web server. Then we generate network traffic to see if the performance of IPS in detection of attack will change. We consider two types of traffic, normal traffic and provocative traffic. Normal traffic doesn’t trigger any IPS rules as an attack; however, provocative traffic triggers one of IPS rules and IPS alert this traffic as an attack. Our hypothesis is as follow:
1) Normal traffic doesn’t have an effect in detection of attacker in the network;
2) Provocative traffic will exhaust IPS resources and decrease the performance of IPS in detection of attacker in the network.
Before we continue to the evaluation part; we should determine the tools which we are using in our approach. We need to choose an intrusion prevention system, network traffic generation tool and network attack type and the specification of our network environment.
3.1. IPS Choice
In this paper, we focus on centralized network intrusion prevention system. We choose Snort for IPS in this experiment because it is lightweight, open source network intrusion detection-prevention system [8]. Snort modules are shown in Figure 1.
We use WinCap library for capturing the network traffic. Preprocessor module has several plug-ins that can be turned on or off. They perform a variety of transformations, makes the data easier for Snort to digest such as session management, detect abnormality, http inspecting [8]. In this experiment, we use Stream5, Frag3, sfPortScan, performance monitor, http inspect plug-ins. Detection engine of Snort takes information from the packet decoder and preprocessor modules and operates on it at the transport and application layer, comparing the packet to its rule-based database .When a rule is triggered, an alert is generated and logged. Snort logging module supports a variety of output plug-ins, including text, database and csv formats [9].We use output plugin in text format, storing alerts in files on hard disk. We use Snort 2.9 on windows server 2003 SP2. The default rule database is used in this experiment. Snort also is configured to be used in IPS mode.
3.2. Network Traffic Generation Tools
In our approach to examine the effect of network traffic on IPS performance, we need a controlled environment; therefore we need a way to control the network traffic in our test environment. There are two general approaches for traffic generation. The first approach is to capture traffic from some usual network and then reply it in our test network. The second approach is to generate the network traffic. In this paper, we use D-ITG (Distributed Internet Traffic Generator) which is capable of generating network traffic at packet level. The main components of D-ITG are: 1) Internet Traffic Generator Sender (ITGSender); 2) Internet Traffic Generator Receiver (ITG-Recv); 3) Internet Traffic Generator Log Server (ITG-Log); 4) ITG Send Manager (ITGManager) [10-11].
We use only ITG-Send, for sending generated traffic, and ITG-Recv, for receiving generated traffic. ITG-Send generates multiple flows of data which every flow has its own manager thread and can be configured separately.
3.3. Network Attack Type
In this paper, we use DOS attack, which tries to slow down or completely shut down the web server denying the legitimate and authorized users to access it. There are a number of different kinds of DOS attack such as flaw exploitation DOS attack, flooding DOS attack, and penetration attack; here we use flooding DOS attack.
In flooding attack, an attacker simply sends more requests to a target than it can handle. Such attacks can either exhaust the processing capability of the target or exhaust the network bandwidth of the target, either way leading to a denial of service to other users. This attack is one of the most common attacks nowadays and this is the reason why we choose the flooding DOS attack.
In this experiment, we develop a web site on IIS 6.0 in windows server 2003 SP2. In flooding attack to the website, we create multiple concurrent connection and exhaust web server processing capability and unable it to service to other users.
3.4. Network Environment
Our network environment contains five elements consist of a web server, the victim of flooding DOS attack, an attacker, performs flooding DOS attack, an intrusion prevention server, a D-ITS Send, which is the sender of generated traffics, a D-ITS Recv, which is the receiver of generated traffics. Each of these components are deployed on separate PC, you can see the hardware configuration of these PCs on Table 1.
Our network architecture is a traditional LAN, where an attacker, access the web server through IPS. Range of internal network IP is 192.168.1.0/24 and range of external network IP is 192.168.2.0/24.
4. Evaluation
Our approach to evaluate the performance of IPS contains four phases, in each of them; we declare the purpose of the phase, Accomplishment and conclusion of it. Before we continue to the phases, we must define our evaluation method.
4.1. IPS Evaluation Criteria
In previous works done on IPS, some metric such as true negative, true positive, false negative and false positive has been introduced for IPS evaluation. These metrics point out to the correctness or incorrectness of IPS’s decision in identifying of attacks, however, in addition to these factors, we care about the percentage of packets that IPS will analyze whether IPS will identify the attacks or not.
The limitation in IPS is its resources such as CPU, memory, etc. In this paper, we use analyze rate -ARas determined in (1). AR determines the relation between number of packets that detection engine module analyze and number of packets that sensor module capture. If IPS can’t analyze the packets, the probability of happening attack without IPS knowledge will increase, therefore lower AR points to lower IPS performance.
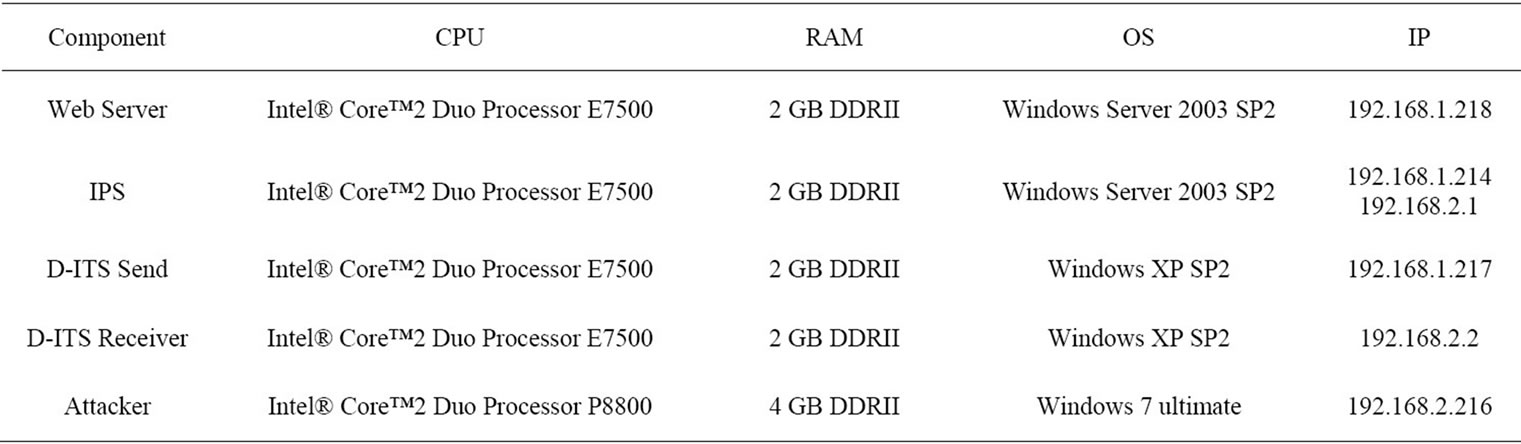
Table 1. Hardware configuration of PCS.
 (1)
(1)
4.2. Deployment of an Attack on a Web Server
In this phase, we only deploy an attacker and a web server which connected through direct link, without IPS Interface as shown in Figure 2.
Purpose: To examine flooding DOS attack and how it will affect the web server performance. We measure the performance of the web server based on http request lost which returns http response code 408 (http request timeout).
Accomplishment: In this phase, we attack the web server with flooding DOS from attacker. We use concurrent connections to send http request to the web server. We change the concurrent connection to see the performance change in http request lost. The data that acquired during this phase has been summarized in Table 2 and Figure 3.
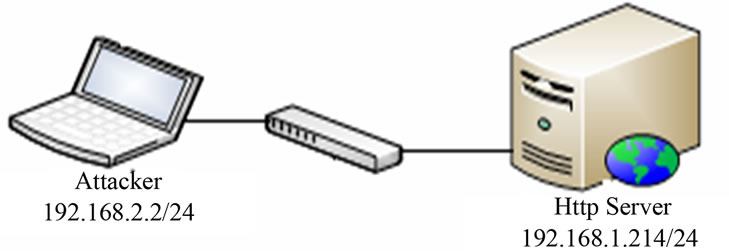
Figure 2. Network test scenario of phase I consists of an attacker and a web server.
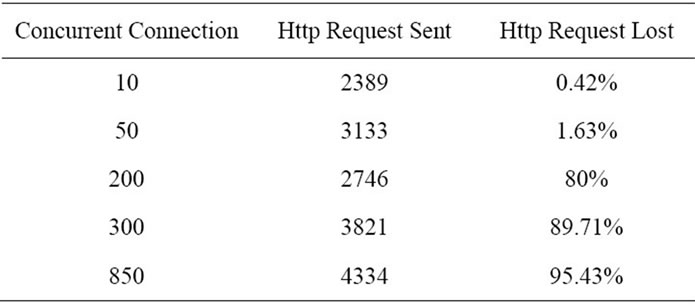
Table 2. Result of phase I.
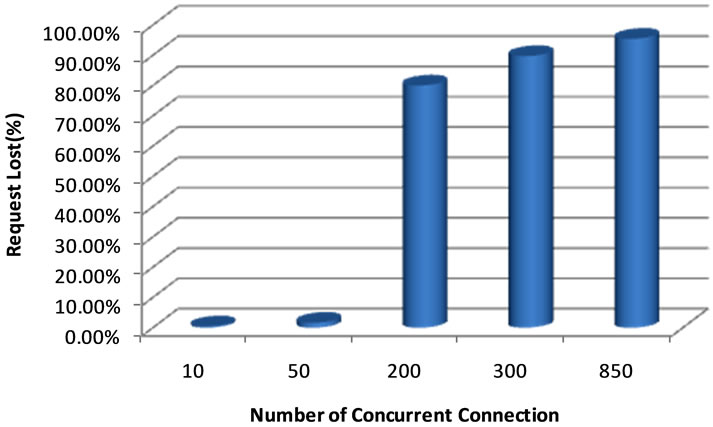
Figure 3. Results of Phase I.
Conclusion: In this phase, we’ve performed flooding DOS attack that result in process exhaustion of the web server. As the number of concurrent connection increased, the more resources of web server have been used to respond to requests until the web server resources have been used completely, after this point, we’ve see that the http request lost increased tremendously. As you can see in the results, flooding DOS attack is successful in disturbing the web server. For other phases of this paper, we choose 200 concurrent connections that result in 80% request lost, in this situation the web server is completely down and we can say that the DOS flooding attack is successful.
4.3. Phase II: Deployment of IPS
In this phase, we deploy Snort as IPS in addition to the web server and attacker as shown in Figure 4. The communication and connection of the web server and attacker is through the IPS.
Purpose: To examine the efficiency of IPS in detection and prevention of flooding DOS attack.
Accomplishment: In this phase, we perform flooding DOS attack to the web Server with 200 concurrent connections. Snort detects and prevents this attack and the analyze rate is equal to 98%. You can see the alert record which has been generate for flood DOS attack as Potentially Bad Traffic in Figure 5.
Conclusion: When snort has deployed as IPS in network, snort has identified flooding DOS attack with AR = 98%. This shows the normal performance of IPS without presence of any traffic. In the following phases, we generate traffics to see how it affects IPS performance and analyze rate.
4.4. Deployment of Network Traffic Generation
In this phase, we deploy network traffic generation tool, D-ITS Send, D-ITS Recv and IPS as shown in Figure 6.
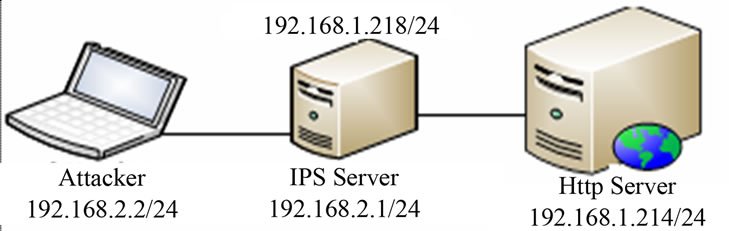
Figure 4. Network test scenario of Phase II, consists of attacker and web server and IPS.
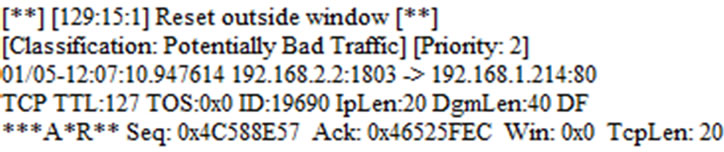
Figure 5. The alert record in snort for detection of flooding DOS attack as potentially bad traffic.
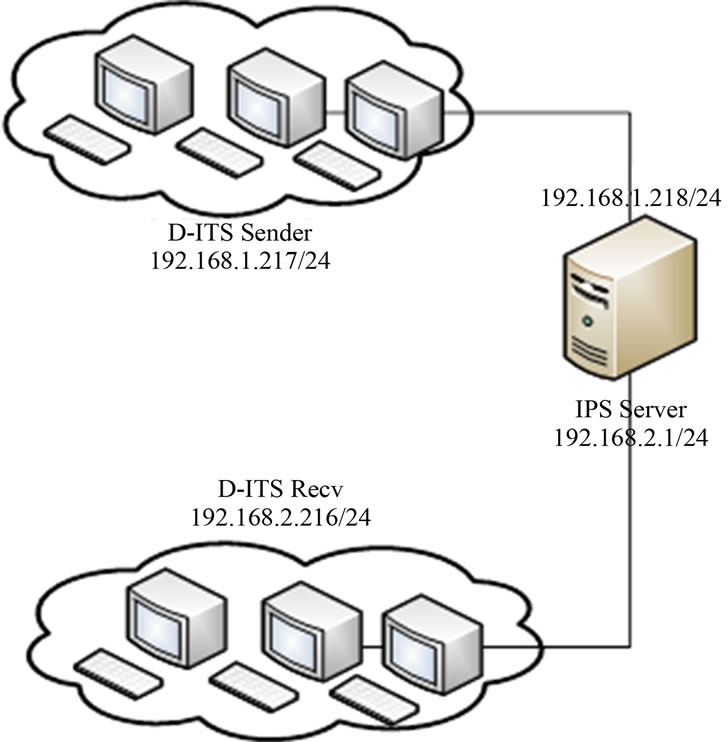
Figure 6. Network test scenario of Phase III, consists of IPS and network traffic generation tools.
Purpose: This is the main phase of our experiment. In this phase, we examine the effect of network traffic on analyze rate of IPS. In this paper, we consider two types of traffic, normal traffic, provocative Traffic. Normal traffic doesn’t provoke any IPS rules as an attack, however, provocative traffic triggers one of IPS rules and IPS alert this traffic as an attack.
Accomplishment: We want to examine the effect of normal traffic and provocative traffic on IPS. For normal traffic, we generate UDP packet which doesn’t provoke any Snort rules; we use one flow of data between D-ITS Send and D-ITS Recv. We increase the packet per second, run the traffic for 30 second and then calculate AR according to Equation (1). Based on our bandwidth limit, we increase the rate of packet per second to 140,000. The analyze rate of IPS report remains at 100% according the reports in Snort. (The report shows equality between number of packets captured and number of packets analyzed).
For provocative traffic, we use packet ICMP with type echo reply. Alert that Snort generates for this traffic is shown in Figure 7.
To compare these two traffics, we use two flows of data between D-ITS Send and D-ITS Recv. One contains UDP packet (normal traffic) and the other contains ICMP packet (provocative traffic). We change packet per second rate of provocative traffic to examine the effect of provocative traffic on snort. The data that acquired during this phase has been summarized in Table 3 and Figure 8. In each stage, we generate traffic for 30 seconds and then we calculate analyze rate of Snort.
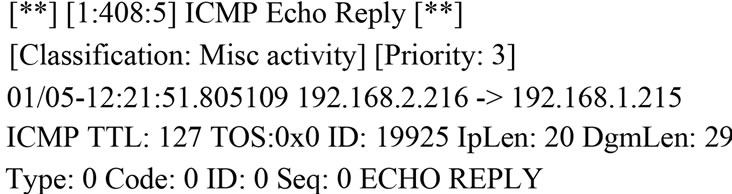
Figure 7. The alert record in Snort for Provocative traffic.
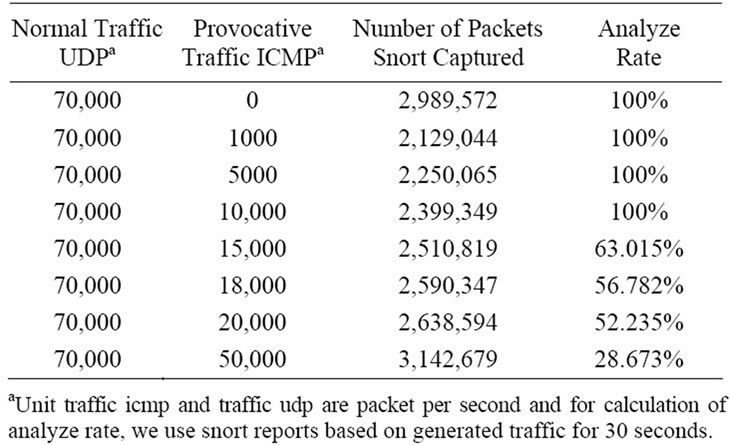
Table 3. Result of phase III.
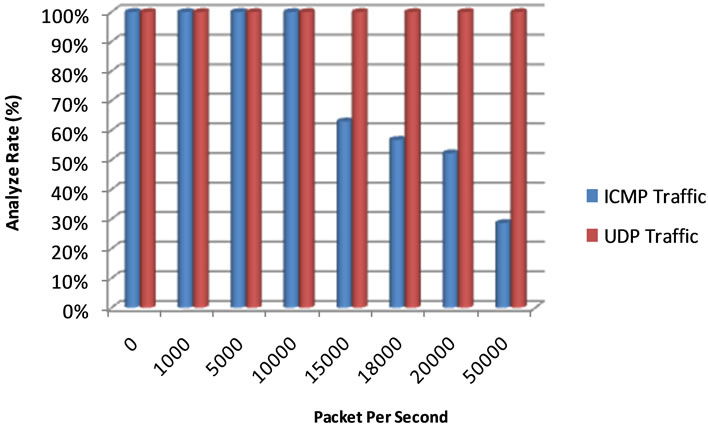
Figure 8. Difference between ICMP and UDP traffic.
Conclusion: In this phase, we’ve examined the effect of network traffic on IPS analyze rate. In normal traffic, IPS analyze rate didn’t change noticeably, but if we combine normal traffic with provocative, we face the reduction of analyze rate. As mentioned in previous sections, there is a direct relation between analyze rate reduction and reduction of IPS performance. The main reason for reduction of analyze rate was a large amounts of alerts that has been generated for provocative traffic, for example with ICMP rate 20,000 packet per second , for 30 seconds, 700 MB alerts have been generated which consumed IPS resources.
In the next phase, we examine the effect of analyze rate reduction in detection of attacks by IPS.
4.5. Phase IV: Effect Of Network Traffic on IPS
In this phase, we accumulate all of the previous phases as shown in Figure 9.
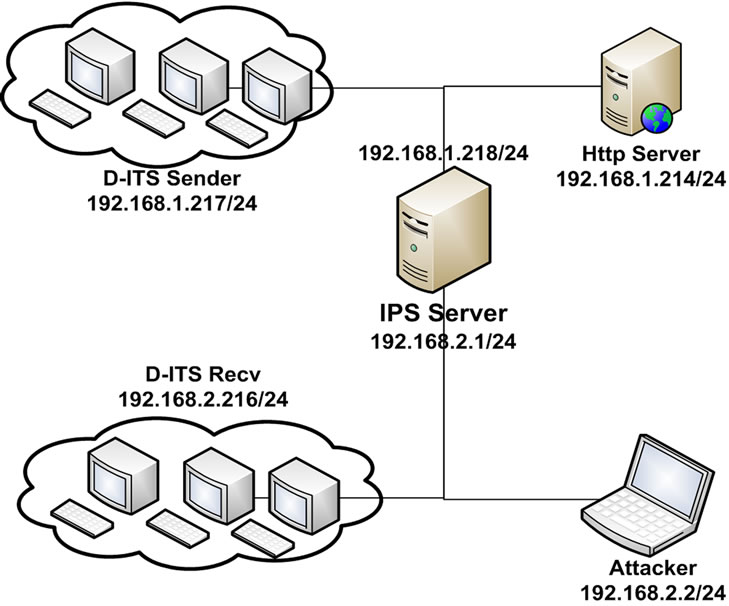
Figure 9. Network test scenario of Phase IV, consists of web server, attacker, IPS and network traffic generation tools.
Purpose: To examine the effect of network traffic on IPS in detection and prevention of flooding DOS attack to the web server. In the previous phase, we face with the reduction of analyze rate in presence of provocative traffic. In this section, we see the result of this reduction in IPS performance.
Accomplishment: As we have seen in Phase II, Snort detects and prevents flooding DOS attack completely without presence of any other traffic. In this phase, while we attack to the web server with 200 concurrent connections; we generate normal and provocative traffic.
For normal traffic, we have used UDP with 70,000 packet per second; Snort has detected and prevented flooding DOS attack with AR = 100%. The results were the same as phase II. This concludes that normal traffic doesn’t have an effect of IPS performance.
For provocative traffic, we have chosen ICMP with 20,000 packets per second from Phase III. By analyzing the alert file of snort, we find out that only 19% of flooding DOS attack was Detected and Prevented by Snort. In this stage, flooding DOS attack has performed successfully on web server in the presence of IPS.
Conclusion: In this phase, we’ve examined the effect of network traffic on detection of flooding DOS attack. Normal traffic didn’t have any effect on IPS performance in detection and prevention of the attack, however, in provocative traffic, Snort couldn’t perform his job in detection and preventing of the attack and efficiency of Snort has been undermined. Overusing of resources in any module in IPS even the alert module could result in the reduction of the analyze rate and IPS performance. Provocative traffic uses this weakness and decreases the performance of IPS by forcing IPS to overuse its logging module and consume its resources completely. As a result, IPS can’t prevent flooding DOS attack from disturbing the web server.
5. Conclusions & Future Work
In this paper, we’ve examined the effect of network traffic on IPS performance. In the previous works that has been done on IPS, metrics such as TP, TN, FP and FN has been introduced for measuring the efficiency of IPS but in this paper, we’ve measured the performance of IPS base on the packets that IPS capture but cannot analyze as a consequence of resource shortage. If intrusion prevention system can’t analyze the network packets, the probability of happening attack, without IPS/IDS awareness, increase and this is a great risk to our network security.
First, we’ve attacked a web server with flooding DOS attack without presence of any traffic, which caused unavailability of the web server, and then we’ve developed Snort as IPS which has detected and prevented flooding DOS attack completely.
Next, we examined the effects of network traffic on analyze rate of IPS by considering two types of traffic, normal and provocative traffic. Normal traffic, which doesn’t trigger any IPS rules, didn’t have any affect in analyze rate and performance of IPS whereas provocative traffic, which triggers IPS rules, reduced the analyze rate of IPS considerably. Provocative traffic decreases the performance of IPS by forcing IPS to overuse its logging module and consume its resources completely. Overusing of resources in any module in IPS even the alert module could result in the reduction of the analyze rate and IPS performance. The analyze rate reduction decreased snort’s functionality in detection and prevention of flooding DOS attack. Although in this paper, we only consider flooding DOS attack, but the result of this experiment can be applied to any attack.
In our future work, we want to improve the analyze rate of IPS by implementing a preprocessor module for Snort which log only the summery of traffic packets and not details of every packets .This will cause the reduction of alerts and effective usage of process and memory in IPS and make sure that no traffic can abuse the alert and logging module.
REFERENCES
- D. Padilla, Y. Colorado and E. Guillen, “Weaknesses and Strengths Analysis over Network-Based Intrusion Detection and Prevention Systems,” Proceedings of the LatinAmerican Conference on Communications of the IEEE LATINCOM 09, Medellin, 11-19 September 2009, pp. 1-5. doi:10.1109/ICSMC.2010.5642331
- M. Beheshti, K. Kowalski, J. Ortiz and J. Tomelden, “Component-Based Software Architecture Design for Network Intrusion Detection and Prevention System,” Proceedings of the 6th International Conference on Information Technology: New Generations (IEEE ITNG 09), Las Vegas, 27-29 April 2009, pp. 248-253. doi:10.1109/ITNG.2009.162
- A. H. Abdullah, M. Y. Idris and D. Stiawan, “The Trends of Intrusion Prevention System Network,” Proceedings of the 2nd International Conference on Education Technology and Computer of the IEEE ICETC, Shanghai, 22-24 June 2010, pp. 217-221. doi:10.1109/ICETC.2010.5529697
- A. Movaghar and F. Sabahi, “Intrusion Detection: A Survey,” Proceedings of the 3rd International Conference on Systems and Networks Communications of the IEEE ICSNC, Sliema, 26-31 October 2008, pp. 23-36. doi:10.1109/ICSNC.2008.44
- P. Wolfe, B. Hayes and C. Scott, “Snort for Dummies,” 1st Edition, Willey, Indianapolis, 2004.
- R. Wagoner, “Performance Testing an Inline Network Intrusion Detection System Using Snort,” Master’s Thesis, Morehead State University, Morehead, 2007.
- S. Kumar, “Survey of Current Network Intrusion Detection Techniques,” 2007, pp. 1-18.
- Z. W. Chen, T. C. Zhou, X. H. Guan and Z. M. Zhou “The Study on Network Intrusion Detection System of Snort,” Proceedings of the 2nd International Conference on Networking and Digital Society of the IEEE ICNDS, Wenzhou, 30-31 May 2010, pp. 194-196. doi:10.1109/ICNDS.2010.5479341
- http://www.snort.org http://www.snort.org/assets/156/snort_manual.pdf http://www.snort.org/assets/156/snort_manual.pdf
- D. Emma, A. Pescapè, G. Ventre and S. Avallone, “A Distributed Multiplatform Architecture for Traffic Generation,” Proceedings of the Symposium on Performance Evaluation of Computer and Telecommunication Systems (SPECTS), Philadelphia, 24-28 July 2004, pp. 659-670.
- A. M. Faizal, et al., “Threshold Verification Technique for Network Intrusion Detection System,” International Journal of Computer Science and Information Security, Vol. 2, No. 1, 2009, pp. 1-8.