Circuits and Systems
Vol. 3 No. 1 (2012) , Article ID: 16663 , 9 pages DOI:10.4236/cs.2012.31012
Switching Optimization for Class-G Audio Amplifiers with Two Power Supplies
1Lyon Institute of Nanotechnology (INL-UMR5270), University of Lyon, Lyon, France
2ST Microelectronics, Grenoble, France
Email: patrice.russo@hotmail.fr, firas.yengui@gmail.com, gael.pillonnet@cpe.fr
Received November 24, 2011; revised December 24, 2011; accepted January 2, 2012
Keywords: Audio Amplifier; Class-G; Hybrid Optimization
ABSTRACT
This paper presents a system-level method to decrease the power consumption of integrated audio Class-G amplifiers for mobile phones by using the same implementation of the level detector, but by changing the parameters of the switching algorithm. This method uses an optimization based on a simplified model simulation to quickly find the best power supply switching strategy in order to decrease the losses of the internal Class-AB amplifier. Using a few relevant equations of Class-G on the electrical level and by reducing the number of calculation points, this model can dramatically reduce the calculation time to allow power consumption evaluation in realistic case conditions compared to the currently available tools. This simplified model also evaluates the audio quality reproduction thanks to a psycho-acoustic method. The model has been validated by comparing model results and practical measurements on two industrial circuits. This proposed model is used by an optimizer based on a genetic algorithm associated with a pattern search algorithm to find the best power supply switching strategy for the internal Class-AB amplifier. The optimization results improve life-time performance by saving at least 25% in power consumption for typical use-case (1 mW) compared to the industrial circuit studied and without losses in audio quality.
1. Introduction
The battery-powered systems, such as mobile phone, PDA and MP3, integrate more and more complex and power-consuming functions: large screen, GPS and audio applications, etc. The IC designers are faced with two main challenges: higher integration and lower power consumption to reduce PCB area and increase battery life. In this work, we focus on a headphone application for cell phones. Indeed, this application uses a large part of the total power consumption of the mobile phone when the consumer is listening the music (when the screen doesn’t work and no other application is running). In the first generation of headphone amplifiers, Class-AB topology was preferred because of its low relative complexity and good audio performance compared to other topologies. However this solution suffers from a limited efficiency given by:
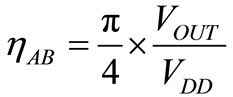 (1)
(1)
where, VDD is the power supply of the Class-AB amplifier and VOUT the RMS audio output voltage. In (1), the quiescent current is considered as negligible. Due to the low RMS voltages of a standard audio signal and the power required by the headphone, the efficiency is only a few percent because of the low ratio between the output signal level and the power supply (VOUT/VDD), and also the quiescent current.
Other solutions could be used for headphone applications, such as switching (Class-D) or hybrid (Class-G, H and K) amplifiers. Recent work proposed Class-D amplifiers for headphone applications [1,2] but they suffer from a higher static current consumption with a DC coupling capacitor and unpredictable electromagnetic interference. The Class-K amplifier also suffers from high consumption [3]. Class-G topology has been proposed to reduce the VOUT/VDD ratio, see (1), by powering the linear amplifier with a dynamic power supply. Reducing the current consumption by a factor of 3 (at average output power) compared to the Class-AB, means there are now alternative solutions in headphone applications [4-8]. Figure 1 shows a Class-G block diagram and an example of power supply variation with a real audio signal. An integrated Class-G amplifier is therefore composed of a dynamic power supply converter associated with a switching power supply algorithm and a linear amplifier.
Present Class-G amplifiers [6-8] use two different power supply rails to decrease the conducted power
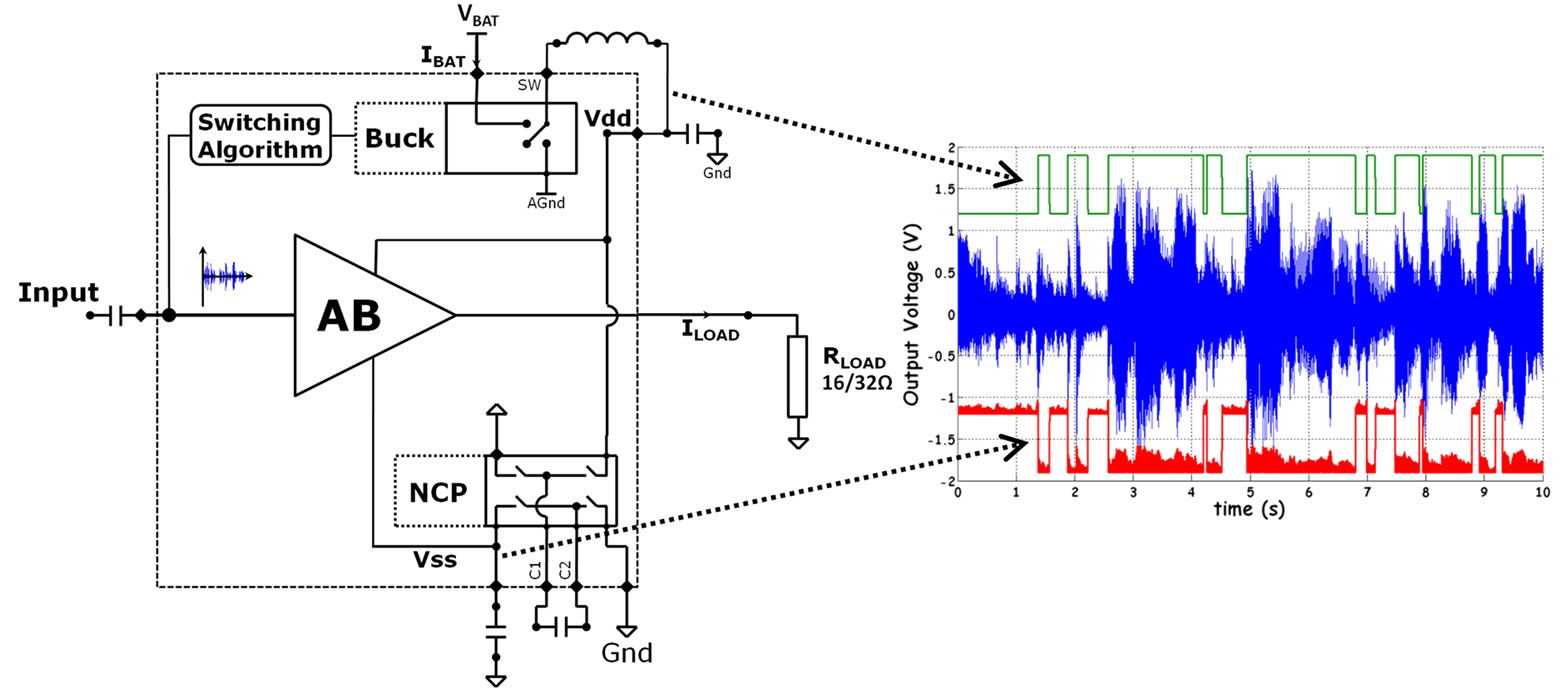
Figure 1. Class-G amplifier with two supplies.
losses (VDD – VOUT)/ILOAD in the linear amplifier, and only a few papers introduce hybrid amplifiers with more than two power supplies [9-11]. Class-G exhibits higher efficiency at low output power where the audio amplifier is widely used. Indeed, average listening power is ten times less than the maximal output power. In addition to their improved efficiency, Class-G amplifiers exhibit a comparable audio quality to classic Class-AB solution [6-8].
Due to the complexity of multi-level Class-G electrical implementation, which could increase the global power consumption, the multi-levels (also called Class-H) are not yet used in industrial applications.
To find the optimal algorithm of power switching, a thorough analysis of amplifier efficiency for many different cases has to be undertaken. Indeed, [10] and [12] present an optimization made by experts in this domain and suggest optimal parameters for the switching algorithm in amplifiers with two or three power supplies. [4], [5] and [13] focus more on optimizing the electrical implementation by proposing solutions on the improvement of consumption and harmonic distortion (i.e. one component of the audio quality).
The objective of this work is therefore to optimize the power consumption that could be achieved with a ClassG with two power supplies for headphone applications by finding the optimal value of several parameters of the level detector. Section 2 is devoted to the modeling of the amplifier. Then, the optimization issues are described in Section 3. The last section discusses model validation and optimization results based on an existing Class-G amplifier.
2. Modelization
2.1. Objectives
Present Class-G amplifiers contain more than a few thousand transistors and therefore require several weeks of simulation with a sinusoidal signal of a few milliseconds. In order to reduce this calculation time and enable the simulation of longer test signals such as music, a fast and accurate model is suggested. As the simulation time is strictly linked to the level of abstraction, as indicated on Figure 2, behavioral modeling enables a good compromise between time and precision of the simulations.
This model must allow post-processing on audio signals (interpolation, and cutting up of sound tracks, etc.), and enable us to evaluate the sound reproduction quality of the audio signal (notably using the PEAQ method, explained in Subsection 2.5). The parameters of our model must also be optimized via different search algorithms (cf. Section 3). We therefore chose a Matlab model using the version R2007a, rendering all these actions possible within the same interface.
2.2. Power Supply Switching Algorithm
The synoptic diagram of the power supply switching algorithm for a class G2 amplifier is presented in Figure 3 and was implemented in our Matlab model.
Depending on the input voltage, the buck converter provides two different power supplies as shown in Figure 1. If the output voltage exceeds the upper threshold , then the higher supply is applied with a given rise time (Figure 4). Then, when the input audio signal falls under the lower threshold
 , the lower supply is selected after a time, called the decay time. A parameter called the attack time was included in the model. This parameter is a delay between the time when the music is above to
 , and the time when the lower supply starts to move to the upper supply. The fall time depends on the discharge of the capacitor of the Negative Charge Pump (NCP) and the buck converter. All these
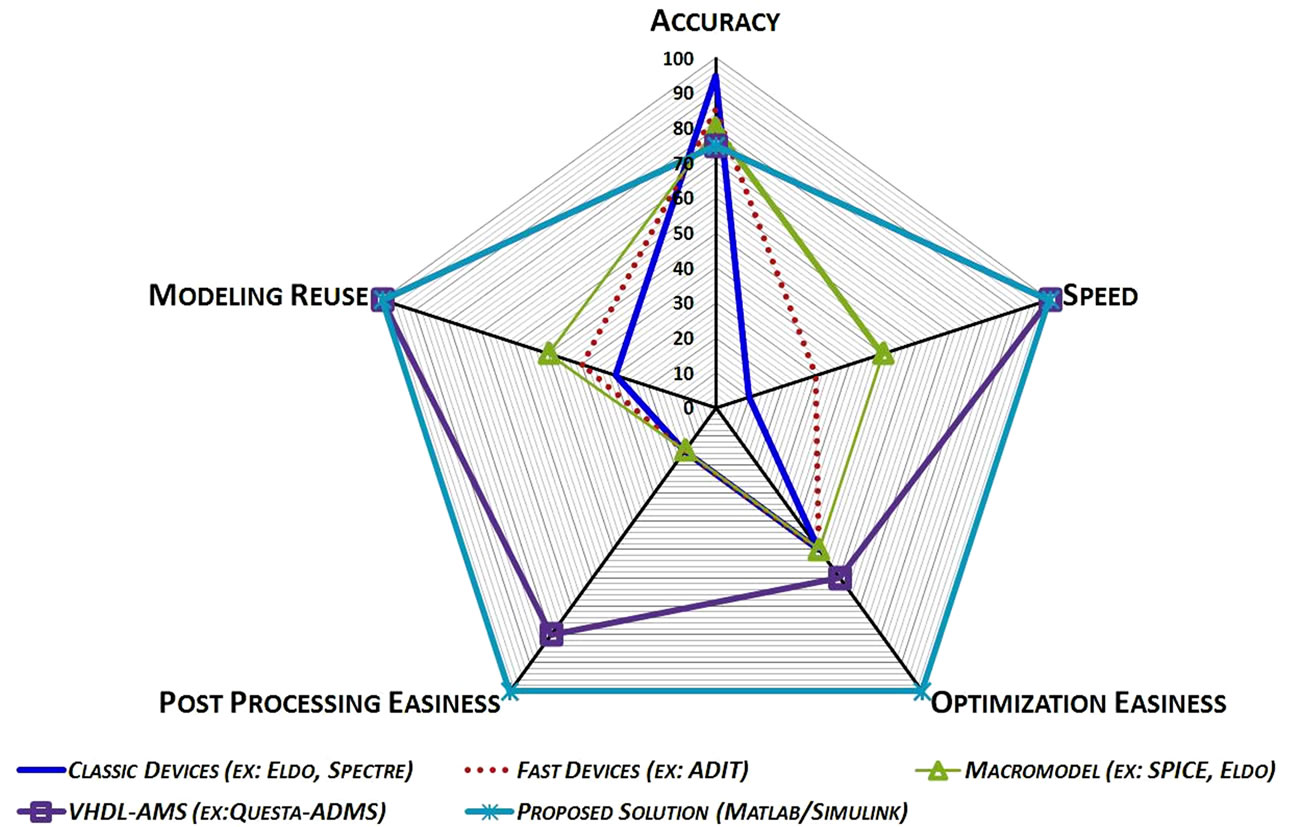
Figure 2. Modeling comparison.

Figure 3. Algorithm synoptic.
parameters are taken into account in our proposed model.
2.3. Modeling of the Power Converters and the Linear Amplifier
In order to only study the leverage of the switching algorithm, only the transient parameters that influence the consumption and the audio quality are finely modeled. Therefore, the linear amplifier is modeled as having a fixed gain, and its linearity, its noise and immunity to the power supply are considered ideal. Regarding the power converters, the buck is modeled with an ideal line and load transient, but its efficiency is 80% (like the current available buck) [6]. The NCP is also considered ideal (no losses RON in MOS switches) but its equivalent resistor (REQ = 5 Ω) is modeled since it’s a contributor to the
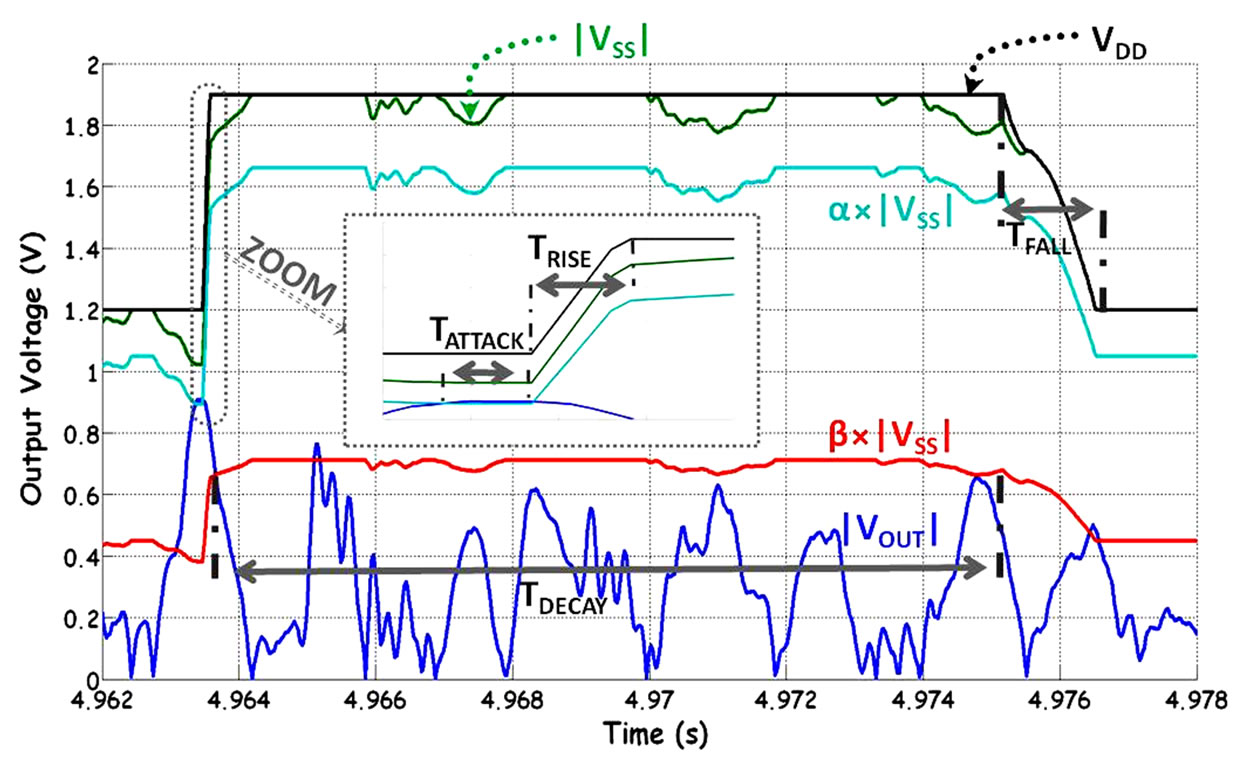
Figure 4. Switching algorithm.
clipping of the signal in transient analysis.
The buck converter and the NCP can be linearized and modeled by simplified equations while keeping a good accuracy to predict the total current consumption. The equation of the consumption, in a two mono-channel configuration can be expressed by:
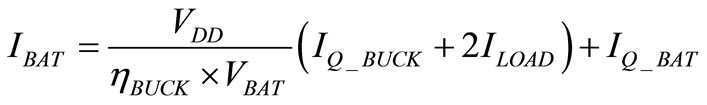 (2)
(2)
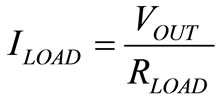 (3)
(3)
where, IBAT is the supply current, ILOAD the load current,  the quiescent current of the buck converter, ηBUCK the buck converter efficiency, and
  the quiescent current on the battery.
The effects of the switch on the DC/DC converter (fSW = 750 kHz) are negligible for the prediction of the consumption of the amplifier. This averaged behavior implies a reduction in the number of calculation points. In our model, the time step is 22 μs which corresponds to the inverse of the sampling rate of our audio test signal (44.1 kHz), instead of a few ns in electrical simulators.
2.4. Choice of Input Signals
Using a realistic audio test signal instead of a pure sine wave is essential because the behavior of Class-G amplifiers is quite different. Indeed, for a sine wave at 1 kHz with a crest factor of 3 dB (the ratio between VPEAK and VRMS), there is no switch down for a decay time greater than 100 µs (when the output power leads the power supply to switch). However, the audio signal leads the amplifier to switch up and down (Figure 3). The behavior of our model is thus working in realistic conditions, contrary to a simulator at transistor level which would require too long a calculation time if a real audio wave was used. The study takes into account that the consumer can listen to several kinds of music (jazz, rap and techno, etc.), which have a typical crest factor between 5 and 20 [14]. Based on this principle, three signals with different crest factors were chosen. Choosing three test signals allow a faster simulation and a best convergence in optimization, while providing a representative sample of the main cases in order to optimize our model. In addition to these test signals (n°1, 2 and 3), two other test signals are used in section 4 to prove the robustness of the optimization (n°4 and 5). Table 1 summarizes the input signals used in this paper.
Figure 5 shows the current consumption for the previous test signals, and then shows the actual amplifier switch for an output power above 3 mW for a crest factor under 10 dB. Typical uses of the audio amplifier for headphone required low output power (until 100 µW and 1 mW) which means that the current amplifier is oversized. This figure also highlights the fact that the switch-

Table 1. Signal used for test.
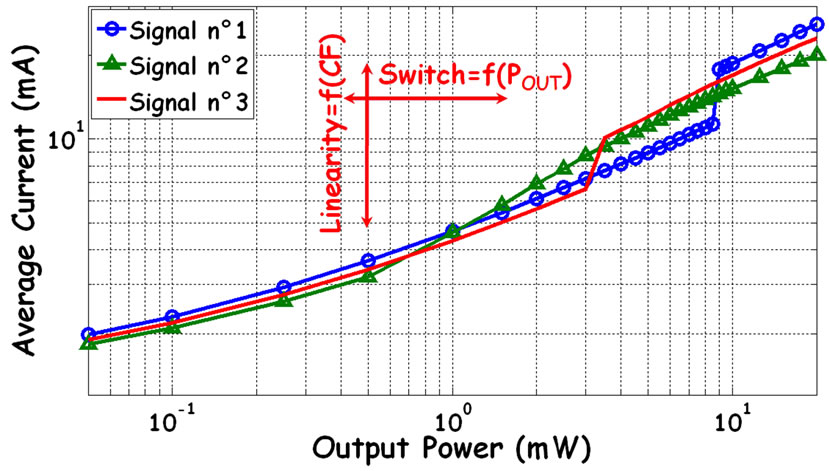
Figure 5. Current consumption for different test signals.
ing of the power supply of Class-G amplifier is dependent on the crest factor.
2.5. Evaluation of Audio Quality
Audio quality is as important as the reduction in power consumption. The model makes it possible to use the objective method to evaluate the audio quality, because Total Harmonic Distortion (THD) could only be used with a pure sine wave. For an objective method, the Perceptual Evaluation of Audio Quality (PEAQ) was chosen. This standard uses a number of psycho-acoustic measurements which are combined to give a measure of the quality difference between the reference and post-processing signal [15]. The method then returns to an ODG (Objective Difference Grade) value between 0 and –4 which reflects the impairment heard by human ears. The value 0 means than the difference is imperceptible and value –4 means than the difference is very annoying for the listener. To complete this method, listening tests (subjective method) were performed.
3. Optimization Approach
The aim of this section is to present our optimization approach to find the best strategy to switch the two power supplies of the Class-G audio amplifier. This is done in order to reach an optimal current consumption without losing audio quality, and at the same time independent of the input signals. This approach consisted in solving, numerically, design problems while respecting the limitation due to circuit constraints and specifications. Two factors require special attention when such a problem is analyzed, namely, the problem formulation and the search algorithm.
3.1. Problem Formulation
3.1.1. Design Variable
Ten parameters are defined: battery voltage, load, two power supply voltages, and six switching parameters (rise, fall, attack and decay times, α and β). We will optimize five design variables (degrees of freedom): , decay time, attack time, α and β. Moreover the range of
  is limited by the IC design constraint topology and the output power selected is 1mW, even if other output power is considered.
3.1.2. Objective Function
The problem consists in minimizing supply current consumption for all three selected audio input signals. Despite the multi-objective approach, we study as a monoobjective problem using the aggregation approach [16]. It is one of the most often used methods for generation of Pareto optimal solutions. Our optimization algorithms allow us to minimize the objective function expressed as:
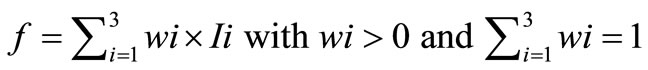 (4)
(4)
where, Ii represents the supply current consumption for each input signal, i Î [1, 3] the number of the objective and wi the weighting coefficient. In our case, wi = 1 because no preference between each objective is made.
3.1.3. Constraints
Constraints are conditions that must be satisfied in order to find a feasible design. Inequality constraints are used: each of the three ODGs has to be above -0.5 with the three input signals.
3.2. Optimization Algorithm
Once the problem has been formulated, we must choose the best optimization algorithm that allows us to minimize the objective function under the constraints. The Genetic Algorithm (GA) is one of the most popular and robust algorithms. It is based on natural genetic and natural selection mechanisms and some fundamental ideas are borrowed from genetics in order to artificially construct an optimization procedure. The GA acts over a population of potential solutions, applying intensification (crossover) and diversification (mutation) operators to explore the problem space. The fittest individuals are selected and give birth to a new population in the hope of improving the solution quality. More details on the mechanism of GAs can be found in [17]. GA is useful for a global search solution. However it is very slow and poor in a localized search. The direct search algorithm, Pattern Search (PS), on the contrary, is often able to find local optima for constrained optimization problems, but it cannot guarantee that the solution is the global optimum of the problem. It ensures computational robustness when it starts from a feasible initial solution [18]. By combining GA with PS, an algorithm referred to as the GA-PS hybrid algorithm is formulated in this paper. In other words, the GA looks at the whole solution space to obtain a quasi-optimal solution. Then, the PS is used to increase the quality and speed of convergence to the optimal solution.
3.3. Cascade Simulation-Based Optimization
To optimize the Class-G amplifiers for different types of input signal simultaneously, we use a multiple simulation-based optimization to find the optimal solution with respect to the three audio signals. Figure 6 presents the concept of our approach.
For each iteration of the optimization loop, a simulation of our model, presented in Section 2, was performed for each audio input signal to find the performance such as current consumption IBAT and the quality factor ODG.
4. Results
4.1. Model Validation
An existing circuit [6] was modeled with our proposed method (Section 2). Several measurements on [6] have been done to find the input parameters of the simplified electrical equations given in Equation (3) and to find the switching algorithm (α, β, etc).
In Figure 7, the measurement test bench is presented and allows us to compare the current found by the measurement of [6] and our proposed model. The setup configuration is a 47 Ω load, 3.6 V power supply and signal n°2. The error is less than 5% over all the output power range. Other input signals gave the same results. The comparison was also made with other existing Class-G [6] and it showed that the error is less than 10% with the same conditions. These results confirm that the Class-G amplifier model gives a reliable current consumption and can be used by the optimizer.
4.2. Optimizer Algorithm Comparison
For our application, we compared three algorithm optimizations to show the effectiveness of the proposed hybrid GA-PS algorithm. GA-PS is compared to GA and another hybrid algorithm GA-SQP, which is based on a GA coupled with the local search algorithm: Sequential Quadratic Programming (SQP). The optimization algorithms used in this study are part of the MATLAB optimization toolbox. In Table 2, we compared the output power of 1mW with signal 1, 2 and 3. The objective function is the mean of the consumption for these three input signals. The best result is obtained using a GA-PS optimization, in terms of minimizing the objective function while keeping an acceptable time of optimization. We therefore used this solution in order to reduce the consumption of our amplifier.
Indeed, over 100 000 simulations would be necessary with an exhaustive search. Moreover, extrapolating the results of a GA-PS optimization with a model using a transistor and macro-model would require 134 years to

Figure 6. Cascade simulation-based optimization.
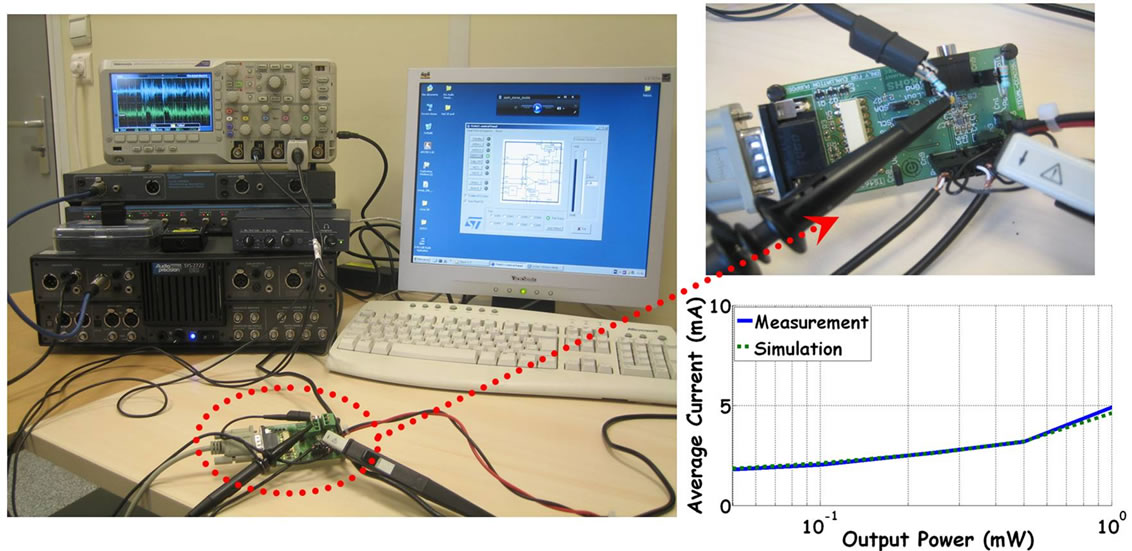
Figure 7. Comparison between [6] and our model.
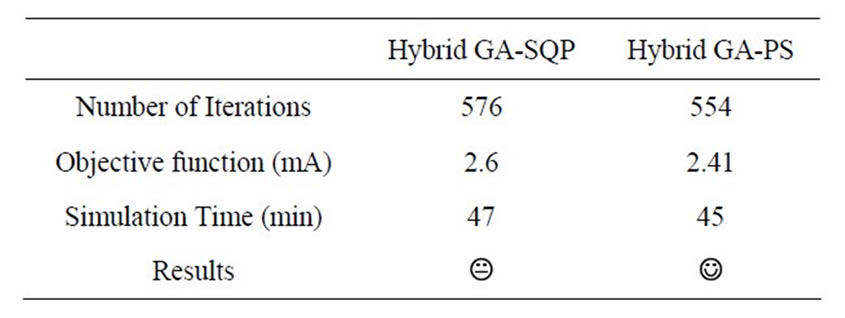
Table 2. Algorithm comparison.
find an optimal solution, since a single simulation with an audio signal during ten seconds takes three months.
4.3. Optimization Results
At the moment, the minimum supply voltage of a ClassG amplifier is 1.2 V [6]. However, because of the real power needed in general, we made an optimization allowing the constraint  to be above 700 mV (which is the actual limit for the power amplifier) in order to see the leverage of optimization by tuning
  while keeping the other constraints as before. The test signal used is signal 4. It is used to perform the optimization in order to prove the robustness of the proposed optimization. The results shown in Figure 8 presents the gain obtained compared to [6] from 20 µW until 20 mW and highlight the need to lower the supply voltage of the power amplifier, since this reduction reduces the consumption for low power without degrading the consumption at high power. Moreover, the algorithm used in this optimization always respects the condition for the audio quality. Figure 7 also shows that the gains in consumption start to reduce after 2 mW for
  > 1.2 V and 5 mW for
  > 0.7 V. This result is explained by the facts that highest is the output power, lower are the switches of the amplifiers until the blocking of the upper supply.
We can note that for a Class-G amplifier with two power supplies, the reduction of  under 700 mV is not justified. Indeed, the optimization performed did not show a reduction in consumption.
This conclusion leads us to perform the optimization with constraints  above 700 mV, as shown in

Figure 8. Current consumption vs. VDD_LOW for signal n°4.
Table 3. Here, we present the results for one music used for the optimization (signal n°2) and two signals not used for the optimization (signal n°4 and 5), to prove the robustness of the proposed optimization.
It can be noted that the results presented in Table 3 do not reduce the audio quality compared to the initial configuration of [6], which means that the ODG is always above –0.5. The results found by the optimizer are summarized in Table 4 and compared to two industrial circuits [6,7]. These parameters are not directly found in the datasheet but are obtained using reverse engineering on their test board. This table shows that the parameters of current industrial circuits are oversized. The threshold voltage can be placed closer to the supply voltage, the decay time has to be reduced and the lowest power supply should be minimized even if the highest power supply is at 1.9 V. However, like the industrial circuits [6,7], the attack time is not reliable to gain in consumption without deteriorate the audio quality. But this parameter has to be tried for Class-G with more than two power supplies in order to see if the results could be better. Indeed, all the parameters present in Table 4 can’t be applied for Class-G with more than two power supplies.
Figure 9 shows the gain in the current consumption from 20 µW to 5mW between the initial configuration from [6] and the optimization. 18% at 100 µW and at least 25% at 1 mW are saved with an optimal configuration of the switching power supply algorithm. Even the two signals not used for the optimization give a gain in con-
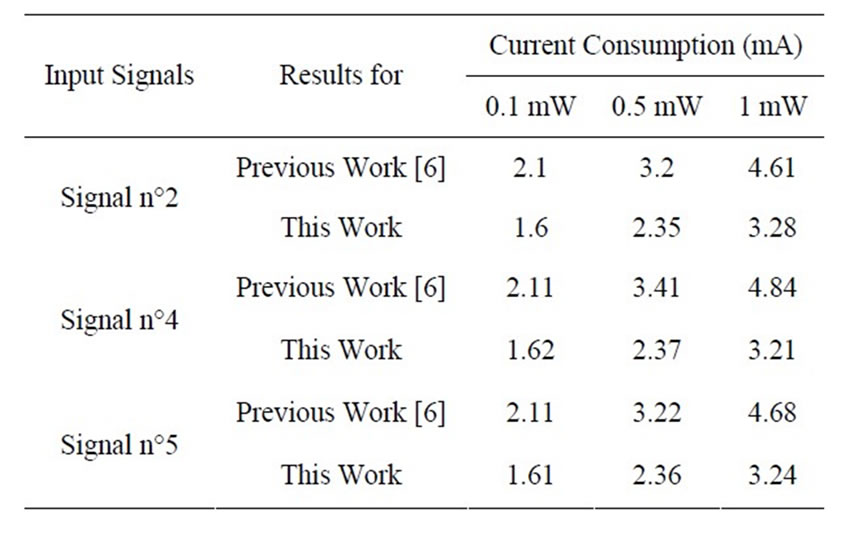
Table 3. Comparison for different class-G amplifiers.
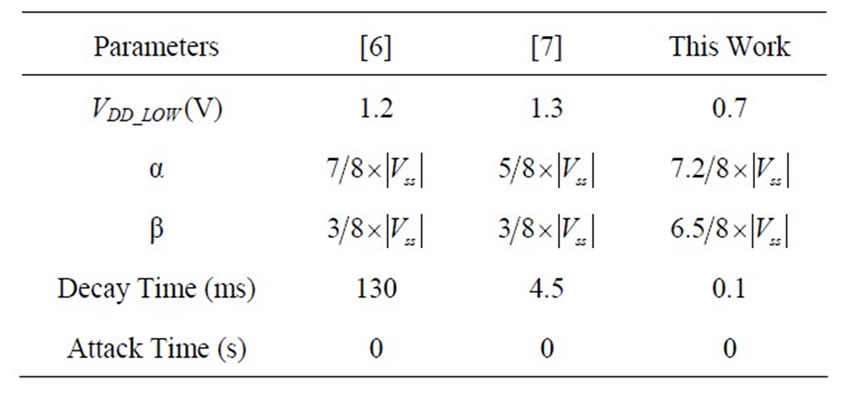
Table 4. Value of the optimized parameters.
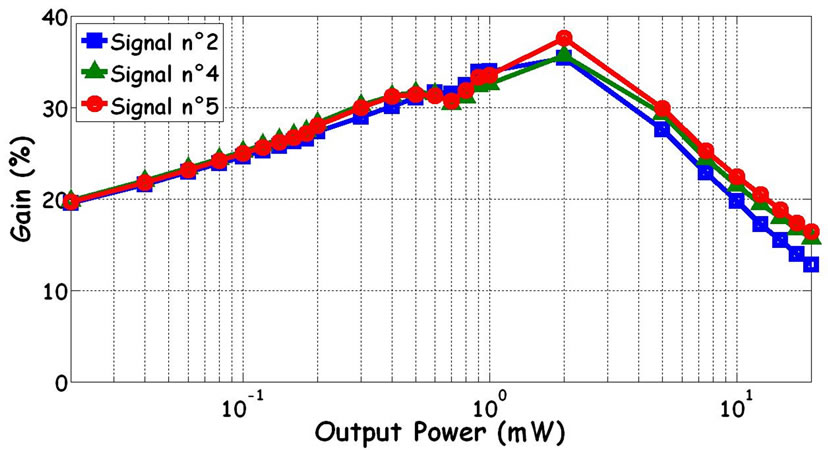
Figure 9. Gain in current consumption because of optimization.
sumption at low and nominal power. Like previously, for high power, they are few switch of the amplifier and the gain start to decrease after 2 mW. It is well to remember that the same level detector than [6] is used (based on logic gates and comparator which are few consuming).
5. Conclusion
In this paper, an original equation-based model has been introduced and associated with a hybrid optimization algorithm in order to reduce the current consumption of audio Class-G amplifiers by choosing the best parameters of the power supply switching algorithm. The proposed model has been validated. It also saves simulation time to predict the power consumption and keeps audio quality with various input signals. The optimizer coupled to this model allows us to find the best power supply switching strategy for a Class-G amplifier with two supplies by giving the optimal value of the parameters ( , α, β, decay time and attack time). At least 25% of power consumption can be saved by optimizing the switching algorithm compared to an existing Class-G circuit with the same electrical implementation. In addition, the model is robust for operating conditions since the optimization was done for multiple input signals without loss of audio quality thanks to the PEAQ method. In future work, this approach will be used with Class-G amplifiers with more than two-power supplies, in order to optimize on all the range of power.
6. Acknowledgements
The authors gratefully acknowledge the standard linear division of ST Microelectronics for their valuable technical help.
REFERENCES
- K. Kang, J. Roh, Y. Choi, H. Roh, H. Nam and S. Lee, “Class-D Audio Amplifier Using 1-bit Fourth-Order Delta-Sigma Modulation,” IEEE Transaction on Circuits and Systems II, Vol. 55, No. 8, 2008, pp. 728-732. doi:10.1109/TCSII.2008.922457
- G. Pillonnet, N. Abouchi, R. Cellier and A. Nagari, “A 0.01% THD, 70 dB PSRR Single Ended Class D Using Variable Hysteresis Control For Headphone Amplifiers,” IEEE International Symposium on Circuits and Systems, Taipei, 24-27 May 2009, pp. 1181-1184. doi:10.1109/NEWCAS.2010.5603759
- E. Sturtzer, G. Pillonnet, A. Huffenus, N. Abouchi, F. Goutti and V. Rabary, “Improved Class-K Amplifier for Headset Applications,” 8th IEEE International NEWCAS Conference, Montreal, 20-23 June 2010, pp. 185-188. doi:10.1109/NEWCAS.2010.5603759
- A. Lollio, G. Bollati and R. Castello, “A Class-G Headphone Amplifier in 65 nm CMOS Technology,” IEEE Journal of Solid State Circuits, Vol. 45, No. 12, 2010, pp. 2530-2542. doi:10.1109/JSSC.2010.2076450
- A. Downey and G. Wierzba, “A Class-G/FB Audio Amplifier,” IEEE Transactions on Consumer Electronics, Vol. 53, No. 4, 2007, pp. 1537-1545. doi:10.1109/TCE.2007.4429249
- Datasheet ST-M TS4621. http://www.st.com
- Datasheet TI TPA6140. http://www.ti.com
- Datasheet NS LM48824. http://www.national.com
- R. Bortoni, S. N. Filho and R. Seara, “Analysis, Design and Assessment of Class A, B, AB, G and H Audio Power Amplifier Output Stage Based on Matlab® Software,” 110th Audio Engineering Society Conferences, Amsterdam, 12-15 May 2001
- F. H. Raab, “Average Efficiency of Class-G Power Amplifier,” IEEE transaction on Consumer Electronics, Vol. 32, No. 2, 1986, pp. 145-150. doi:10.1109/TCE.1986.290146
- E. Mendenhall, “Computer Aided Design and Analysis of Class B and Class H Power Amplifier Output Stage,” Audio Engineering Society 101st Convention, 1996.
- T. Sampei, S. Ohashi, Y. Ohta and S. Inoue, “Highest Efficiency and Super Quality Audio Amplifier Using MOS Power FETS in Class G Operation,” IEEE Transaction on Consumer Electronics, Vol. CE-24, No. 3, 1978, pp. 300-307. doi:10.1109/TCE.1978.267034
- J. Gubelmann, P. A. Dal Fabro, M. Pastre and M. Kayal, “High-Efficiency Dynamic Supply CMOS Audio Power Amplifier for Low-Power Applications,” Journal of Microelectronics, Vol. 40, No. 8, 2009, pp. 1175-1183. doi:10.1016/j.mejo.2009.03.003
- M. Mijic, D. Masovic, D. Sumarac Pavlovic and M. Petrovic, “Statistical Properties of Music Signals,” Audio Engineering Society 126th Convention, 2009.
- T. Thiede, et al., “PEAQ the ITU Standard for Objective Measurement of Perceived Audio Quality,” Journal of Audio Engineering Society, Vol. 48, No. 1, 2000, pp. 3- 29.
- N. Srinivas and K. Deb, “Multiobjective Optimization Using Nondominated Sorting in Genetic Algorithms,” Journal of Evolutionary Computation, Vol. 2, No. 3, 1994, pp. 221-248. doi:10.1162/evco.1994.2.3.221
- T. El-Ghazali, “Metaheuristics: From Design to Implementation,” Jonh Wiley and Sons Inc., Chichester, 2009.
- R. M. Lewis and V. Torczon, “Pattern Search Algorithms for Bound Constrained Minimization,” Journal SIAM on Optimization, Vol. 9, No. 4, 1999, pp. 1082-1099.