Journal of Modern Physics
Vol.3 No.3(2012), Article ID:18208,8 pages DOI:10.4236/jmp.2012.33040
Modelling of the Phenomenon Known as “the Miracle of the Sun” as the Reflection of Light from Ice Crystals Oscillating Synchronously
Department of Structural Mechanics, Technical University of Lodz, Lodz, Poland
Email: artur.wirowski@p.lodz.pl
Received January 13, 2012; revised February 16, 2012; accepted February 29, 2012
Keywords: The Miracle of the Sun; Atmospheric Phenomenon; Ice Crystals; Vibrations
ABSTRACT
The work includes a mathematical model of the phenomenon seen by the witnesses on 13th October, 1917 in the Cova da Iria near Fatima, and similar phenomena recorded in recent years throughout the world, known as “the miracle of the Sun”, allowing for qualitative and quantitative analysis of the phenomenon. The work includes a mathematical model of a cloud of the vibrating charged ice crystals. The paper shows the dynamic optical effects associated with the passage of light through such a vibrating medium. It also presents the simplest solution to the model in the form of graphs, which have been compared with the graphs obtained from the analysis of the amateur observations of the phenomenon in question.
1. Introduction
1.1. The Observations of “the Miracle of the Sun” in the Twentieth Century
The first modern and well-documented observation of the phenomenon popularly known as “the miracle of the Sun” took place in the Cova da Iria, near Fatima in Portugal on 13th October, 1917 and, according to various sources, was attended by 30 to 100 thousand people. They later described the “strange behaviour” of the Sun: changes of colour and brightness, the effect of spinning and “approaching” them. The whole phenomenon lasted about 10 minutes in a few cycles, and was also seen in the villages lying about a dozen miles from the Cova da Iria [1]
Due to the religious context of the phenomenon, its uniqueness and glamour, and the inconsistency of the witnesses’ descriptions, this event still remains the subject of many discussions and controversy. In subsequent years, similar phenomena were reported in various places in the world [2,3]. However, except for a few works: [3, 4], very little attention was dedicated to them in the scientific literature, the reason of which was probably the religious context of the phenomena The most recent amateur observations made in Medjugorje, Soraca, Parana and other places around the world, widely available on the Internet on YouTube [5-9], seem to be quite interesting in terms of the scientific aspect of the phenomenon. They will be discussed in Chapter 2. The analysis of these observations, in spite of their imperfections and the amateur equipment used to record them, made it possible to compare the results of the physical model obtained in Chapter 4 with experience.
1.2. The Existing Attempts to Explain the Phenomenon
The existing attempts to explain the phenomenon can be classified into two main trends:
1) The attempts to explain the phenomenon as the collective hallucination or long-term effect of looking at the Sun [2];
2) The attempts to explain the phenomenon as the atmospheric effects: refraction or reflection of light on ice crystals in clouds [4,10].
The first stream gives a wrong explanation because of the multiplicity of instances of the phenomenon and its registration by means of various types of video cameras. For the second approach, the authors encountered the fundamental difficulty that the previously described luminous phenomena in the atmosphere, such as halos, rainbows, side suns and the similar ones, were of the static character, which stood in obvious contradiction to the witnesses’ accounts [1].
1.3. The Purpose and the Scope of Work
The aim of the work is to build a simple mathematical model, explaining in the best possible way both the eyewitnesses’ accounts of the phenomenon in the Cova da Iria: [1] and the luminous effects presented on amateur video recordings [5-9].
The work includes the mathematical model (Chapter 3) along with the basic solution (Chapter 4) and their comparison with the amateur observations of the phenomenon of “ the miracle of the Sun” (Chapter 5).
2. The Empirical Analysis of the Phenomenon
2.1. The Quality and the Quantity of the Observations
The paper was based on the amateur observations widely available on the Internet and especially on YouTube. 14 different observations of the analyzed phenomenon were found, out of which five of the best sufficient quality were selected to make qualitative and quantitative analysis of the recorded phenomenon. They are the following phenomena of “the miracle of the Sun”:
1) Soraca (Colombia), April 4, 2009 [5];
2) Medjugorje (Bosnia and Herzegovina), August 2, 2009 [6];
3) Medjugorje (Bosnia and Herzegovina), September 11, 2009 [7];
4) Medjugorje (Bosnia and Herzegovina), October 11, 2010 [8];
5) Parana (Brazil) August 1, 2011 [9].
However, even these films contain certain imperfecttions resulting from the randomness of the amateur recording equipment. In particular, the actual number of the recorded frames per second exerted the greatest impact on the quality of the empirical analysis of the videos (FPS). The FPS rate for the best recordings reached 30. Be-cause the phenomenon was of very dynamic nature with the frequencies of 2 - 5 Hz, a low coefficient of FPS made strobe effect and caused a significant distortion of the recorded phenomenon.
All the films show more or less regular quick flashes of the Sun, the observed changes in its size. The considerable lightening and darkening of the Sun can be observed alternately. On some films, there are also the colour changes, but these observations are of such poor quality that it is impossible to analyze them quantitatively or qualitatively.
Below there is a description of the method used to analyze films and detailed results of the analysis.
2.2. The Selected Graphs of Brightness of the Sun
Some amateur videos with the recorded phenomenon were analyzed by dividing it into individual frames. Then the surface of the solar disc along with the glow was measured for each frame. The unambiguous and unquestionable results were obtained by means of the graphical program, automatically choosing a number of pixels with the brightness greater than a certain threshold brightness. In this way, it was possible to measure the relative observed brightness of the Sun recorded on each frame of the film.
This method of measurement, despite its simplicity works well for qualitative analysis of the flashes and the darkening of the Sun. Unfortunately, it can neither accurately specify the apparent brightness of the Sun in absolute units nor accurately determine the apparent size of the solar disc.
For the purposes of this study a total of 1600 frames of various films were measured. Below there is a selection of graphs obtained for the various observations. The vertical axis shows the relative brightness of the Sun and the horizontal axis-time in seconds.
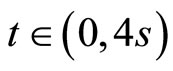
The fragments of observations No. 2 were shown In Figures 1 and 2. The normal brightness of the Sun, before the occurrence of the phenomenon was at the level of 1.0 (Figure 1), after a sequence of vibrations due to the changes of the position of the camera was 0.8 (Figures 1 and 2). Figure 1 shows the full sequence of vibrations—on the film normal sunshine period before and after the phenomenon is visible. In Figure 2 we can only see the middle section—the camera was not turned on since the beginning of the phenomenon.
This observation has the best FPS rate equal to 30. This causes the least distortion of the image vibration. The experiment allows to read not only the period of the vibrations, but also their character.
Note the characteristic elements of the charts, particularly visible in Figure 1. Some vibrations run not only between max and min values, but also with some intermediate phase (Figure 3):
This type of vibration, we call it type B, appears in most observations and provides a very characteristic feature of this phenomenon.
Other videos available for the author have a lower FPS parameter, hence the distortion of the graphs is greater (Figure 4). For this graph the FPS ratio is 15 which combined with the very high frequency of 7.5 Hz results in the large distortion of the graph. It is clear that some of the maximum and minimum values do not find a representation in the graph, but most probably occur.
2.3. The Selected Graphs of Brightness of the Sun
After analyzing the available films the following general conclusions have been reached:
- The phenomenon consists of cyclical darkening and lightening image of the Sun;
- A phenomenon occurs at different heights of the Sun
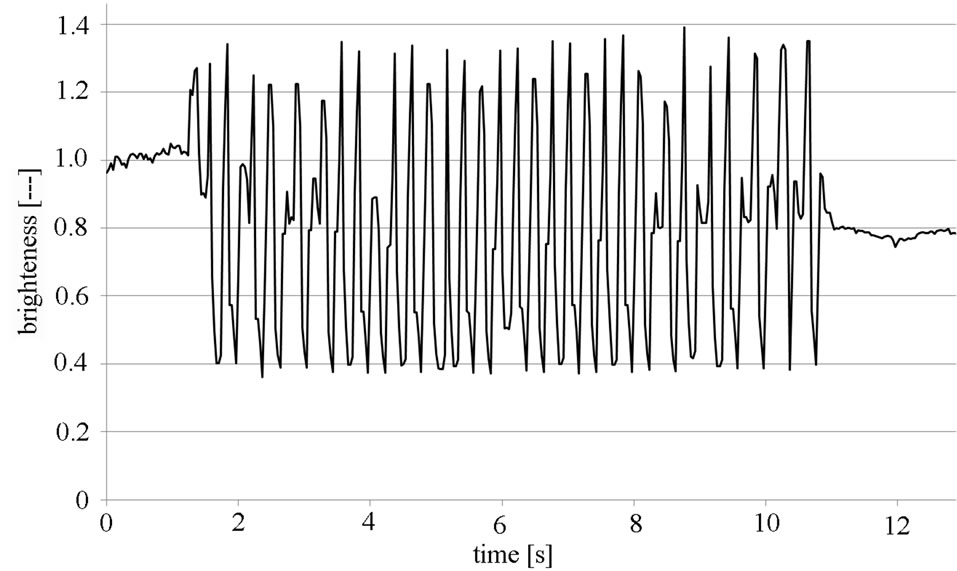
Figure 1. The relative brightness of the sun for observations No. 2. The initial sequence of vibrations.
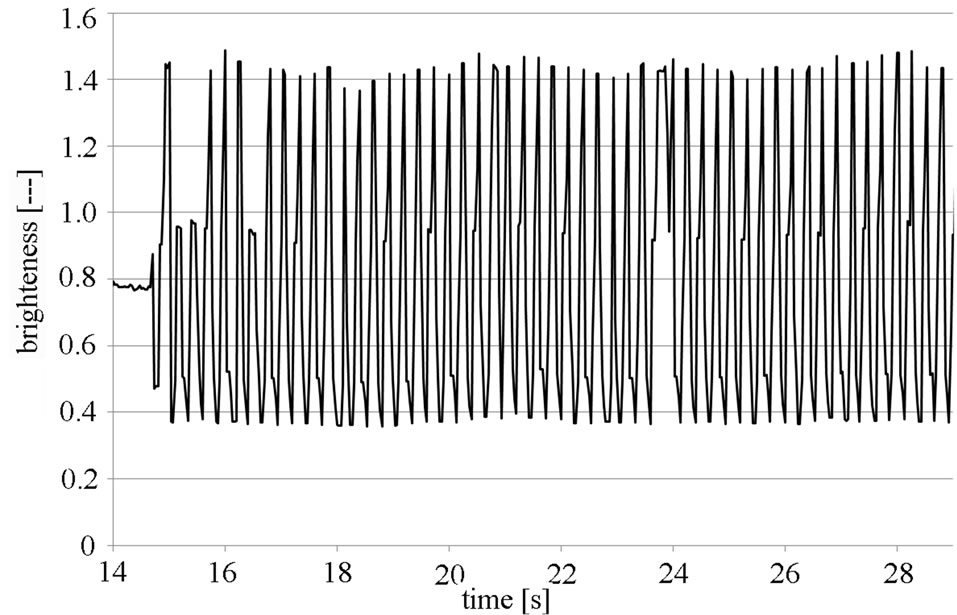
Figure 2. The relative brightness of the sun for observations No. 2. The second sequence of vibrations.
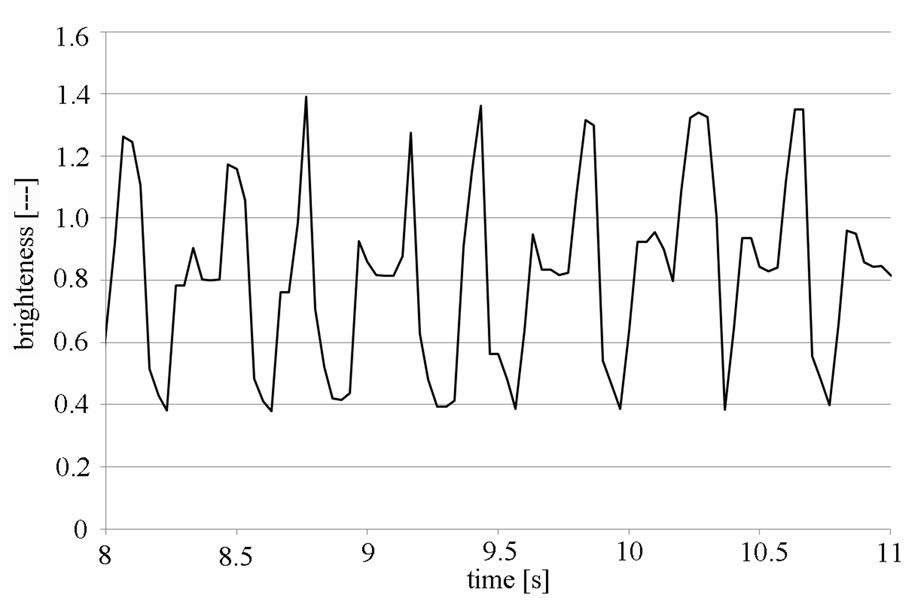
Figure 3. The fragment of the first sequence of vibrations for observations No. 2. Clearly visible oscillation type B (double peak with the intermediate phase), occurring alternately with the basic type A (single peak, with no intermediate phase).
above the horizon, but mostly it was observed at sunset, so for low Sun elevations;
- Proceeds in cycles of varying length from several seconds to several minutes;
- The whole occurrence of the phenomenon usually consists of several cycles. The whole process takes from
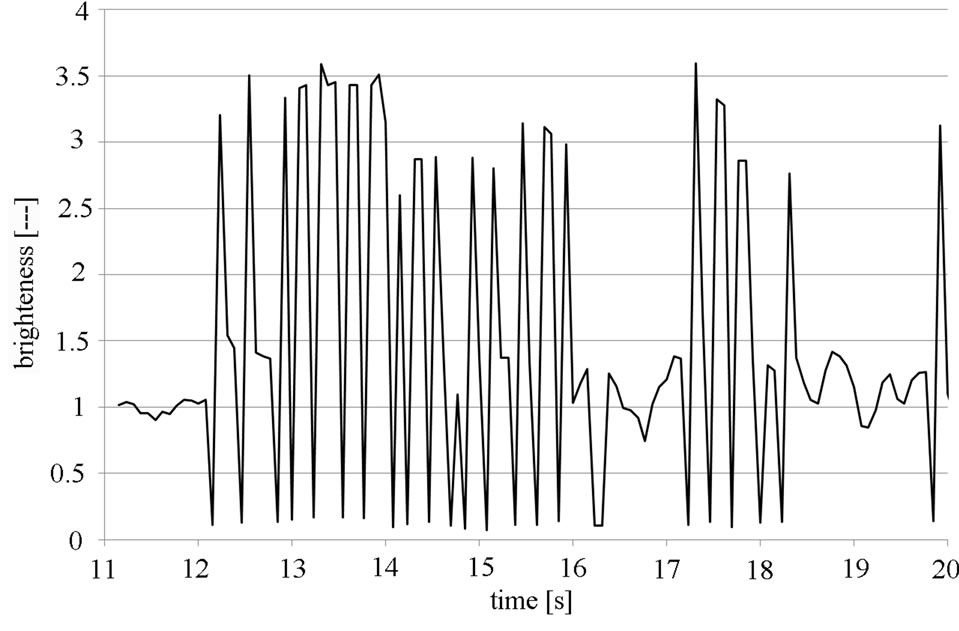
Figure 4. The relative brightness of the sun for observations No. 3. The selected sequence of vibrations.
a few to a dozen or so minutes.
- Inside the cycle the sun vibrations are usually very regular;
- The period of oscillation is different for different observations and ranges from 0.1219 to 0.2665 s;
- The relative amplitude of the vibration is different for different observations, but rather constant within a single film, wherein the degree of darkening of the Sun ranges from 20% to 80% of the normal brightness of the Sun, and the lightening ranges from 150% to 350%.
- After the detailed analysis two types of the vibration can be distinguished:
- Type A, in which the vibrations run exclusively between the maximum and minimum levels for a particular video, having a U-shaped character (middle part of the graph in Figure 3);
- Type B, in which the vibrations run not only between the maximum and minimum values, but also at some intermediate level. Within the cycle then there are two peaks, one of which is greater, the period of vibration of type B is about 1.5 of a period of oscillation (Figure 3);
- Both types of vibration can occur alternately, with the exception that type A is by far the predominant type, occurring much more frequently.
3. Modelling
3.1. Assumptions
These results and observations of the witnesses were inspirations to create a model of the phenomenon known as “the miracle of the Sun”. For purposes of simplifying the model, let us assume the following assumptions:
- A homogeneous cloud of identical, electrically charged ice crystals is given;
- Crystal rotation is the result of their electrostatic interactions;
- The crystals rotate only by small angles relative to the horizontal position;
- We ignore the influence of air resistance on the rotating crystals;
- The difference between the rotation of two adjacent crystals is negligible;
- For simplification the electric charge of a crystal is reduced to 3 charges located at the ends and in the middle of the ice crystal.
3.2. The Equation of the Motion of the Rotary-Elastic Virtual Material
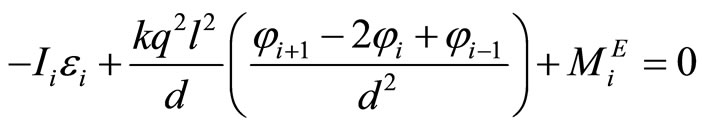
After the adoption of the above assumptions, we present in Figure 5 system of forces acting on the ice crystal. The equation of the rotational movement of the i-th ice crystal shown in Figure 5 can be written as:
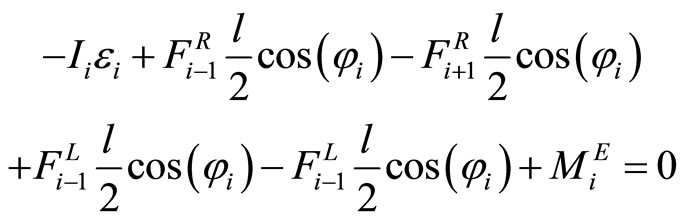 (1)
(1)
where
 —external moment being applied to the ice crystal your local disorder, accounting for dynamic stimulate of vibrations, coming for example from the dynamic impact of wind.
Due to the assumption of small angles of turnover of crystals we can assume that:

and simplify after the transformation Equation (1) to the form:
 (2)
(2)
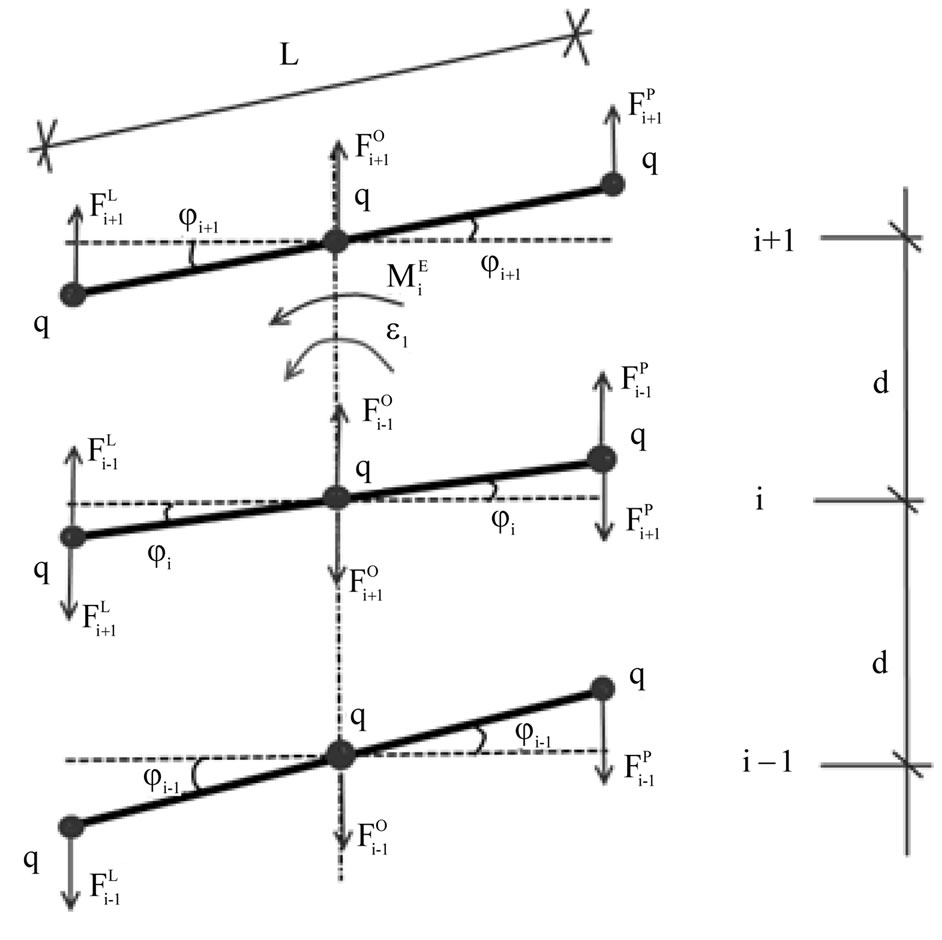
Figure 5. The distribution of forces acting on the i-th ice crystal.
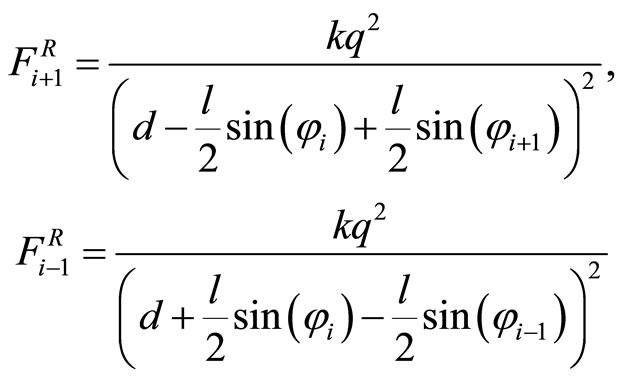
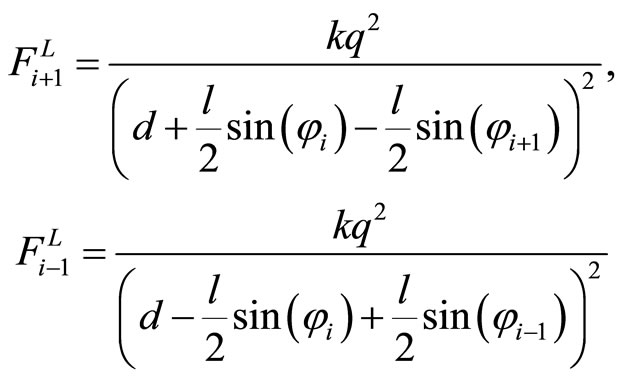
Due to the assumptions we can assume that:
 (3)
(3)
and
 (4)
(4)
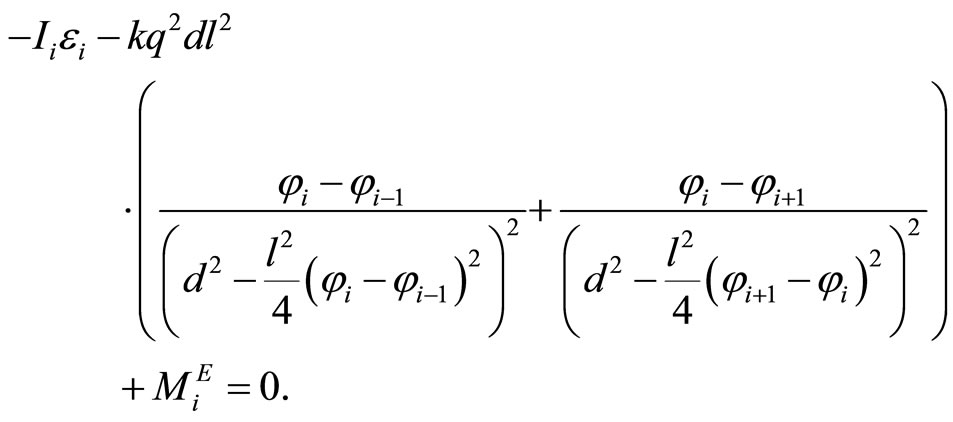
Therefore transforming:
 (5)
(5)
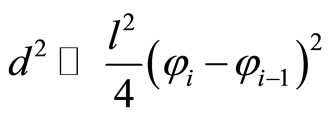
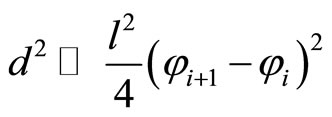
We now introduce a virtual material passing with the amount of crystals to infinity. Passing from discrete to a continuous system we use formulas of the finite difference method:
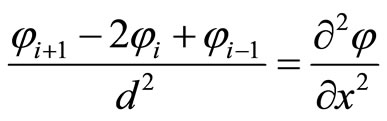 (6)
(6)
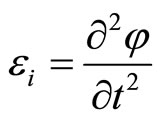 (7)
(7)
 (8)
(8)
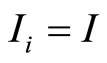
The Ice crystal has the shape of a regular hexagon of side length l/2 and thickness h. The moment of inertia ice crystal’s by the axis of rotation will be:
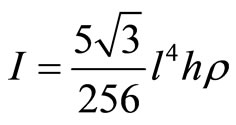 (9)
(9)
where ρ is the density of ice.
The total charge of ice crystal’s is:
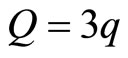 (10)
(10)
Substituting this equation into (5) we obtain the equation of motion of the column of crystals:
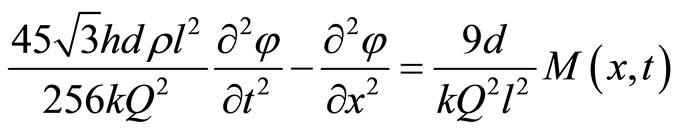 (11)
(11)
Denoting:
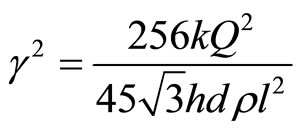 (12)
(12)
and
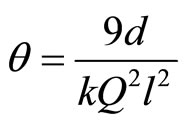 , (13)
we obtain:
 . (14)
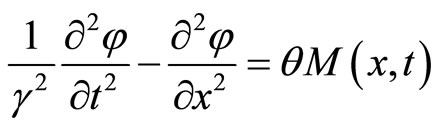
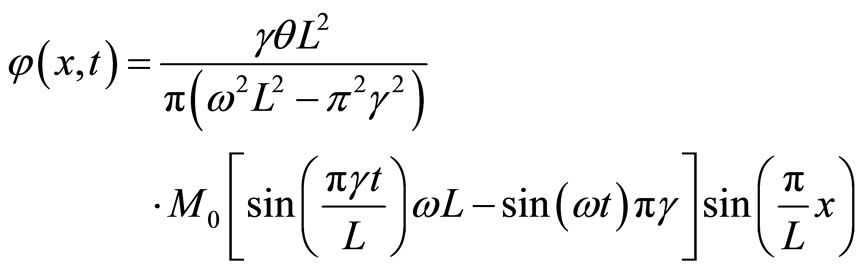
The resulting Equation (14) is the equation of motion virtual rotary-elastic material, and also determines the rotation angle φ of crystal located at a height x in time t.
3.3. Analytical Solution
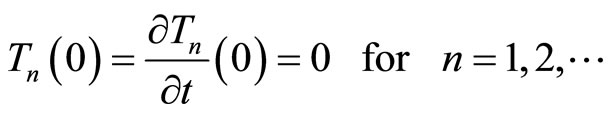
We solve the above equation with the following boundary-initial conditions:
- We assume that at the initial moment all the crystals are arranged horizontally and do not rotate:
 (15)
(15)
 (16)
(16)
- We assume that lower and upper horizontal layer of crystals is horizontal throughout the duration of the phenomenon:
 (17)
(17)
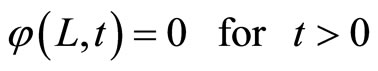 (18)
(18)
where:
- L is the height of the column of vibrating of crystals.
The solution of the differential Equation (14) with the initial-boundary terms (15)-(18) will be given as [11]:
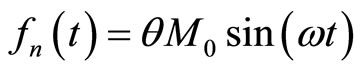
- We assume that the external moment M(x,t) for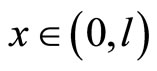 , can be written as a Fourier series in the variable x:
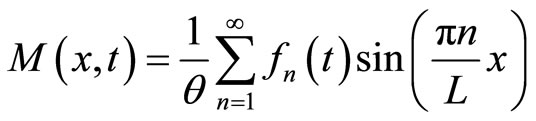 (19)
(19)
where:
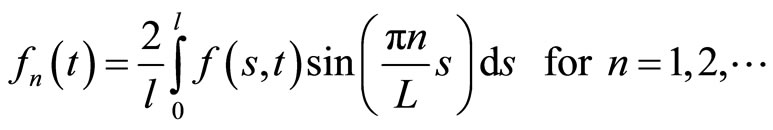 (20)
(20)
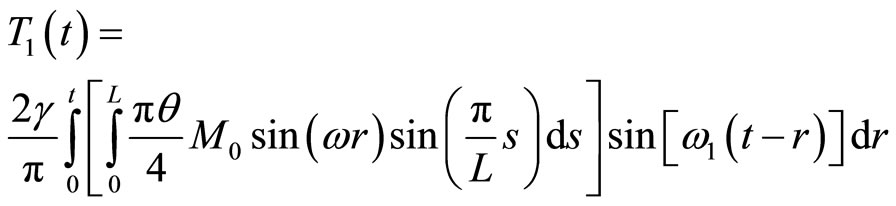
The solution of Equation (12) with the initial-boundary terms (15)-(18) we looking for as:
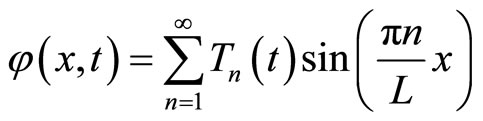 (21)
(21)
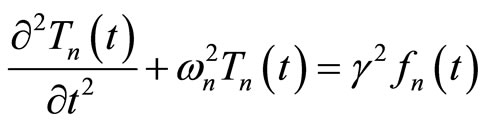
where Tn(t) are unknown functions. Assuming that is allowed differentiation of the series (21) term by term, from equation (14), using (19) we get:
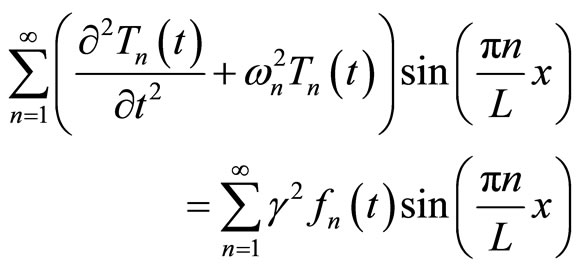 (22)
(22)
and therefore:
 (23)
(23)
where
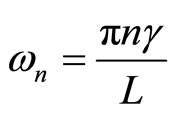 (24)
(24)
From the initial conditions is also clear that:
 (25)
(25)
The solutions of Equation (23) can be represented as:
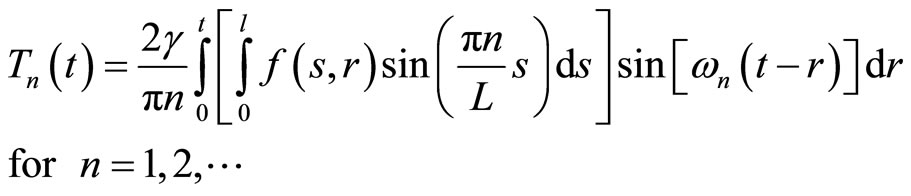 (26)
(26)
Formulas (21) and (26) allow to find a solution to the Equation (14) for any enforces function M(x,t), which can be written using the Fourier series (19) and (20).
3.4. Model of Optics of Phenomena
Now we consider the situation of sun’s rays pass through vibrating medium described by Equation (14). We assume that a cloud of ice crystals is the height of L, the base of a cloud is at a height above the ground x0.
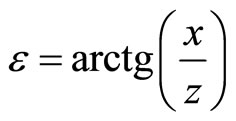
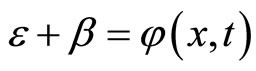
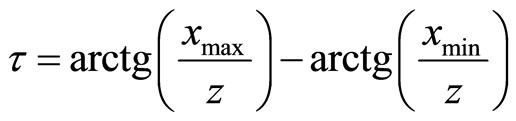
The general condition for existence of phenomena is that the plane of ice crystals on the observer-sun line was at least for a moment parallel to the direction of the sun’s rays (Figure 6):
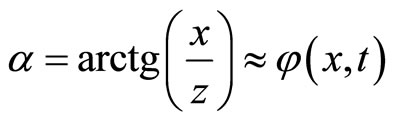 (27)
(27)
where:
z—the distance measured horizontally from the observer to the base of the cloud;
x—the height of the phenomenon.
In this case, when the Equation (27) is satisfied, we have focusing sun’s rays through the cloud of falling of crystals and the maximum apparent brightening of the sun.
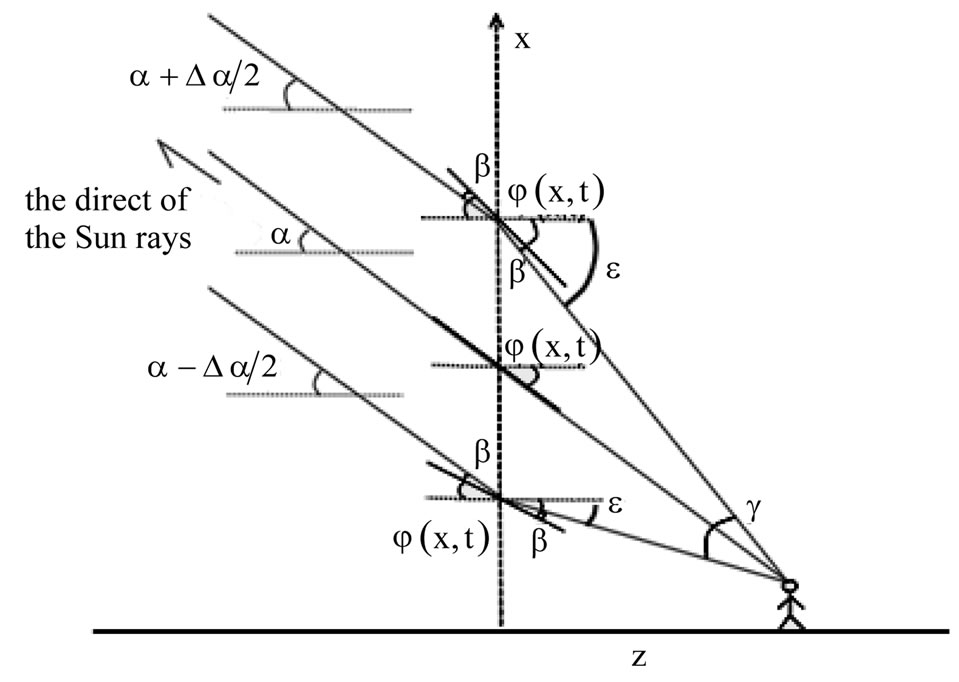
Figure 6. Run extreme sun’s rays reflected from ice crystals and the setting of the middle of crystal conditioning occurrence of the phenomenon. The angles and propotions of the drawing are not retained.
where:
- β is the angle of reflection of ray from of crystal ice;
- is the angle at which the observer looks at the ice crystal;
- α is the height of the sun above the horizon;
- Δ is the angular width of the sun.
The apparent size of the solar disc that we calculate for top and bottom crystal from the situation presented in the figure above (Figure 6):
From the basic law of reflection rays for lower crystal and principles of geometry due to the following equation:
 (28)
(28)
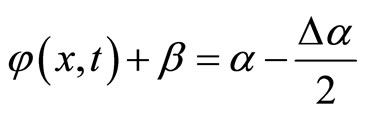 (29)
(29)
Subtracting (28) and (29) we get:
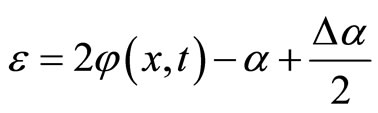 (30)
(30)
Analogously for the upper crystal we can derive:
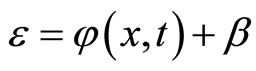 (31)
(31)
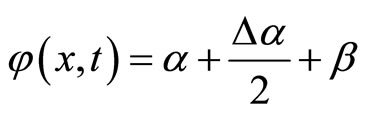 (32)
(32)
and finally after subtracting we get:
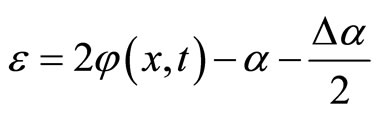 (33)
(33)
Comparing (30) and (33) we can write a general condition that allows to find the apparent size of the solar disc as:
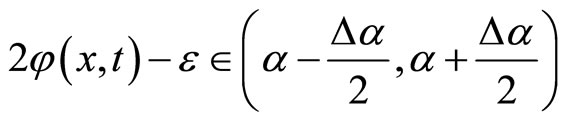 (34)
(34)
With f(x,t) calculated from the relation (21) and (26) we can inequality (34) solved numerically by finding the extreme values of xmin and xmax satisfying it. Finally, the apparent size of the solar disc will be:
 (35)
(35)
The apparent brightness of the sun we can be estimated by the formula:
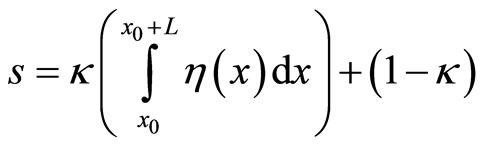 (36)
(36)
where
k—participation is reflected rays relative to the total solar radiation.
h(x)—is a coefficient equal to 1 for x satisfying the inequality (34) and 0 for x not satisfying this inequality.
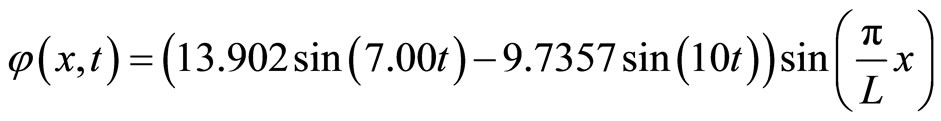
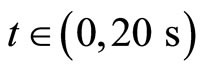
4. Sample Numerical Solutions
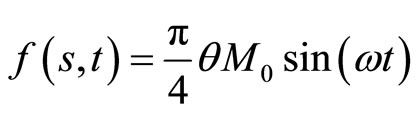
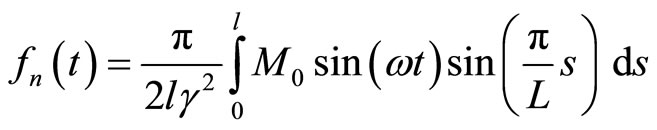
Let us assume that for the stimulation of vibration is responsible the strength character sinusoidal in time and space, so in formula (21) we assume
 (37)
(37)
and
 (38)
(38)
By substituting (37) to (21) we get:
 (39)
(39)
 (40)
(40)
which implies the following form vibration stimulation by an external torque (19):
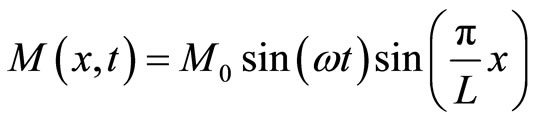 (41)
(41)
By substituting (38) to (26) we get:
 (42)
(42)
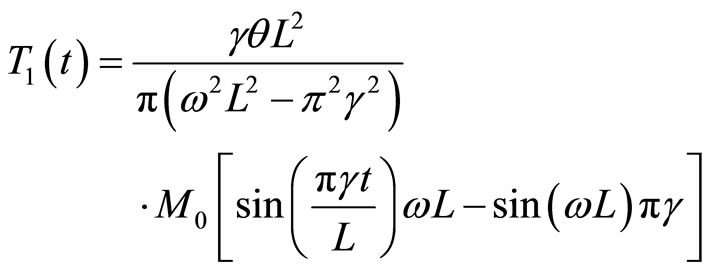 (43)
(43)
By substituting (43) to (22) we obtain the final solution of the Equation (14):
 (44)
(44)
Let us denote the amplitude of vibration as:
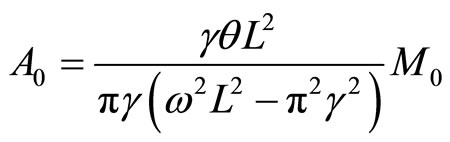 (45)
(45)
Then we obtain the form of solutions:
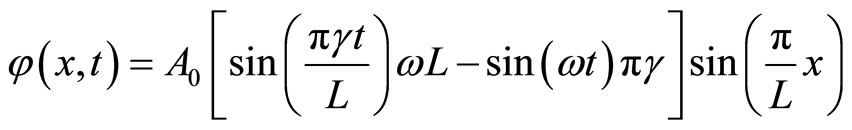 (46)
(46)
Let us assume the following data for microstructure of a cloud (ice crystal size, their location and charge):
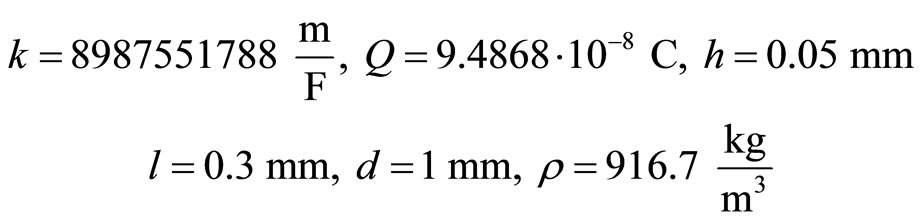
For these parameters from formula (12) we obtain:
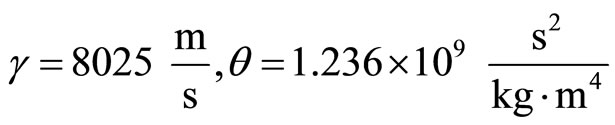
Then we take the sample parameters of macroscopic phenomena:
- Height of the a cloud of crystals: L = 3600 m;
- Forcing frequency: 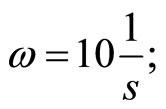
- Moment which forces the vibrations: 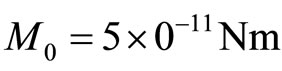
We get oscillation amplitudes from formula (41) which are:
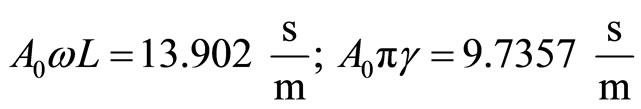
Ultimately deflection angle of crystals is given by:
 (47)
(47)
The condition of a phenomenon is at least temporarily satisfy the condition (27). Let us assume further:
- The height of the sun above the horizon: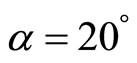 ;
;
- Angular size of the solar disc: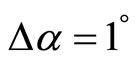 ;
;
- The distance in plan projection from the base of the cloud to observer z = 12000 m;
- Height of a cloud base x0 = 5000 m;
- Participation of reflected rays 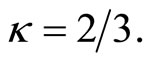
Then numerically checking the condition (34) for:
 with space step 1 m and
 with time step 0.0002 s
we obtain from formula (36) the following observed brightness of the sun diagram as a function of time.
In this case the moment forcing frequency of vibrations: 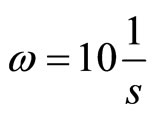 is close to the resonance frequency of the system:
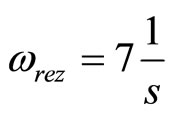 . If the system approaches the resonancethen the graph above compensates out and any disturbances disappear, and the flashes are becoming narrower. Due to the very short lighteness, this solution is very sensitive to the accuracy of the sample over time. Sampling less frequently than those given above 0.0002 s causes cutting maxima and the significant distortion of the chart.
The nature of a solution depends on the parameters adopted by the task. Depending on the adopted parameters of crystals, a cloud as a whole, the mutual position of the sun, the observer and the clouds, we can get a completely different solution. The below is a different solution. The following parameters have changed:
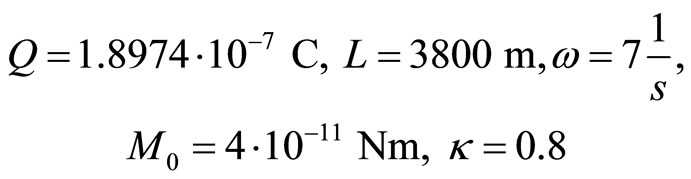
The solution was calculated numerically for:
 with space step 1 m;
 with time step 0.0005 s.
The obtained graph shows the characteristic for the type B phenomena lightness corresponding to Figure 3 In addition to the maximum and minimum level also appears at an intermediate level. These characteristic double flashes occur when the amplitude of rotational vibration of crystals is greater than the height of the sun in the sky. The first peak occurs during trading ice crystal into right (see Figure 6) and satisfy the moment condition (27). Then there is the intermediate phase when the rotation angle of crystal is greater than of height of the sun above the horizon. The second peak occurs during crystal return to the equilibrium position, when again by the moment condition (27) is satisfied.
5. Analysis and Conclusions
5.1. A Comparison Empirical and Theoretical Graphs
When comparing theoretical graphs obtained for the model (Figures 7 and 8) with graphs derived from the observation (Figures 1-3) we can see that they have a similar character. Achieving greater similarities between the charts those from a particular observation, and the theoretical model derived from of appropriate parameters need to match the theoretical model, in particular:
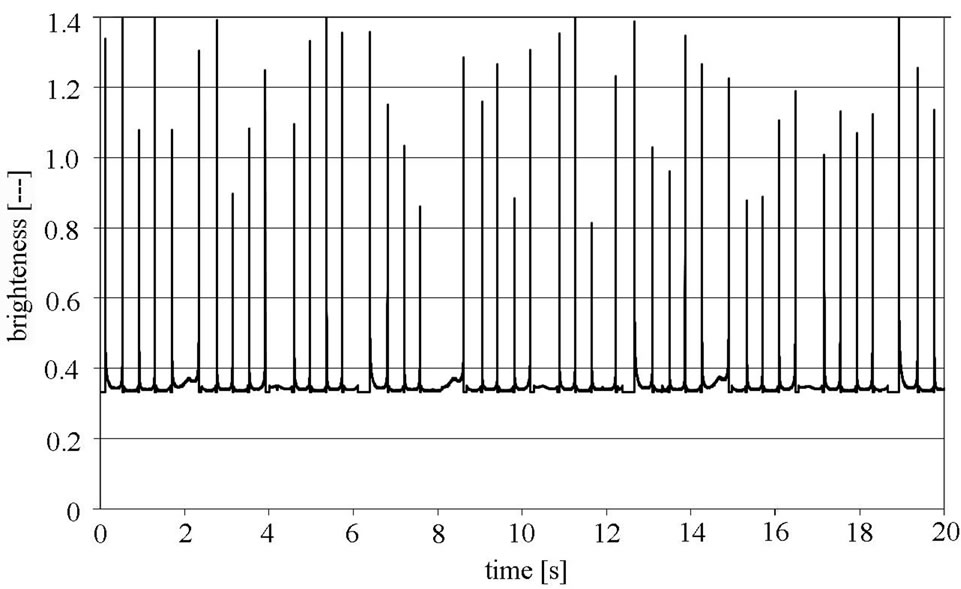
Figure 7. The theoretical solution of model for the sample parameters.
Figure 8. Chart of brightness of the sun for the changed parameters.
- κ parameter determining the share of reflected rays in relation to all rays falling;
- Vibration excitation functions—in the presented model assumed a single sine function;
- Forcing the period of oscillation;
- Forcing amplitude, which determines the type of vibrations and the width of the “flash” and others. This will be the subject of further research the author.
5.2. Conclusions
Presented a model in the right way explaining the phenomenon of “miracle of the sun”, while allowing for the its modelling. The presented solution is only the first, the simplest of possible outcomes. Nevertheless, the model explains the formation of dynamic changes in brightness of the sun, both lightness and darkness, seen locally—as it was described by witnesses of phenomena [1]. Also explains the differences in the testimony of witnesses who stood in places even slightly separated by a few hundred meters away, could see a little “other” phenomenon, the effect of other parameters of the local vibrating clouds of ice crystals.
Occurrence of phenomena it is possible for any of height of the sun above the horizon, except that the sun is below the fulfilment of the condition (27) is easier, and thus the phenomenon is more likely.
5.3. Further Research Plans
This model is a first attempt at quantitative description of the phenomenon of “miracle of the sun”. The intent of author is to continue the research presented by creating a better and more accurate model, describing the experience better. It is also possible to consider not only the phenomena of reflection, but also break lights, which are described by witnesses as the changing colours of the sun.
The author also plans to do as far as possible first professional observations of this rare phenomenon.
REFERENCES
- J. De Marchi, “The Immaculate Heart,” Farrar, Straus and Young, New York, 1952.
- A. Meessen, “Apparitions and Miracles of the Sun,” International Forum in Porto “Science, Religion and Conscience”, Porto, 23-25 October 2003, pp. 199-222.
- M. Hope-Ross, S. Travers, D. Mooney, “Solar Retinopathy Following Religious Rituals,” British Journal of Ophthalmology, Vo. 72, No. 12, 1988, pp. 931-934.
- S. Campbell, “The Miracle of the Sun at Fátima,” Journal of Meteorology, Vol. 14, No. 142, 1989.
- Amateur Film of the Phenomenon of “Miracle of the Sun”, Soraca (Columbia), 4 April 2009. http://www.youtube.com/watch?v=oszQcCmUe3U
- Amateur Film of the Phenomenon of “Miracle of the Sun”, Medjugorje (Bosnia and Herzegovina), 8 February 2009. http://www.youtube.com/watch?v=Eg2UMzCIcPM
- Amateur Film of the Phenomenon of “Miracle of the Sun”, Medjugorje (Bosnia and Herzegovina), 9 September 2009. http://www.youtube.com/watch?v=udfZjF0yL-8
- Amateur Film of the Phenomenon of “Miracle of the Sun”, Medjugorje (Bosnia and Herzegovina), 5 October 2010. http://www.youtube.com/watch?v=-K8K5GFWFME
- Amateur Film of the Phenomenon of “Miracle of the Sun”, Parana (Brazil), 1 August 2011. http://www.youtube.com/watch?v=p6jQlzmfnNA
- P. Simons, “Weather Secrets of Miracle at Fátima,” The Times, 17 February 2005.
- M. Majchrowski and J. Wąsowski, “Partial Differential Equations and Their Applications”. http://alpha.mini.pw.edu.pl/~mm/konw/index.html