Applied Mathematics
Vol.5 No.15(2014), Article
ID:48645,15
pages
DOI:10.4236/am.2014.515222
Nonlinear Computational Model of Biological Cell Proliferation and Nutrient Delivery in a Bioreactor
Muhammad Shakeel1, Sahar Raza2
1Department of Mathematics, Air University, Islamababd, Pakistan
2Department of Mathematics, Balauchistan University of Information Technology, Engineering and Management Sciences, Quetta, Pakistan
Email: apshakeel2004@yahoo.com
Copyright © 2014 by authors and Scientific Research Publishing Inc.
This work is licensed under the Creative Commons Attribution International License (CC BY).
http://creativecommons.org/licenses/by/4.0/
![]()
![]()

Received 27 May 2014; revised 3 July 2014; accepted 15 July 2014
ABSTRACT
Tissue engineering is a preeminent field which aims to regenerate or repair the functions of devastated or damaged organs or tissues due to some accident, disease or age related degeneration. This field provides immense help in saving lives of thousands of patients. Tissues or organs are engineered within the patient’s body or in a laboratory, which is later implanted in the patient’s body. The important challenges for tissue engineers are: appropriate nutrients supply and optimum cell density with uniform distribution of cells in a final construct. Mathematical modeling is the best tool in order to understand the mechanism of cell proliferation and nutrient supply in a bioreactor. Mathematical models not only help to analyze potentially useful results but also enlighten the way of further research. In this work, a simple mathematical model of diffusive nutrient transport and non-linear cell proliferation in a bioreactor is developed. A cell seeded porous scaffold is kept in a bioreactor with a fixed nutrient supply. We model the consumption and transport of nutrients by reaction-diffusion equation and cell proliferation by Fisher Kolmogorove equation. Nutrient delivery to the cell seeded scaffold is purely due to diffusion. The model is solved numerically by commercial finite element solver COMSOL. The results show that all types of constructs, if nutrient supply depends on diffusion, will produce cell proliferated regions near nutrient supply. The results are presented for uniform and non-uniform initial cell seeding strategies. It is also observed that cell proliferation is insensitive to the initial seeding strategy.
Keywords:In Vitro Tissue Engineering, Nutrient Transport, Cell Proliferation

1. Introduction
Each and every tissue or organ is an important part of the human body. Every tissue plays a specific role in the human body in order to run the functions of the body. If a tissue is damaged or lost, it can affect the whole body. Certain organs or tissues do not heal by themselves and require treatment to restore their functionability. In some cases, none of the currently available therapies can restore the functions of damaged or lost tissue e.g. articular cartilage. Tissue engineering offers an alternative strategy for the patient’s requiring the replacement of such tissues. It is a cell based therapy which utilizes the patient’s own cells. Cells from the patient’s body are isolated through a small biopsy; isolated cells are then expanded in laboratory so that they can multiply in number. Cells are then seeded onto a biodegradable scaffold that has the mechanical and chemical properties appropriate to the tissue which is replacing. The cell-seeded scaffold is then placed in a bioreactor. The bioreactor provides a suitable environment for the growth of cells and produces an extracellular matrix. The main challenge to grow a tissue in laboratory is the size of the tissue. To date, it has only been possible to grow a functional tissue in the laboratory with a thickness of only a few hundred micrometers. This is due to the constraint of nutrient supply in the inner layers of the scaffold. Mathematical models of nutrient transport and cell growth are very powerful tools to study tissue growth outcomes in a bioreactor.
Tissue engineering faces several challenges and cell growth in the supporting scaffold is one of them. To achieve the optimal cell density tissue engineers must ensure adequate delivery of nutrients to the inner regions of the scaffold and uniform cell distribution in the final construct.
In vitro tissue growth is very complex being regulated by enormous variety of processes from intracellular pathways to tissue-level mechanics. To understand the complex interacting phenomena of these mechanisms in the scaffold-bioreactor system, a number of mathematical models have been developed. Translating complex biological systems into mathematical equations with well defined parameters, we aim to provide a better understanding of these systems. The crucial benefit of mathematical modeling is that a simple mathematical model can help to predict and analyze the complex mechanisms involved in the system. For these reasons, mathematical models of pathological and physiological processes have already been developed in various areas e.g. solid tumor growth [1] .
Obradovic et al. [2] developed a simple mathematical continuum model to study the synthesis of glycosaminoglycans (GAG) and local oxygen concentration in a polyglycolic acid (PGA) scaffold seeded with bovine chondrocytes. The oxygen concentration and GAG are modeled by using a simple diffusion equation,
 (1)
(1)
where species 1 and 2 represents  and GAG respectively,
  is the concentration and
  is the diffusion of each species.
  is consumption of
  and GAG. The
  is modeled by Michaellis Menton kinetics and
  is modeled as follows,
 (2)
(2)
where N is the cell density, kG represents the rate of GAG synthesis and  is the maximum GAG concentration. Calculated GAG concentrations were qualitatively and quantitatively consistent with the experimental data. They concluded that the spatial variation of oxygen concentration gave heterogeneities in the GAG concentration.
Several mathematical models for cellular proliferation and the diffusion of oxygen inside a scaffold, where the cells were distributed uniformly or non uniformly, were discussed by Galban and Locke [3] . They used the volume averaging method to derive an average reaction diffusion equation for the nutrient concentration in a two phase system (cellular and void). In the volume averaging method the total amount of a quantity (say cell or nutrient concentration) of certain volume was averaged over the entire volume. They also determined the effective diffusion coefficient and reaction rate as a function of local cell volume fraction and local cell volume fraction was determined as a function of time by using the suitable mass balance equation. Particular attention was paid to the diffusion coefficient, which was taken to change by an order of magnitude between regions full of cells and those without, but in this work cell motility was neglected.
Malda et al. [4] developed a mathematical model of the oxygen gradient in the absence of perfusion. They used the simple diffusion equation to model the concentration of oxygen in the scaffold. They identified the oxygen gradient in the tissue engineering construct and predicted the oxygen profiles during the in vitro culture. The oxygen consumption rate was modeled by Monod kinetics. They found that oxygen gradients occurred inside the construct, due to slow diffusion of oxygen and consumption of oxygen by cells. These gradients were higher in the regions of high cell concentration. However this model did not account for the cell proliferation.
Lewis et al. [5] developed a simple one dimensional model to investigate the interactions between the spatial and temporal oxygen profiles and cell distributions within a cartilaginous tissue construct. They modeled the oxygen profile with a reaction-diffusion equation in which the diffusion coefficient was assumed to be constant and local rate of oxygen consumption was proportional to both oxygen concentration and cell density. They also assumed that cells were immobile and the rate of cell proliferation was proportional to the rate of nutrient consumption. They compared the results with the experimental data of Malda et al. [4] . They showed that their model represented a good description of cartilage tissue growth for the first two weeks. At later times the model did not show a good agreement with the experimental data because they did not include the complex mechanisms in the model such as contact inhibition and reduced nutrient transport. The authors found that cell-scaffold constructs that relied on diffusion for nutrient transport produced proliferation dominated regions near the outer edge of scaffold when cell number density and oxygen consumption rate exceeded critical levels.
Dunn et al. [6] extended Lewis et al.’s model and introduced the contact inhibition of growth, using a logistic growth law to describe cell growth. They considered a two dimensional cylindrical geometry and represented the growth rate proportional to the nutrient concentration. They compared the results with the experimental data in which pre-osteoblasts were initially seeded uniformly throughout the porous scaffold and found to give a good agreement with the experimental data. Their results were qualitatively similar to those found by Freed et al [7] for chondrocyte.
Croll et al. [8] developed a model of oxygen diffusion and cell proliferation during the early stages of implantation in a dome-shaped PLGA scaffold. The cell’s oxygen consumption was again described by Monod’s kinetics. Simple models were incorporated for vascular proliferation, cell migration and the effect of cell density on the effective oxygen diffusivity. They found that a homogeneous cell seeding strategy, even with a moving oxygen source provided via vascularization gave rise to hypoxic conditions in some regions of the scaffold for an unacceptable period of time. They proposed that heterogeneous seeding strategy might be more appropriate for large scale tissue engineering.
Landman and Cai [9] extended the work of Croll et al. [8] and Lewis et al. [5] . They developed and investigated a one dimensional model of oxygen concentration, cell proliferation and cell migration inside a scaffold. An arteriovenous loop is placed inside the scaffold in order to form a vascularizing network within a scaffold. The cells proliferation rate is described by a Heaviside step function , where
  is the nutrient concentration and
  is the minimum nutrient concentration required for the cells to survive. They considered the additional effects of vascular proliferation, homogeneous and heterogenous seeding, diffusion of cells and critical hypoxic oxygen concentration.
In this paper we developed a coupled mathematical model of nutrient transport and cell proliferation in a bioreactor. The model includes important features of tissue engineering processes: the nutrient transport and the cell proliferation. The transport of nutrients to the cells is modeled by reaction diffusion equation and the cell growth is modeled by non-linear reaction diffusion equation. We model the increase in cell density by logistic law. We solve the model numerically by using the commercial finite element solver COMSOL. The main aim of this project is to describe the comprehensive one dimensional mathematical model of nutrient transport and cell growth in a bioreactor.
The paper is organized as follows. In Section 2 we present the dimensional model equations and in Section 3 we present the dimensionless model. The parameter values and numerical solution are described in Sections 4 and 5 respectively. We present the results for various initial seeding strategies in Section 6. Our computational results show that the total cell density in the final construct is insensitive to the initial seeding strategy.
2. Geometry and Model Equations
Tissue formation is the process of three dimensional cell proliferation in a porous scaffold with interconnected pores in a bioreactor. Growth of cells is assumed to be similar in all dimensions around the line of symmetry. It is assumed that cartesian co-ordinate system can be aligned with the scaffold geometry. The length of the porous scaffold extends from  to
to , where
  represents the depth of scaffold as shown in Figure 1. The centerline is assumed to be the line of symmetry. Hence for an easy interpretation of the results, we consider the length of scaffold from
  to
to . Both surfaces are cultured in a well-stirred region of nutrient rich medium. The model consists of two differential equations, the first representing the consumption and transport of nutrients by diffusion, with the concentration of nutrients denoted by
 , and the second representing the cell proliferation, in terms of cell density denoted by
 . Nutrients are assumed to spread due to diffusion, with a constant diffusion rate
  and to be consumed by the cells at the rate
 . Cells are assumed to diffuse with a constant diffusion rate
  and they grow in number at a rate
 . We assume that the initial cell density in the scaffold is
 , where the form of
  is determined by initial cell seeding strategy i.e. uniform or non-uniform seeding.
In the next section we will describe the equations governing the nutrient delivery and cell growth together with appropriate boundary and initial conditions.
2.1. Nutrient Transport Equation
Cells require various nutrients to perform their functions, but for simplicity our model includes a single generic nutrient. This essential nutrient is delivered to the cells via a fluid known as culture medium. We assume that nutrient (fluid) is non-viscous, in-compressible and non-Newtonian. Transport of nutrient to the cells is due to diffusion only, so the conservation equation governing the transport and consumption of nutrient is
 (3)
(3)
where ![]() denotes the time,
denotes the time,  is the molar concentration of nutrient,
  is the diffusion coefficient of nutrient and
  is the nutrient uptake rate. In this case
  is constant and
  is assumed to be a prescribed function of the cell density and nutrient concentration.
The boundary conditions are as follows. We assume a bath of nutrients at the boundary  so that nutrient concentration is assumed to be a constant
 . Mathematically we write as
 (4)
(4)
We assume no flux of nutrient at the center of the scaffold to account for scaffold symmetry.
 (5)
(5)
2.2. Cell Proliferation Equation
We model the change in cell density due to cell proliferation and spreading as cell density increases. We consider a logistic growth model in which the cell population spreads via diffusion, so we have a coupled system of reaction kinetics and diffusion. These two features are captured in Fisher’s equation. Hence the growth of cells is governed by the non-linear Fisher’s equation.
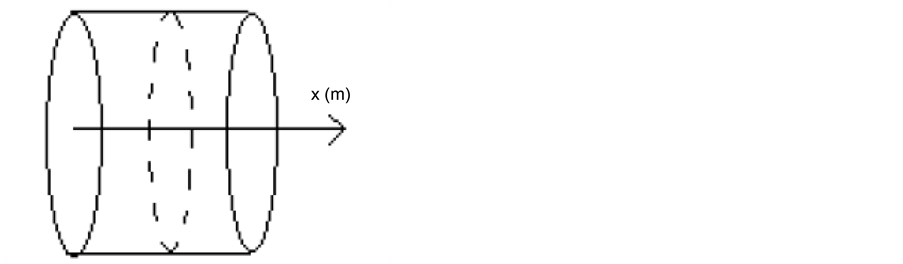
Figure 1. Model geometry.
 (6)
(6)
where ![]() represents the cell diffusion. For simplicity, we assume that cell mortality rate due to lack of nutrients is negligible compared to cell growth.
represents the cell diffusion. For simplicity, we assume that cell mortality rate due to lack of nutrients is negligible compared to cell growth.
We assume that individual cells cannot leave the domain which means zero flux boundary conditions at both the boundaries. Mathematically we write
 (7)
(7)
We suppose that at time  the initial cell density is
 ,
,
 (8)
(8)
where the form of  depends on the seeding strategy. We will use different choices of
  in our simulations.
2.3. Consumption and Proliferation Rates
An important part of the modeling is the prescription of the nutrient consumption and net cell growth rate functions  and
and ![]() respectively. Let
respectively. Let  be the proliferation rate of the cells. We suppose that the rate of proliferation of cells is only a function of nutrient concentration i.e.
  and the rate of nutrient consumption per cell is
 , where
  is constant. The cell density changes due to cell growth only. Because the growth rate is much higher than the death rate so we assume that cell death is negligible. We assume that the cells proliferate according to the logistic law. Thus the net growth rate
 , where
  is the maximum carrying capacity. There is a significant discussion in the literature about the form of t he proliferation rate
 , e.g. Mcelwain and Ponzo [10] used a piecewise linear behavior; whereas Galban and Locke [11] used more complex functions such as modified Contois, Moser and nth order heterogeneous models. Coletti et al. [12] also used a Contois function to describe the cell growth. Landman and Cai [9] considered a Heaviside step functional form
 , where
  is the hypoxic threshold for the nutrient concentration. Lewis et al. [5] also used Heaviside step function to represent the proliferation rate
  but they used hypoxic threshold for the nutrient concentration
  so proliferation rate
 . Michaelis-Menton type behavior is used by Malda et al. [13] . All these forms reduce to simple linear behavior for small values of the concentration. The most commonly used functional form, linear and Michaelis-Menton functions can be chosen here to describe the proliferation rate
 . For simplicity, we consider a simple linear behavior used by Jones et al. [14] and Lewis et al. [5] . Therefore, we choose
 , where
  is a constant. Thus
 (9)
(9)
We assume that the dominant mechanism for cell nutrient consumption is entirely dependent on the cellular growth. Hence the nutrient consumption rate is given by
 (10)
(10)
where  is a constant.
By substituting the values of  and
and ![]() from the Equations (9) and (10) into Equations (3) and (6) we get
from the Equations (9) and (10) into Equations (3) and (6) we get
 (11)
(11)
and
 (12)
(12)
Summary of the dimensional model is given in Table1

Table 1. Summary of dimensional model equations, boundary and initial conditions.
3. Non-Dimensionalization
We non-dimensionalize all lengths by 

We non-dimensionalize all cell densities  and
and  by maximum carrying capacity
  and nutrient concentration
  by initial concentration
  respectively,

Finally, we non-dimensionalize time by

3.1. Non-Dimensional Model
By using the non-dimensional parameters, nutrient transport Equation (11) can be written as
 (13)
(13)
where
 (14)
(14)
are dimensionless parameters.  is the ratio of cells growth to the nutrient consumption rate and
  is the ratio of nutrient diffusion to the nutrient consumption rate.
The boundary conditions (4) and (5) can be written in dimensionless form as
 (15a)
(15a)
 (15b)
(15b)
Similarly the cell growth Equation (12) in the dimensionless form can be written as
 (16)
(16)
where
 (17)
(17)
is a dimensionless number which is ratio of the cell diffusion to cell growth rate. In dimensionless form the boundary conditions (7) becomes
 (18)
(18)
The initial condition (8) in dimensionless form can be written as
 (19)
(19)
We observe from Section 4 that the nutrient consumption rate  is much higher than the cell growth rate
  then parameter
  becomes very small and can be neglected so we consider quasi-static version of Equation (13) in which we neglect the time derivative.
3.2. Model Summary
In summary, the model variables are given in Table2 The two dependent variables are governed by equations (13) and (16) which must be solved subject to boundary conditions (15a), (15b) and (18). We also require the initial condition (20). The summary of the dimensionless model is shown in Table3
4. Parameter Values
The model presented in Section 3 has a number of parameters. Some parameters depend on the cell and nutrient type and some depend on the bioreactor design. Table 3 shows the values of parameters used in the simulations. The values of physical parameter such as scaffold length is chosen with reference to experiments [15] . Quantities such as maximum carrying capacity, and nutrient uptake rate depend on the cell type. Our model is a generic model and can be applied to any cell and nutrient type. The cell type we have chosen for this study is Murine immortalized rat cell  [12] .
For their survival, cells require various nutrients that include glucose, oxygen, glutamine, carbondioxide, ascorbic acid (vitamin C) etc. [16] . To simplify, we assume that cell growth is limited by the supply of oxygen only [13] . The initial oxygen concentration  is chosen as
 , which is much higher than the minimum nutrients required for the cell viability. The maximum cell proliferation rate
  is taken from the [12] . For
  the maximum oxygen uptake rate
  is presently unavailable either experimentally or in the literature. Therefore, this value is approximated by using the values for chondrocytes [2] . In the cell proliferation equation, the value of parameter
  can be calculated from the initial oxygen concentration
  and maximum cell proliferation rate
 . The parameter values along with references have been given in Table4 Using these values of dimensional parameters as shown in Table 4, we have calculated the values for dimensionless parameters as shown in Table 5 which will be used in our simulations.
5. Numerical Solution
The model consists of two coupled partial differential equations, representing the nutrient transport and cell evolution equations. It is a complicated system and cannot be solved analytically. The model presented in Table 3 is solved numerically in this section by commercial finite element solver COMSOL. The domain of the problem  is divided into small units of mesh elements. The mesh is uniform in the entire domain and can be refined successively until we get the required convergent results. The total number of mesh elements used for
Table 2 . Variables in model.
Table 3. Summary of dimensionless model equations, boundary and initial conditions.
Where 
Table 4. Dimensional parameters and their values.
Table 5. Values of dimensionless parameters.
all the calculations are 3841 mesh points and 3840 mesh elements. The dependent variables are approximated by quadratic shape functions. We have two dependent scalar variables, described by the partial differential equations, nutrient concentration ![]() and cell density
and cell density . The system is solved for 15362 degrees of freedom, 7681 for each dependent variable.
In this model nutrient transport equation is quasi-static and cell growth equation is time dependent. We solve cell proliferation equation with step size  and keep the nutrient concentration
 ![]() fixed till the time reaches
fixed till the time reaches![]() . After time
. After time ![]() we update the cell density in nutrient transport equation and solve it for updated cell density. Thus we can say that cell proliferation equation is solved for time
we update the cell density in nutrient transport equation and solve it for updated cell density. Thus we can say that cell proliferation equation is solved for time![]() ; where
; where  is the step size for cell proliferation equation and
 ![]() is the time when we update cell density in the nutrient transport equation. This process continues until the system reaches steady state. We use
is the time when we update cell density in the nutrient transport equation. This process continues until the system reaches steady state. We use  and
and ![]() throughout our simulations. We choose the backward Euler’s method for transient cell proliferation and direct solver (UMFPACK) to solve the linear system of equations.
throughout our simulations. We choose the backward Euler’s method for transient cell proliferation and direct solver (UMFPACK) to solve the linear system of equations.
We have checked the convergence of our numerical method with respect to the mesh size, time step (with respect to cell proliferation equation) and cell update time.
6. Results and Discussion
The initial cell density plays an important role in maximizing the total cell numbers in the final construct. It is believed that uniform initial cell distribution lays the foundation for uniform cell proliferation [18] and nonuniform initial cell distribution results in the enhanced tissue growth at the periphery of scaffold [7] . Our aim is to identify the initial seeding strategy that gives the rapid growth and maximum number of cells in the final construct. In the next section we will test our model for uniform and non-uniform initial cell densities and present the numerical results of the model for both type of initial cell distributions.
6.1. Uniform Initial Cell Density
Let us consider the uniform initial cell distribution in the entire scaffold. The form of uniform initial cell density is shown in Figure 2. In this case the total initial cell number, found by integrating the initial cell density over the entire scaffold, is .
.
Figure 3 shows the results of cell density  for times
  and the values of other parameters used in our simulations are given in Table5 Arrow shows that time is increasing in the upward direction. The
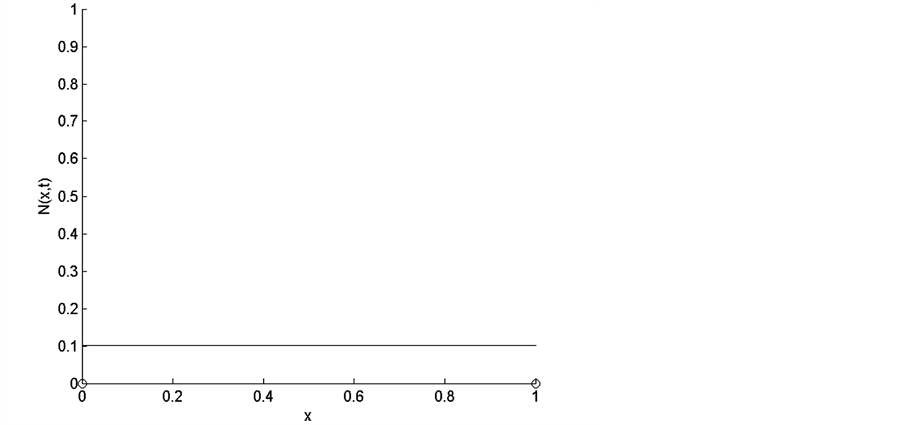
Figure 2. Uniform initial cell density.
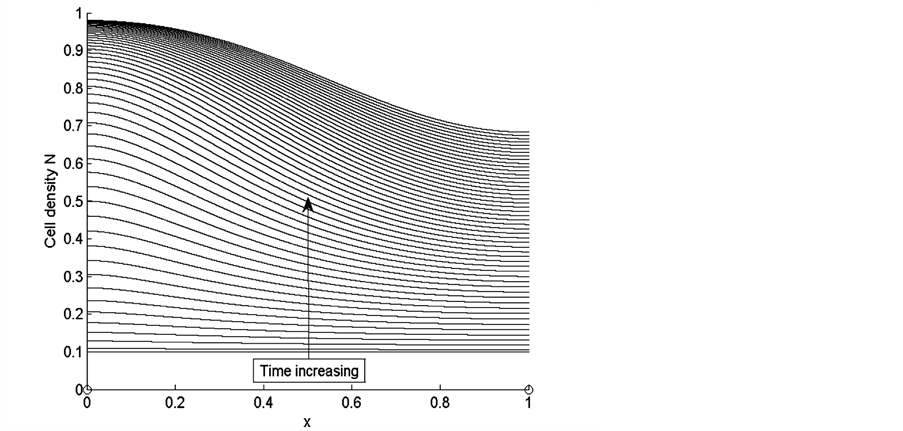
Figure 3. Cell density N for time ,
,  ,
,  ,
,  ,
,  and
and .
.
first curve at the bottom is for time  and the last curve at the top is for time
 . We observe from the results that cells closer to the nutrient supply grow very quickly whereas the cell growth away from nutrient supply is comparatively slower.
Figure 4 shows the results of nutrient concentration ![]() for same times and parameters given in the Figure 3. Arrow shows that time is increasing in downward direction. The first curve at the top is for time
for same times and parameters given in the Figure 3. Arrow shows that time is increasing in downward direction. The first curve at the top is for time  and the last curve at the bottom is for time
 . The concentration of nutrients is high near the boundary
  but it reduces as we move away from the boundary
 .
.
Figure 3 shows uniform cell proliferation at initial stages of growth when cell density is very low. Initially cells are uniformly distributed in the entire scaffold and there is much space and nutrients available for the cells to grow and diffuse inside the scaffold. When the cells grow and fill the empty spaces in the scaffold, they consume more nutrients. Initially cells are highly in contact with uniformly distributed nutrients. At this stage, sufficient amount of nutrients are available for small number of cells; therefore, cells grow rapidly at initial stages of growth. At later stages of growth, we notice that cell proliferation becomes non-uniform with the increase in cell density. Cells near the source of nutrient supply consume nutrients at a faster rate and consequently grow rapidly and block the scaffold pores. This blockage limits the supply of nutrients to the inner sections of the scaffold, due to which cells in the deeper sections of the scaffold become hypoxic which decreases the growth of cells in this region.
From Figure 4 we observe that at initial stages of growth, nutrient concentration is approximately uniform throughout the scaffold. Nutrient supply via diffusion is possible because of empty voids of scaffold. The cells near the source of nutrient supply consume most of the nutrients and grow rapidly. When the cells grow, they block the scaffold pores and limit the supply of nutrients via diffusion to the deeper sections of the scaffold. Due to this reason, the concentration of nutrients in the deeper sections of the scaffold decreases with the passage of time. In Figure 4 we notice that nutrient concentration is higher near the boundary  because nutrient supply is fixed at this boundary but the concentration of nutrients continuously decreases in the deeper sections of the scaffold which is evident from Figure 4. We also observe in the Figure 4 that higher cell density near nutrient supply, limits the supply of nutrients via diffusion to the inner sections of scaffolds, which creates nutrient gradients in the entire scaffold.
Figure 5 shows the time evolution of total cell number for time . At time
  the total number of cells are 0.1. After time
  (which is approximately 38 days) the cell density approximately becomes 1 and cell growth stops. From Figure 5 it is clear that initially cells grow exponentially because total number of cells in the scaffold are very low as compared to the maximum carrying capacity. At initial stages of growth, cells have much space and sufficient nutrients available for their growth. Later with the passage of
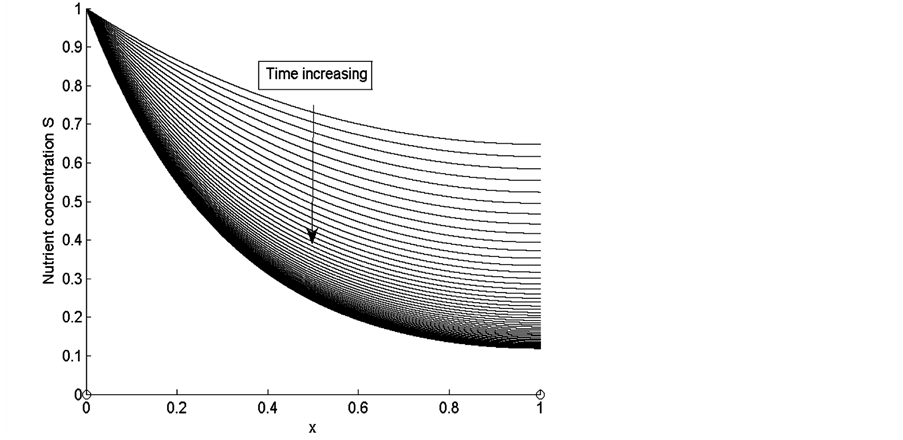
Figure 4. Nutrient concentration S for same time, initial cell density and parameter values given in the Figure 3.
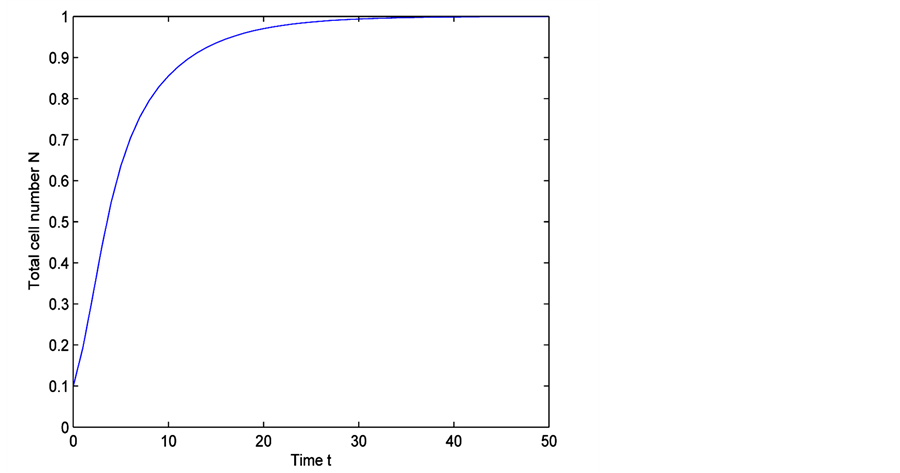
Figure 5. Time evolution of total cell N calculated numerically, for time  and
and .
.
time, total number of cells increase in scaffold due to which space and diffusive nutrient supply is reduced. Therefore, cell growth decreases which is shown in the middle section of the Figure 5. It is evident from Figure 5 that when total cell number is approaching towards its maximum carrying capacity, the cell growth becomes very slow. Finally when cell density becomes 1, cell growth stops.
Non-Uniform Initial Cell Density
Let us consider a non-uniform initial cell density e.g.

where  represents Heaviside step function. Figure 6 shows the form of non-uniform initial cell density.
Figure 7 shows the results of cell density  for time
 , all the other parameter values are same as given in Figure 3. Arrow shows that time is increasing in the upward direction. The first curve at the bottom is for time
  and the last curve at the top is for time
 . We observe from the results that cells closer to the nutrient supply grow fast whereas growth of cells is slower away from the nutrient supply.
Figure 8 shows the results of nutrient concentration ![]() for same time and parameter values used in Figure 3. Arrow shows that time is increasing in downward direction. The first curve at the top is for time
for same time and parameter values used in Figure 3. Arrow shows that time is increasing in downward direction. The first curve at the top is for time  and the last curve at the bottom is for time
 . We observe in Figure 8 that the concentration of nutrients is higher near the boundary
  but it decreases as we move away from nutrient supply.
It is evident from Figure 7 that cells grow and spread throughout the scaffold. At the initial stages of growth, non-uniformly distributed initial cell density is largely in contact with sufficient amount of nutrients available, so cells grow rapidly. During growth cells spread in the scaffold from regions of high cell density to the regions of low cell density. We observe that cell growth is higher near the nutrient supply because cells in this region have constant supply of nutrients. These cells spread in the scaffold and block the empty pores of scaffold. Consequently rapid cell growth in the outer sections of the scaffold limits the supply of nutrients to the inner sections of scaffold. Therefore cells in the deeper regions become hypoxic.
Figure 8 shows that initially nutrient concentration is approximately uniform throughout the scaffold. Due to constant supply of nutrients to the cells near the boundary  cell proliferation is high in this region. These cells consume most of the nutrients, grow rapidly and block the scaffold pores. Due to this blockage nutrients cannot diffuse to the deeper sections of the scaffold. Therefore cells away from the nutrient source become hypoxic.
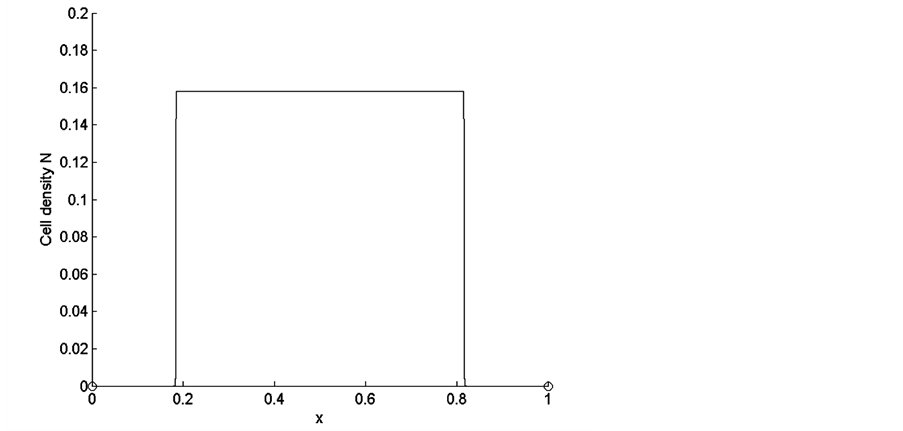
Figure 6. Non-uniform initial condition.
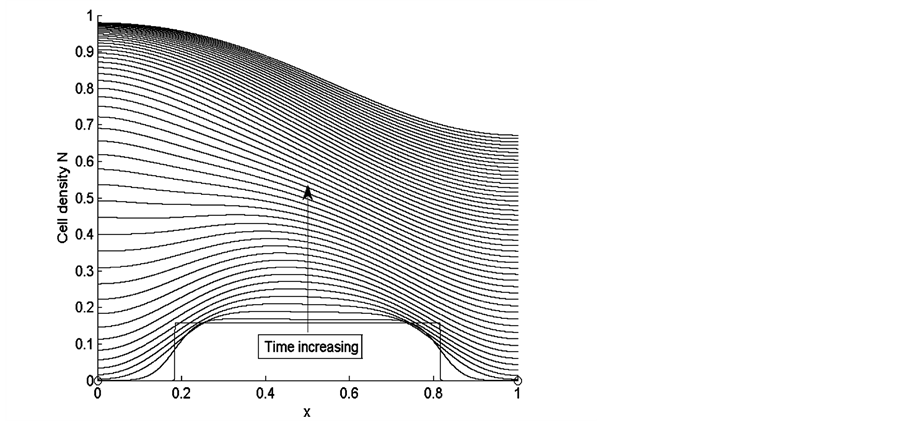
Figure 7. Cell density N for time  for
for ,
,  and
and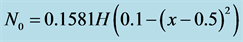 .
.
Figure 9 shows the time evolution of the total cell number in the domain for time . At time
 , total number of cells are 0.1 then with the passage of time total number of cells increase and finally at time
  cell density becomes 1 and cell growth stops.
We notice from Figure 9 that at initial stages of growth, cells grow exponentially as total number of cells are very less in comparison to the maximum carrying capacity. Available space and available nutrients are sufficient at initial stages of growth but with the passage of time, the total number of cells are increased and available resources (space and nutrients concentration) are reduced. From the middle section of Figure 9 it is evident that cell growth is decreased because of low supply of nutrients. The difference between the total number of cells and maximum carrying capacity reduces at each time level. Finally when cell density becomes 1, cell growth stops.
Figure 10 shows the comparison of time evolution of total cell densities for uniform and non-uniform initial cell seeding strategies. The results are presented for time ,
,  and
and . It is evident
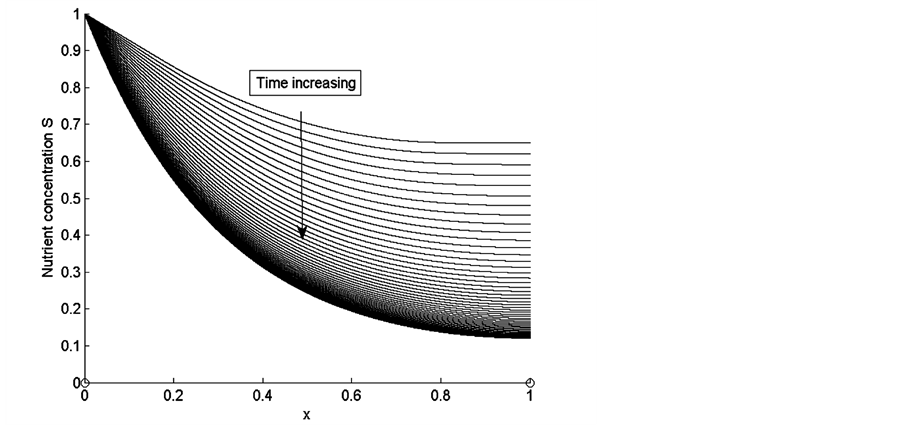
Figure 8. Nutrient concentration S for time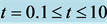 , for
, for ,
,  and
and .
.
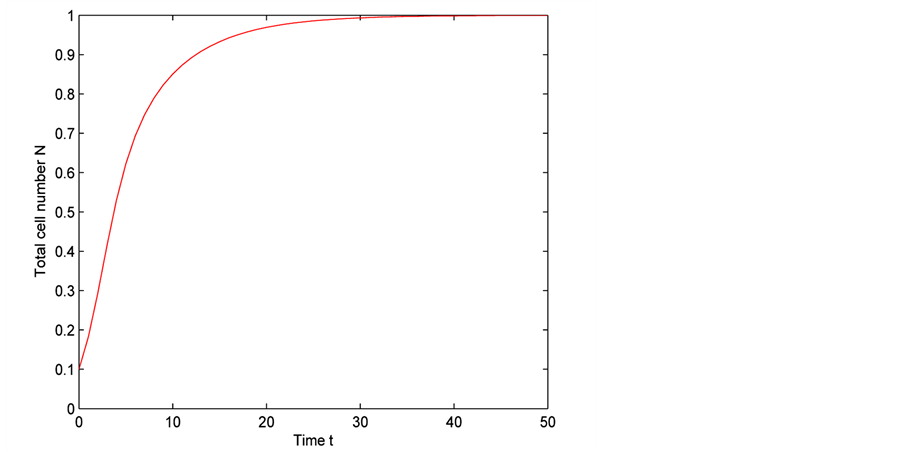
Figure 9. Time evolution of total cell N calculated numerically, for time  and
and .
.
from Figure 10 that initially cell growth is exponential but it decreases when total cell number approaches to maximum carrying capacity. Finally when cell density reaches 1 in the entire scaffold the cell growth stops. We also observe from Figure 10 that cell growth rate for uniform and non-uniform initial cell seeding strategies is almost same.
7. Summary and Conclusions
In this paper we have developed a coupled mathematical model of biological cell proliferation and nutrient transport in a bioreactor. The model consists of two partial differential equations representing the transport of nutrients and cell proliferation. The transport of nutrients is only via diffusion. We modeled the nutrient trans-
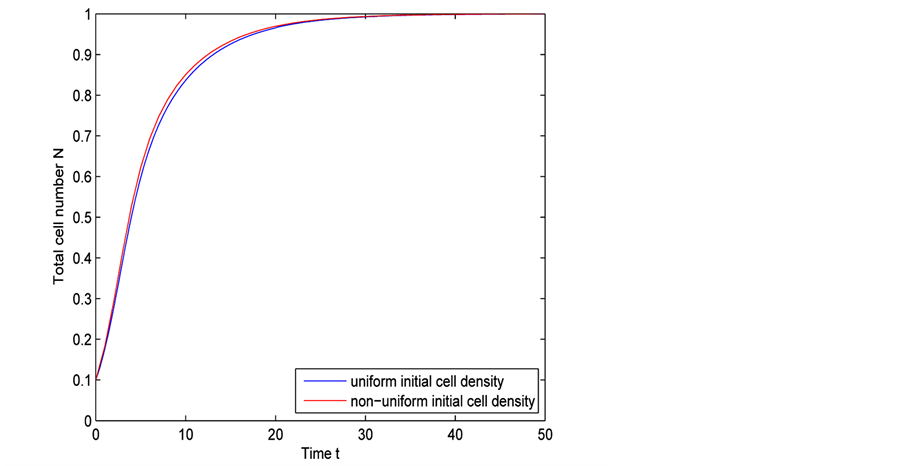
Figure 10. Comparison of time evolution of total cell number for uniform and non-uniform initial cell densities.
port by reaction diffusion equation and cell growth by non-linear Fisher-Kolmogorov equation. As cell proliferation is slow compared evolution of nutrient filed, the cell proliferation equation is time dependent and the nutrient transport equation is quasi-static with respect to changes in cell density. To solve the model, we must specify the initial cell distribution. The coupled system of partial differential equations is solved by finite element solver COMSOL.
This study provides comprehensive discussion on cell growth mechanism for replacement and regeneration of human tissues or organs which are diseased or accidentally damaged. Main challenges which tissue engineering facing today include proper nutrient supply to the inner regions of growing tissue construct and to achieve the uniform cell distribution in the final construct. Tissue engineering sets high goals to accomplish these challenges by growing tissues and organs in the laboratory outside the patient’s body with the help of bioreactor. Cell proliferation and nutrients transport are the main themes of our study. Mathematical models help to infer the results and behavior of the models in different applied conditions. We tested our model for uniform and non-uniform initial seeding strategies.
The main aim of tissue engineering is to identify the useful ways to achieve the uniform cell distribution in the final construct. This study highlights the areas which directly influence the growth of cells in the scaffold. Proper nutrient supply to the internal regions of scaffold along with uniform cell distribution in the final construct is major areas of interest. From the analysis of the model we observe that uniform cell distribution in the final construct is sensitive to nutrient supply. The nutrient supply to the growing tissue construct is via only diffusion which affects the cell growth. We studied uniform and non-uniform initial cell distributions when nutrient supply is possible only via diffusion. From the results we found that for both uniform and non-uniform initial cell seeding strategies, cells near the nutrient source grow rapidly at initial stages of growth but cell growth decreases away from the nutrient supply. Cells near the nutrient source consume most of the nutrients and grow rapidly, due to constant supply of nutrients in this region. Due to high consumption of nutrients in the outer regions of scaffold, cells in the deeper sections of the scaffold become hypoxic. The growth of cells in the deeper sections is much slow due to limited supply of nutrients. Cells from the outer sections grow and spread in the inner sections of scaffold to achieve uniform cell distribution by filling the voids of scaffold.
The model discussed in this study provides a comprehensive discussion on the effects of diffusive nutrient supply to the cells in a bioreactor. The study covers the discussion of uniform and non-uniform initial cell densities when nutrients supply depends on diffusion only. We conclude that for both seeding strategies, cell proliferated regions are found near nutrient supply. The growth of cells away from the nutrient supply is affected by limited supply of nutrients and cannot produce uniform distribution of cells in the final construct. It is therefore found that if diffusion of nutrients to the inner regions of scaffold is made to improve then we may be able to achieve optimum cell density in the final construct. The better results may be obtained by including the advective supply of nutrients.
References
- Britton, N.F. (2003) Essential Mathematical Biology. Springer Undergraduate Mathematics Series. http://dx.doi.org/10.1007/978-1-4471-0049-2
- Obradovic, B., Meldon, J.H., Freed, L.E. and Vunjak-Novakovic, G. (2000) Glycosaminoglycan Deposition in Engineered Cartilage: Experiments and Mathematical Model. AIChE Journal, 46, 1860-1871. http://dx.doi.org/10.1002/aic.690460914
- Galban, C.J. and Locke, B.R. (1997) Analysis of Cell Growth in a Polymer Scaffold Using a Moving Boundary Approach. Biotechnology and Bioengineering, 56, 422-432. http://dx.doi.org/10.1002/(SICI)1097-0290(19971120)56:4<422::AID-BIT7>3.0.CO;2-Q
- Malda, J., Woodfield, T.B.F., Van Der Vloodt, F., Kooy, F.K., Martens, D.E., Tramper, J., Blitterswijk, C.A. and Riesle, J. (2004) The Effect of PEGT/PBT Scaffold Architecture on Oxygen Gradients in Tissue Engineered Cartilaginous Constructs. Biomaterials, 25, 5773-5780. http://dx.doi.org/10.1016/j.biomaterials.2004.01.028
- Lewis, M.C., MacArthur, B.D., Malda, J., Pettet, G. and Please, C.P. (2005) Heterogeneous Proliferation within Engineered Cartilaginous Tissue: The Role of Oxygen Tension. Biotechnology and Bioengineering, 91, 607-615. http://dx.doi.org/10.1002/bit.20508
- Dunn, J.C.Y., Chan, W.Y., Crostini, V., Kim, J.S., Lowengrub, J., Singh, S. and Wu, B.M. (2006) Analysis of Cell Growth in Three-Dimensional Scaffold. Tissue Engineering, 12, 705-716. http://dx.doi.org/10.1089/ten.2006.12.705
- Freed, L.E., Hollander, A.P., Martin, I., Barry, J.R., Langer, R. and Vunjak-Novakovic, G. (1998) Chondrogenesis in a Cell-Polymer-Bioreactor System. Experimental Cell Research, 240, 58-65. http://dx.doi.org/10.1006/excr.1998.4010
- Croll, T.I., Gentz, S., Mueller, K., Davidson, M., O’Connor, A.J., Stevens, G.W. and Cooper-White, J.J. (2005) Modelling Oxygen Diffusion and Cell Growth in a Porous, Vascularising Scaffold for Soft Tissue Engineering Applications. Chemical Engineering Science, 60, 4924-4934. http://dx.doi.org/10.1016/j.ces.2005.03.051
- Landman, K.A. and Cai, A.Q. (2007) Cell Proliferation and Oxygen Diffusion in a Vascularising Scaffold. Bulletin of Mathematical Biology, 69, 2405-2428. http://dx.doi.org/10.1007/s11538-007-9225-x
- McElwain, D.L.S. and Ponzo, P.J. (1977) A Model for the Growth of a Solid Tumor with Non-Uniform Oxygen Consumption. Mathematical Biosciences, 35, 267-279. http://dx.doi.org/10.1016/0025-5564(77)90028-1
- Galban, C.J. and Locke, B.R. (1999) Analysis of Cell Growth Kinetics and Substrate Diffusion in a Polymer Scaffold. Biotechnology and Bioengineering, 65, 121-132. http://dx.doi.org/10.1002/(SICI)1097-0290(19991020)65:2<121::AID-BIT1>3.0.CO;2-6
- Coletti, F., Macchietto, S. and Elvassore, N. (2006) Mathematical Modeling of Three-Dimensional Cell Cultures in Perfusion Bioreactors. Industrial & Engineering Chemistry Research, 45, 8158-8169. http://dx.doi.org/10.1021/ie051144v
- Malda, J., Rouwkema, J., Martens, D.E., le Comte, E.P., Kooy, F.K., Tramper, J., Van Blitterswijk, C.A. and Riesle, J. (2004) Oxygen Gradients in Tissue-Engineered Pegt/Pbt Cartilaginous Constructs: Measurement and Modeling. Biotechnology and Bioengineering, 86, 9-18. http://dx.doi.org/10.1002/bit.20038
- Jones, A.F., Byrne, H.M., Gibson, J.S. and Dold, J.W. (2000) A Mathematical Model of the Stress Induced during Avascular Tumour Growth. Journal of Mathematical Biology, 40, 473-499. http://dx.doi.org/10.1007/s002850000033
- Rose, F.R., Cyster, L.A., Grant, D.M., Scotchford, C.A., Howdle, S.M. and Shakesheff, K.M. (2004) In Vitro Assessment of Cell Penetration into Porous Hydroxyapatite Scaffolds with a Central Aligned Channel. Biomaterials, 25, 5507-5514. http://dx.doi.org/10.1016/j.biomaterials.2004.01.012
- Sengers, B.G., Van Donkelaar, C.C., Oomens, C.W.J. and Baaijens, F.P.T. (2005) Computational Study of Culture Conditions and Nutrient Supply in Cartilage Tissue Engineering. Biotechnology Progress, 21, 1252-1261. http://dx.doi.org/10.1021/bp0500157
- Shakeel, M. (2011) Continuum Modelling of Cell Growth and Nutrient Transport in a Perfusion Bioreactor. PhD Thesis, University of Nottingham, Nottingham.
- Bueno, E.M., Laevsky, G. and Barabino, G.A. (2007) Enhancing Cell Seeding of Scaffolds in Tissue Engineering through Manipulation of Hydrodynamic Parameters. Journal of Biotechnology, 129, 516-531.http://dx.doi.org/10.1016/j.jbiotec.2007.01.005