Applied Mathematics
Vol.5 No.1(2014), Article ID:41816,4 pages DOI:10.4236/am.2014.51012
The Chinese Urban and Rural per Capita Income and Trend Analysis
College of Science, Guilin University of Technology, Guilin, China
Email: sujian2233@163.com
Received October 8, 2013; revised November 8, 2013; accepted November 15, 2013
ABSTRACT
This paper uses the ARMA model method to fit the data of the urban and the rural residents’ per capita income in China and builds the MA(2) and AR(2) model. With the model, this paper predicts their trends in 5 years, also uses the prediction to analyze the income gap. The results show that in the next 5 years, the rural and the urban residents’ per capita income will be increasing steadily, but the level remains very low, the income gap is still large.
Keywords:Per Capita Income; Income Gap; ARMA Model
1. Introduction
In recent years, people feel a lot of life pressure because of the soaring prices, and the rise of per-capita income which is not coordinated with the soaring price of commodities causes people’s attention again. The income level determines the consumption level. What’s more, it still determines the condition of the material life. The government takes a lot of strategies in order to increase the income, such as creating jobs, raising the minimum wage standard, perfecting the insurance system. Since 2004, the No. 1 document from the national central government has focused on increasing the rural income for seven consecutive years. Though China is a big agricultural country, the rural income is still in a low level. The incompatible development of urban and rural residents’ per capita income leads to a large gap. Since 1990, the gap went through a process of expansion to contraction then to expansion again. In 2009, the gap of urban and rural residents’ per capita income is 3.3:1, which is a very high level. Generally speaking, the gap in the developed country is 1.5, but in the developing country is 2. If the gap is 3 or above, it means that the gap is so large, it still means an unbalanced structure, and that will threaten the stability of the society.
In an era of soaring housing price and oil price, the development of the economy will become meaningless when the income level is still low, and the soaring price is only the economic bubbles. So studying the per-capita income of urban and rural residents seems to be very important.
2. ARMA Model [1]
Auto-Regressive Moving Average (ARMA):

where ,
, .
.
ARMA model is used for the stationary time series. When comes to the nonstationary time series, we need to use the difference algebra to deal with it. Usually the low order difference will make the nonstationary time series stationary. After the difference algebra, we apply the augmented Dickey-Fuller (ADF) test to test whether the series stationary or not. The null hypothesis of ADF test is that the time series are nonstationary. If the series are stationary, we turn to fit the ARMA model. Then we use the LB statistic to conduct the white noise test. The null hypothesis of the LB test is that the series are white noise. The LB statistic is:

3. Data Analysis
3.1. Data Collection
This paper uses the Chinese urban per-capita disposable income and the rural household per-capita net income in 1978, 1980, 1985 and 1990 to 2011 as data. The data is collected from the national bureau of statistics web.
3.2. Urban Per-Capita Disposable Income Model
We analyze the urban per-capita disposable income series by applying second-order difference algorithm, . Then we test stationary of the new series based on ADF (Table 1). The result shows that the Sig. is 0.0031. We conclude that the new series are stationary under the significant level 0.05. Figure 1 shows the autocorrelation and the partial autocorrelation of the new series. Then we try to fit the new series by using model MA(2).
We estimate the parameters in the model by using the conditional Least Squares Estimate, and delete the parameters which are not significant. The AIC and SBC are 283.8746 and 285.8661. Finally we construct the model:

The result of autocorrelation check of residuals (Figure 2) shows that the Sig. of LB statistic of each lag is greater than that of significant level 0.05. All of these support the model we constructed.

Table 1. ADF test for urban per-capita disposable income.
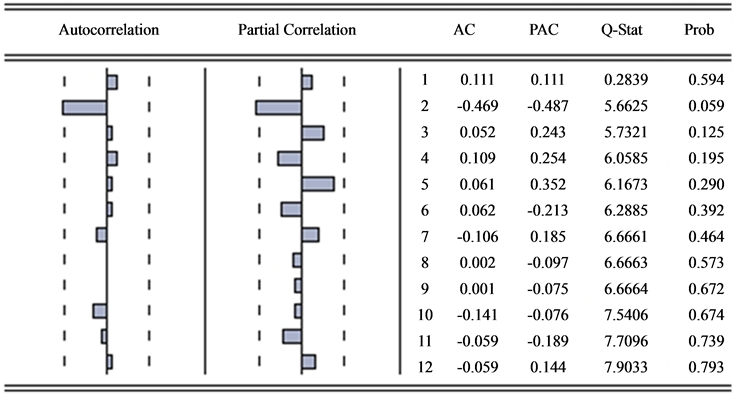
Figure 1. Autocorrelation and the partial autocorrelation of the new series.
3.3. Rural Household Per-Capita Net Income Model
Then we analyze the rural household per-capita net income series. The series are stationary based on the 3 order difference. ADF test (Table 2) shows that the Sig. is 0.0001, apparently less than the significant level 0.05. Figure 3 tells us that we can try to fit the new series as model AR (2).
AIC and SBC of the model we constructed are 241.1587 and 243.0476. And all the parameters are significant. So the final model is:

Figure 4 shows the autocorrelation check of residuals. The result supports our model.
4. Conclusion
Based on the models we constructed above, we predict the urban per-capita disposable income and rural household per-capita net income in the next 5 years. The results are displayed in Table3
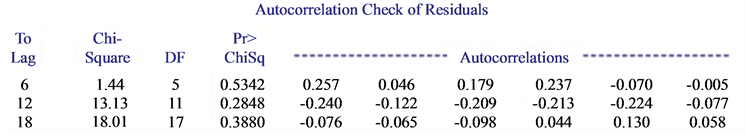
Figure 2. Autocorrelations of the residuals.
Table 2. ADF test for rural household per-capita net income.
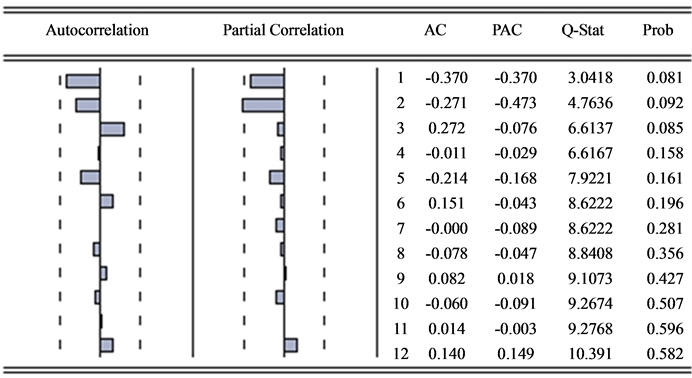
Figure 3. Autocorrelation and the partial autocorrelation of the new series.
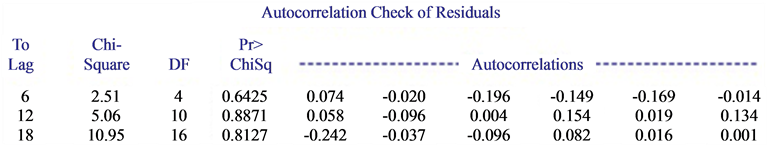
Figure 4. Autocorrelations of the residuals.
Table 3. Prediction.
a. The unit is Yuan; b. The confidence of confidence interval is 95%.
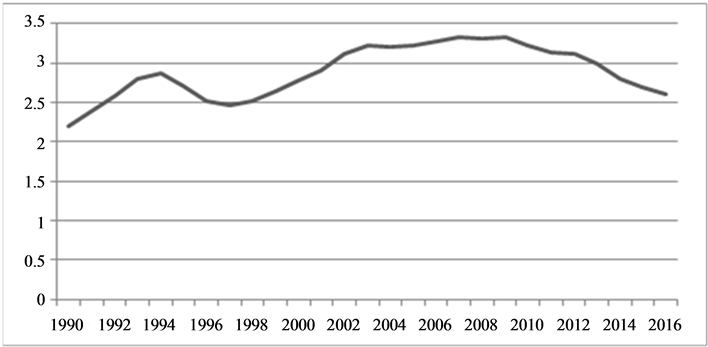
Figure 5. The ratio of urban income and rural income.
We obtain that urban per-capita disposable income is going to break through 30 thousand yuan, 2568 yuan for each month till 2015. According to the research on the average monthly income in 72 nations and areas around the world made by the United Nations International Labor Organization, the average monthly income in these nations and areas is 1480 dollars, equal to 9327 yuan. What’s more, the research was exclusive of the poor areas, and only calculated the wage, the income of individual household and the freelance are not included. However, in this paper, we involve 4 kinds of income: wage income, property income, operational income, transfer income. Obviously, the urban per-capita disposable income in China is still below the world-wide levels.
On the rural household per-capita net income hand, the prediction shows that their net income will exceed ten thousand yuan in 2014, 850 yuan monthly. That’s only equal to the level of urban per-capita disposable income 8 years ago. In such an era, this level lags so far behind. According to the data from 2011 national statistics yearbook, contribution of agriculture to GDP in 2010 was 10.1 percent. It means that agriculture plays an important role in our country. But the rural household per-capita net income is in such a low level.
Figure 5 shows the income gaps between the urban and rural income. We find that the gaps in the next 5 years are 3.11, 3.00, 2.79, 2.69, 2.61. These numbers indicate the downtrend. However, they are still larger than 2.5. In other words, the income gap is on the edge of balance, and that is far away from 1.5 in the developed countries. These problems urge us to make more efforts to narrow the gap, to make the society fairer.
Acknowledgements
This work was jointly supported by the National Social Science Fund (No. 13BTJ009), and the Guangxi Key Laboratory of Spatial Information and Geomatics (No. 1207115-27).
REFERENCES
- Y. Wang, “Applied Time Series Analysis,” 3rd Edition, China Renmin University Press Co. LTD., Beijing, 2005.