Applied Mathematics
Vol. 3 No. 4 (2012) , Article ID: 18889 , 9 pages DOI:10.4236/am.2012.34057
Cognitive Mapping: Testing Application of Causal Algebra
Faculty of Economics and Management, Higher Institute of Business Administration, Sfax, Tunisia
Email: {garoui.nassreddine, anisjarboui}@yahoo.fr
Received February 17, 2012; revised March 13, 2012; accepted March 20, 2012
Keywords: Cognitive Mapping; Causal Algebra; Causal Relationships
ABSTRACT
This paper takes the basic mathematical operations required to manipulate the cognitive maps. This paper start by presenting all the values that a causal relationship can take. By the using of causal algebra, cognitive map (CC) become not only a graphical representation of a person’s beliefs, an agent or a particular area but also can capture the causal relationships existing between the concepts of a given system in a simple manner. Cognitive maps do not use a conventional algebra; algebra causal is needed to treat.
1. Introduction
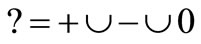
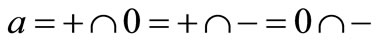
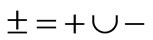
Causal algebra in cognitive maps plays a critical role in the analysis. Improving causal algebra in cognitive maps to model complicated situations has been one of the major research topics in this area. In this paper we propose a causal algebra which can improve representation of mental models. We use the causal algebra to manipulate the cognitive map. Generally, the basic elements of a CM are simple. The concepts an individual uses are represented as points, and the causal relationships between these concepts are represented as arrows between these points. This representation gives a graph of points and arrows, called a cognitive map. The strategic alternatives, all of the various causes and effects, goals and the ultimate utility of the decision-making agent can all be considered as concept variables, and represented as points in the causal map. Causal relationships can take on basic values +, – and 0 ([1]and taken from [2]). With this representation, it is relatively easy to see how concepts and causal relationships are related to each other and to see the overall causal relationships of one concept with another.
2. Literature Review
In this section we will establish the basic mathematical operations required to manipulate the cognitive maps. We will start by presenting all the values that a causal relationship can take.
2.1. Values of the Causal Relationships
The description of classical cognitive maps comes mostly from [3] and [4]. Generally, causal links (causal relations) between two concepts i and j have one of the eight values indicated in Table 1.
A causal map is a directed graph that represents an individual’s (an agent, a group of agents or an organization) assertions about its beliefs with respect to its environment. The components of this graph are a set of points (the vertices) and a set of arrows A (the edges) between these points. A point represents a concept (also called a concept variable in the sequel), which may be a goal or an action option of any agent. It can also represent the utility of any agent or the utility of a group or an organization, or any other concept appropriate to multiagent reasoning. An arrow represents a causal relation between concepts, that is, it represents a causal assertion of how one concept variable affects another. The concept variable at the origin of an arrow is called a cause variable and that at the end point of the arrow is called the effect variable.
We have already seen that there are three basic types of causal relationships: . But for a more comprehensive set of causal relationships is an overview of the eight resulting values of all possible logical combina-
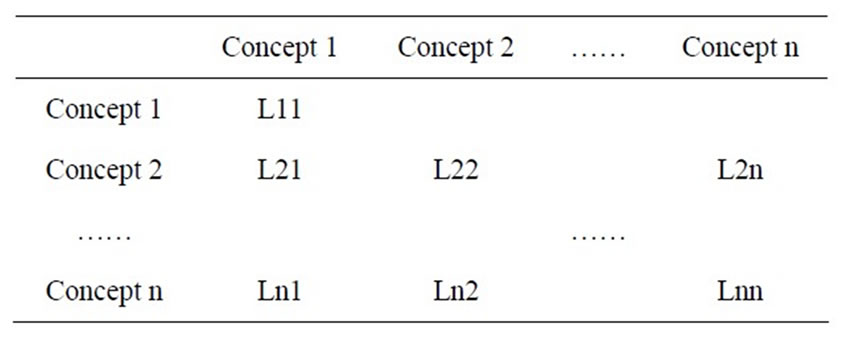
Table 1. Adjacency matrix.
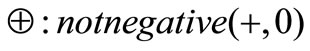
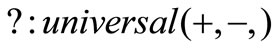
tions of positive, negative and zero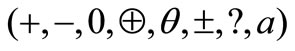 , where
 ;
;
 ;
;
 ;
;
 ;
;
 ;
;
 ;
;
 ;
;
 .
.
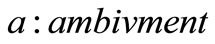
If for any two concepts there are more of a relationship to describe the effect that A to B, then we must make the intersection of all values for a single relationship. For example, the intersection of + and – is represented by a, ambivalence. That is, if a person or an agent that “A promotes B” and also said that “A is harmful to B”, while in the cognitive map is represented the relation of A to B as ambivalent. This type of reasoning is based on the rules for operations, in this case: the addition.
2.2. Operations
There are four types of operations defined for causal relationships: addition , multiplication
 , union
  and intersection
 .
.
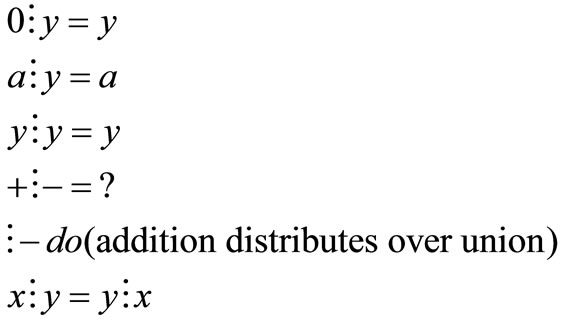
The addition is used when two or more arcs with the same starting point and end with the same point. This will add up all the direct effects for only one outcome total. Here are the rules for addition:

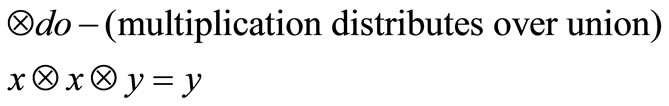
The multiplication is used to calculate the indirect effects of a map [1,2]. The rules of multiplication are used:

Laws for the operations of union and intersection are obtained from the set of values


3. Research Methodology
3.1. Description of the Empirical Investigation
To meet the research objectives mentioned above, a survey was conducted among players in the company of Tunisia. I have chosen as exploratory approach using multiple case studies. The multiple case studies seek a better understanding of the phenomenon. They are to study a phenomenon in its natural setting by working with a limited number of cases. They are particularly interesting in the case of exploration of little-known phenomena. The case studies thus allow multiple accounts the specificities and characteristics of corporate governance. The data is from 10 firms. The decision to base my study on a sample of firms from various sectors is based on the assumption that a variety of issues will be addressed as well. The output is a cognitive map for actors reflecting their perceptions.
The method used to create cognitive maps is the questionnaire.
3.1.1. Presentation of the Questionnaire
The questionnaire is divided into two parts: the first identifies the company and the second deals with corporate governance. For the second part, relating to corporate governance, we interview actors from the firm on stakeholder approach of corporate governance by providing a list of concepts for each approach with systematic exploration grids and matrices cross. Systematic exploration of the grid Figure 1 is a technique for collecting materials. Each player is encouraged to explore their own ideas or cognitive representations in relation to its strategic vision. The subject is asked to identify important factors that he said will have an impact on the key concept related to an approach to corporate governance.
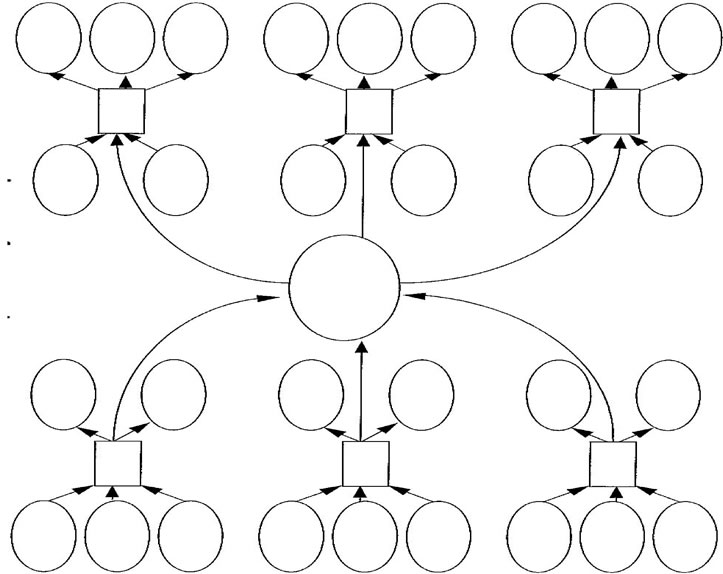
Figure 1. Grid systematic exploration.
Regarding the cross-matrix (Table 1), it is also a technique of data collection and the basis for the construction of the cognitive map. The matrix is presented in the form of a table with n rows and n columns. Box of index (i,j) indicates the relationship between concept i and concept j. The actors manipulate the key concepts and assign pairs of concepts depending on the nature and degree of proximity sensed between these concepts. Causal relationships can take on basic values +, – and 0.
3.1.2. Proposal for Modeling Cognitive Maps
When it is difficult to identify the goals, an integrated approach of performance provides a holistic view in which the performance is analyzed by the processes that lead, through the performances of the actors. These representation processes are two problems of implementation: the sharing of representations of actors and the identification of dominant representations in the organization in order to act upon them. The construction of this representation necessarily requires a model that allows understanding to act is “an action of intentional design and construction, for composition of symbols, patterns that would make a complex phenomenon intelligible perceived.
In this context, the use of cognitive maps seems relevant, because they can take into account the complexity and comprehensiveness of the system in which [the behavior] is embedded, while maintaining access to the analysis” [5]. The value of the tool is instrumental [6], it allows both improving their actions and making sense. Cognitive mapping is used as a tool for representation of an idiosyncratic schema [7], a pattern is “a cognitive structure that guides the cutting of reality, the interpretation of events, and action individuals”, pattern unique to each individual, causing it to have its own behavior.
3.1.3. The Construction of Cognitive Maps
We will see at first step that allowed the construction of concepts, methodological approach that we discuss. Then we will examine how the cards were dealt.
3.1.4. Concepts
We addressed this issue by the representations constructed by players using the method of cognitive maps, a method that can be applied to poorly structured situations. An analysis based on cognitive maps can understand this process of structuring, as this model is to build or rebuild the mental simultaneously modeling. This construction takes the form of a structure, carrier for clarification. It helps to identify ways to implement to achieve a given goal, the same way it helps to identify the goals justifying the use of such means. Finally, it facilitates communication and negotiation. There are two major trends in the construction method of the cards: the determination of the concepts can be ex ante, or subsequent interviews with respondents for whom the cards are built. The emphasis is on describing the world from the experiences of people who experience it. Nodes and links are determined directly by the participants that advocate [8], not to deprive the subject of representations: the questions should be invitations for the respondent verbalizes his thoughts on what he considers important subject of research. In addition, the researcher cannot force the subject to consider every possible link because the links must be made spontaneously or in response to open questions, so that the subject constructs its reality. In the normative paradigm, the universe is more or less determined. The focus is on operational definitions and research plans reproducible. Observers, different participants, may determine the relationship between variables and nodes that can be. Table 2 gives 19 concepts selected for the governance approachs to their ability to describe the field of governance. We were guided in this by a literature review and an exploratory study based on a questionnaire made up of grids of systematic exploration and crossmatrices.
4. Stakeholder Approach: Application of Causal Algebra
Tables 3 and 4 define cross matrix, used as a source base by trying to apply the causal algebra on two case studies. All eight resulting values of all possible logical combinations of positive, negative and zero: where
where
 ;
;
 ;
;
 ;
;
 ;
;
 ;
;
 ;
;
 ;
;
 .
.
4.1. Addition of Cross Matrices
The addition of the matrices is defined for two matrices of the same type. The sum of two matrices of type  and
and , denoted by
 , is again a matrix
  type
type  obtained by adding corresponding elements. For all
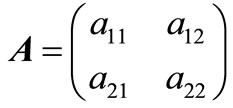

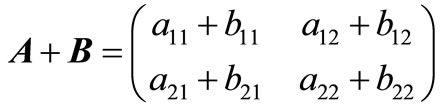
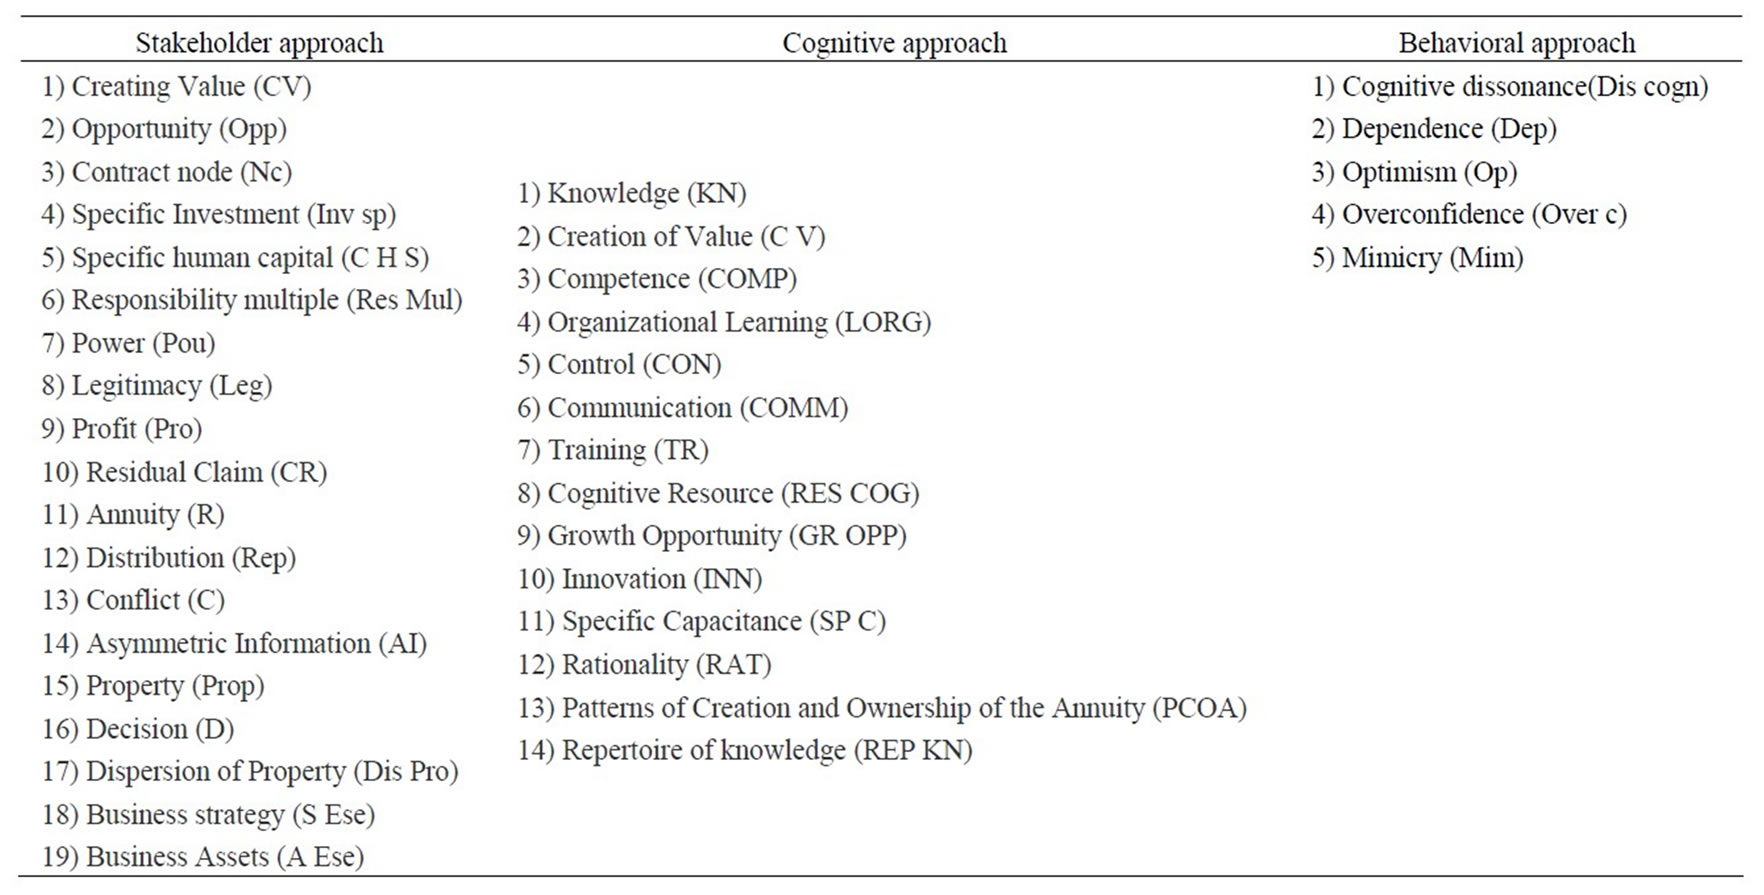
Table 2. Key concepts.

Table 3. Matrix influences taking into account three relations: +, – and 0 (case 1 stakeholder approach of corporate governance).

Table 4. Matrix influences taking into account three relations: +, – and 0 (Case 2 stakeholder approach of corporate governance).
We will try to add the two matrices respecting the different logical combinations of possible causal relationships. Table 5 gives value based on this operation.
Table 6 gives the following notations.
Table 7 is the result of application of algebra and the causal summation rule.
4.2. Cross-Multiplication of Matrices
For two matrices of the same type, the product of two matrices  and
and  type
type  noted
noted , is a matrix type
  given by
  .
.
Condition: the product of two matrices is only possible if the number of lines of the first equals the number of columns in the second and the number of columns of the first number is equal to the second line. The number of rows of the result is equal to that of the first matrix; the number of columns is equal to that of the second.
We will try to add the two matrices respecting the different combinations possible of logical causal relations. Table 8 gives values with respecting multiplication operation.
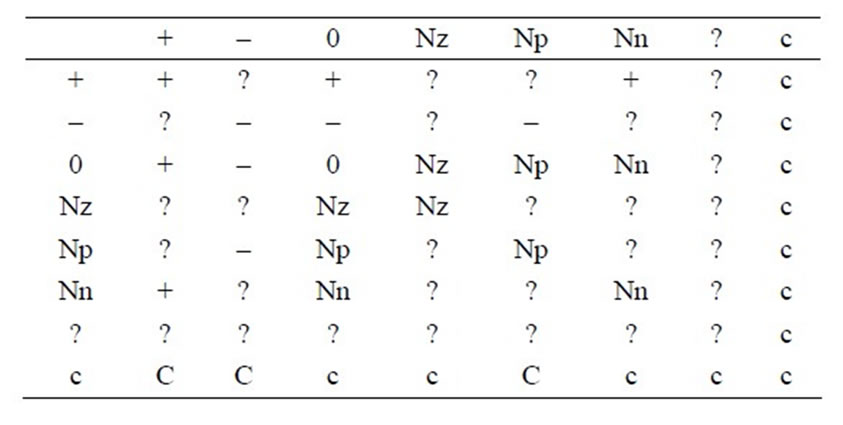
Table 5. Addition values.

Table 6. Notations.
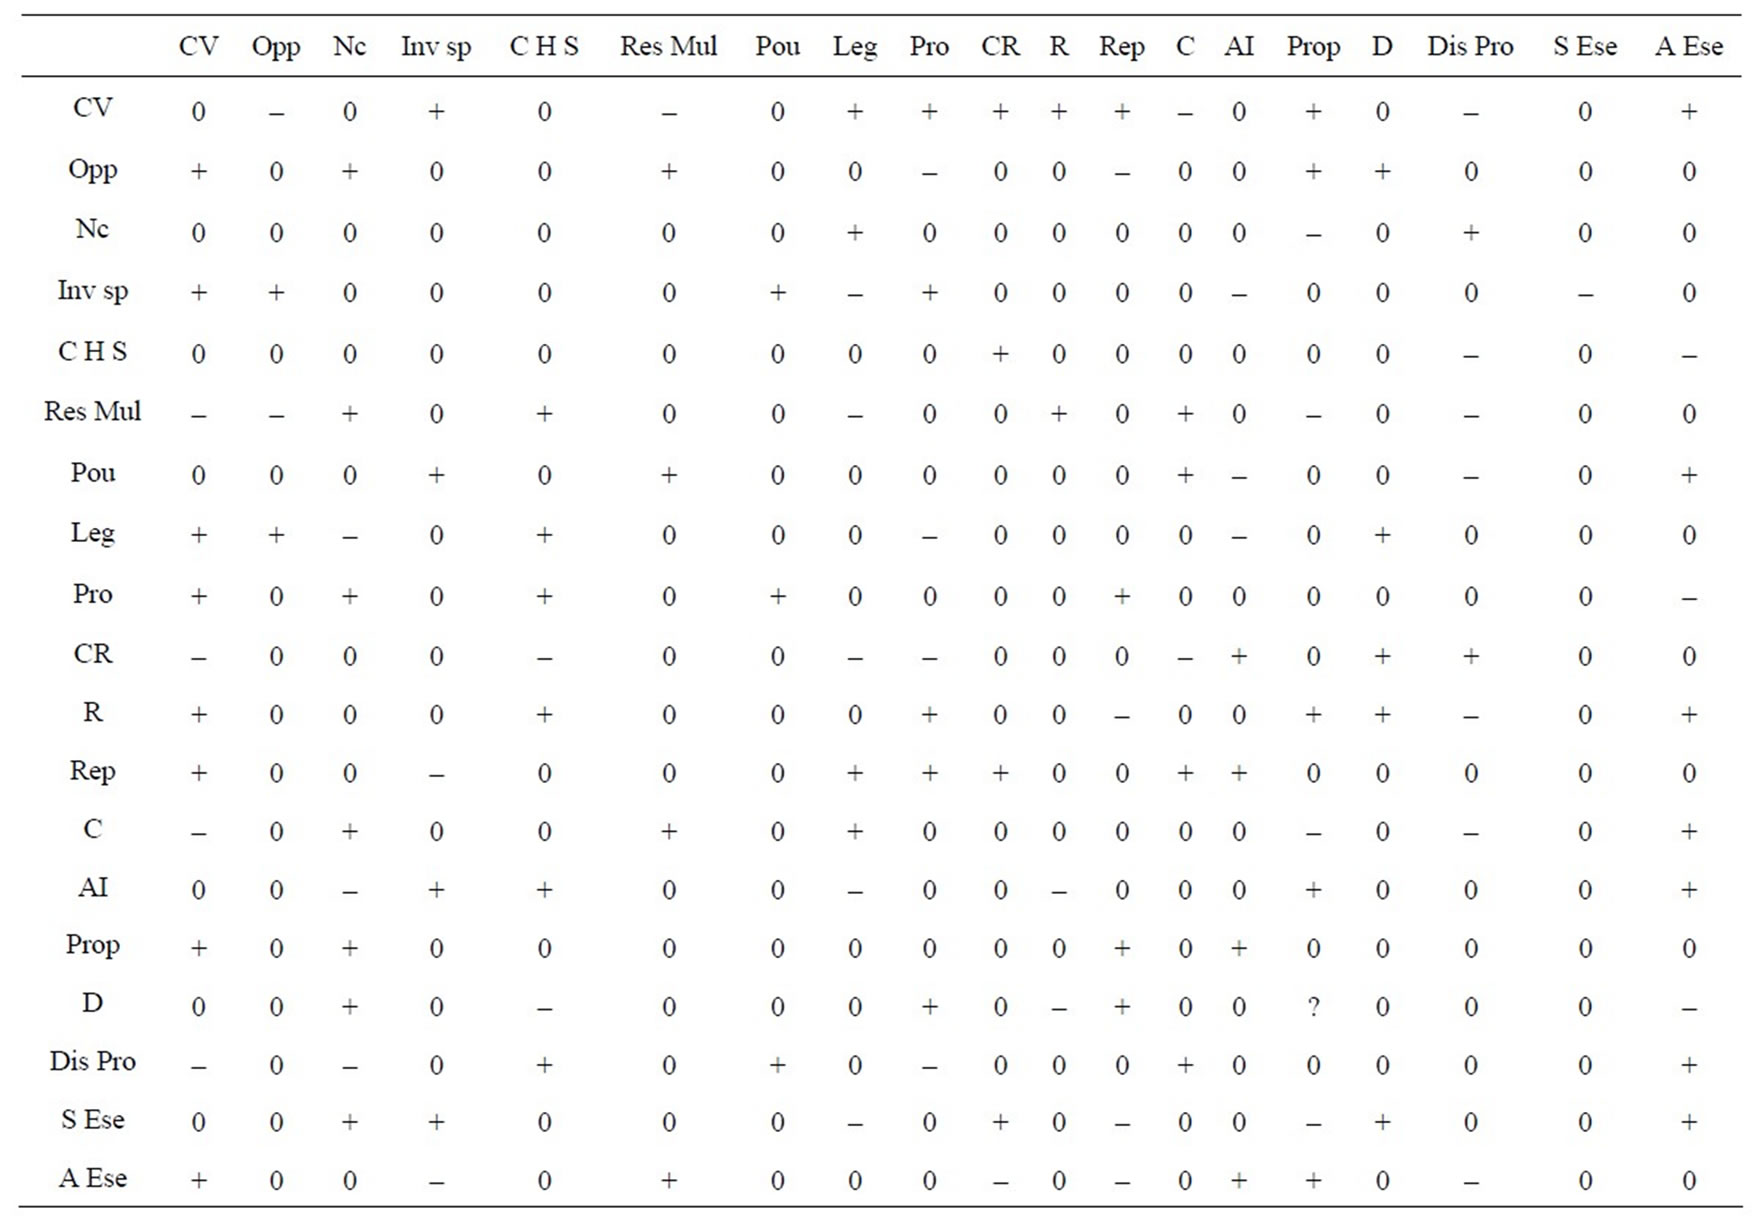
Table 7. Matrix crossed with the application of algebra and the causal summation rule.
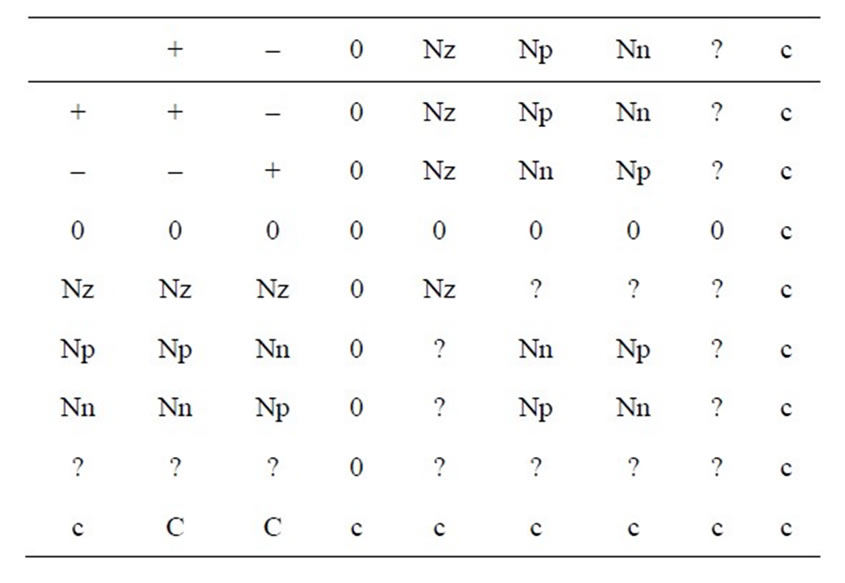
Table 8. Multiplication values.
Table 9 is the result of the application of algebra causal and the multiplication.
5. Cognitive Approach: Application of Causal Algebra
All eight resulting values of all possible logical combinations of positive, negative and zero: , where
 ;
;
 ;
;
 ;
;
 ;
;
 ;
;
 ;
;
 ;
;
 .
.
Table 10 define values matrix taking into account the influences of three relations: +, – and 0.
Table 11 define values matrix taking into account the influences of three relations: +, – and 0.
Table 12 gives the results by the application of algebra and the causal rule of addition.
Table 13 gives the results by the application of algebra and the multiplication rule.
6. Behavioral Approach: Application of Causal Algebra
Table 14 gives the values of direct influences taking into account three relations: +, – and 0 in the case 1.
Table 15 gives the values of direct influences taking
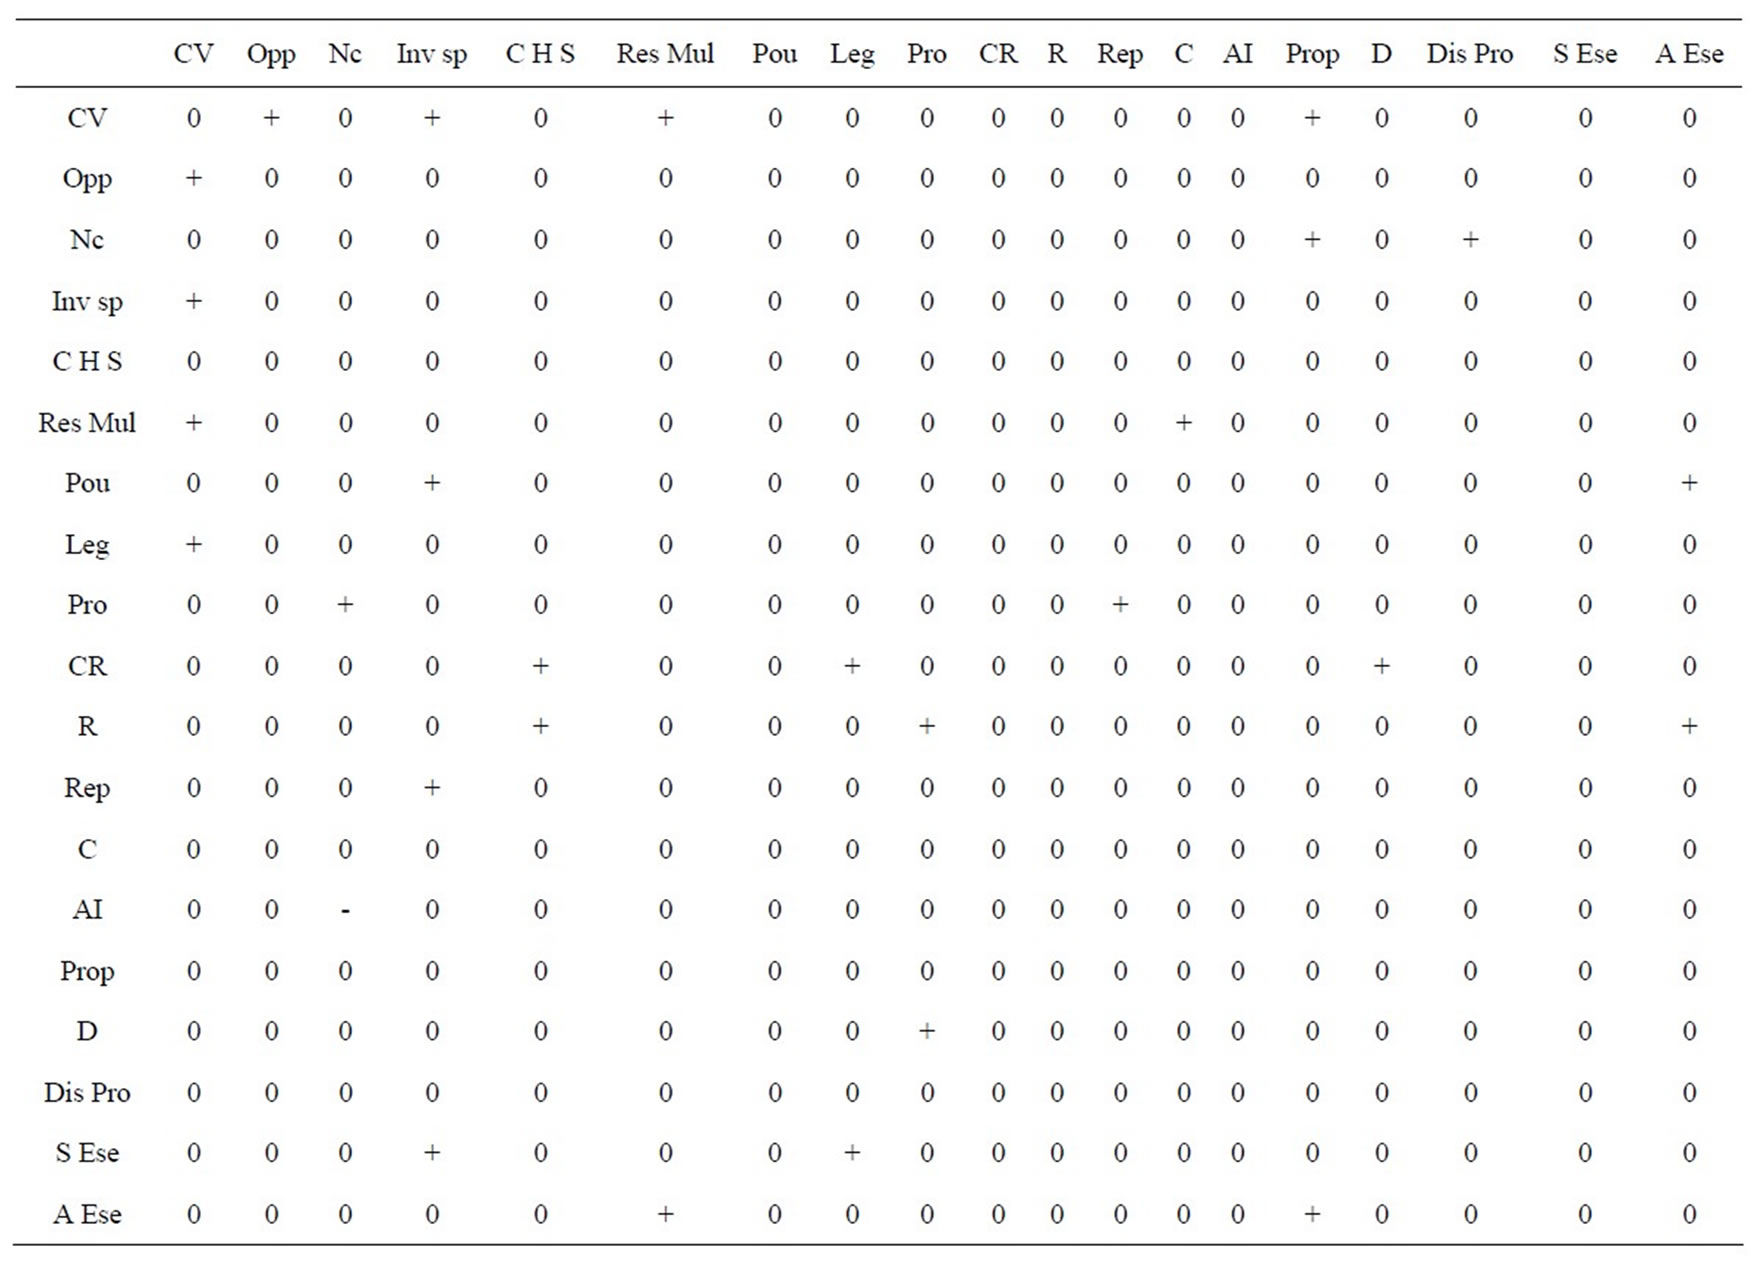
Table 9. Matrix crossed with the application of algebra causal and the multiplication.
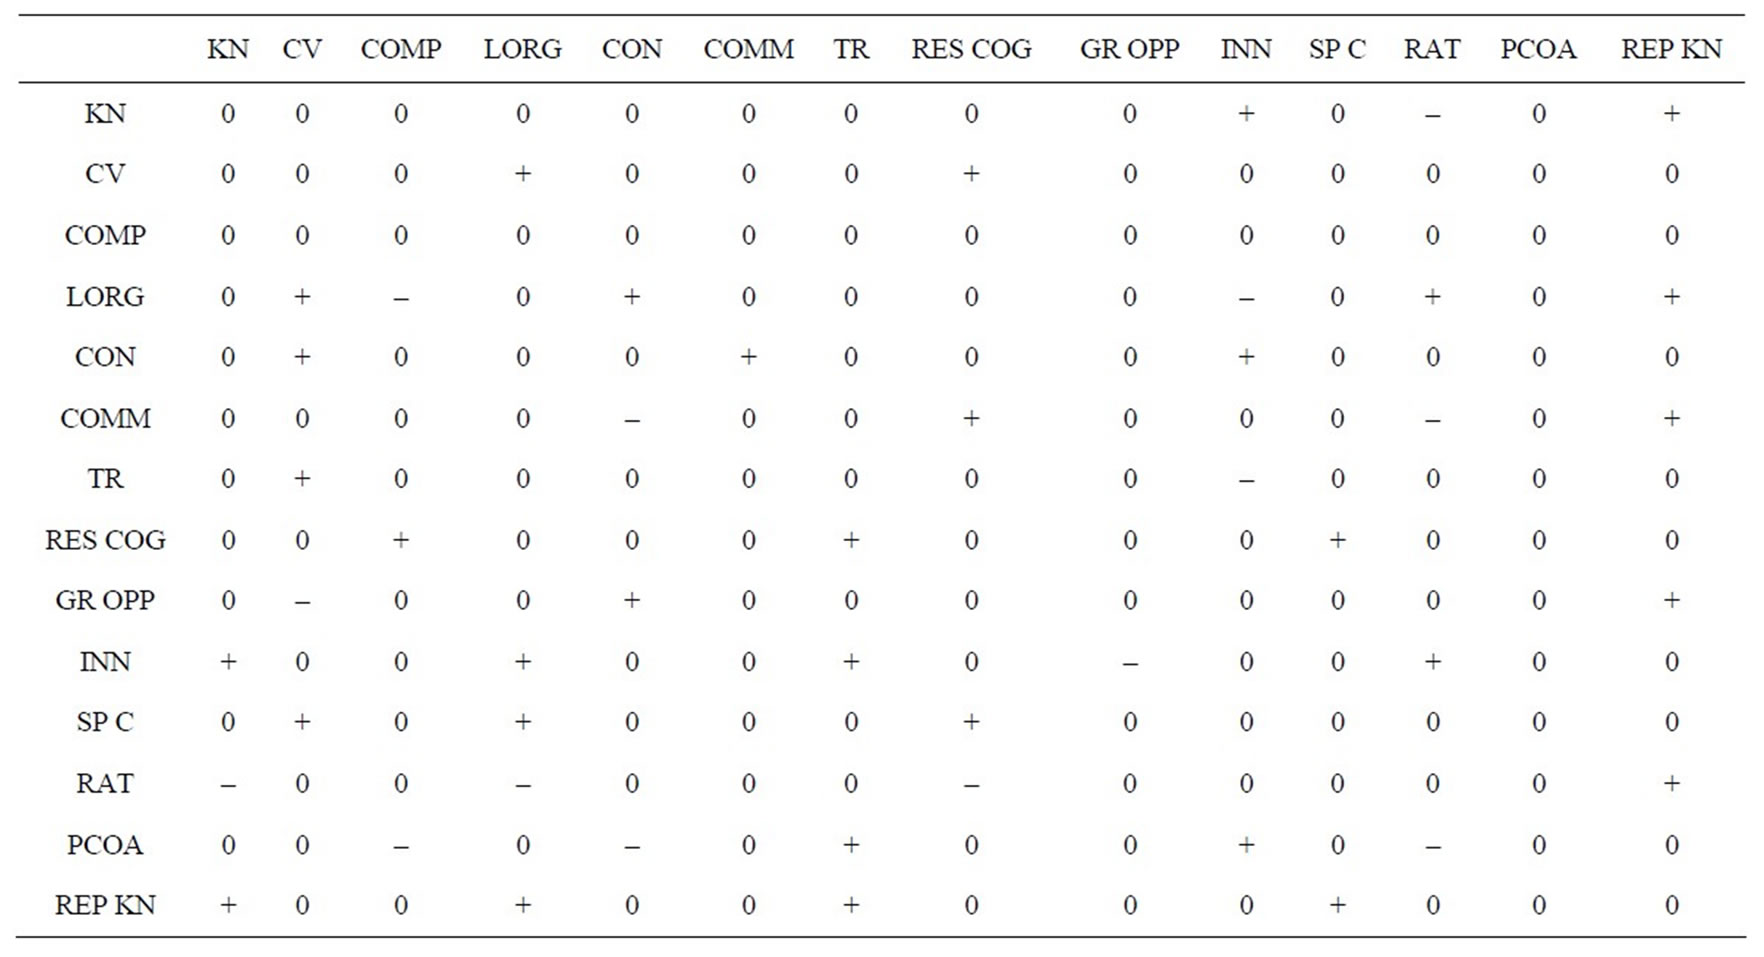
Table 10. Matrix taking into account the influences of three relations: +, – and 0 (Case 1 of the cognitive approach).
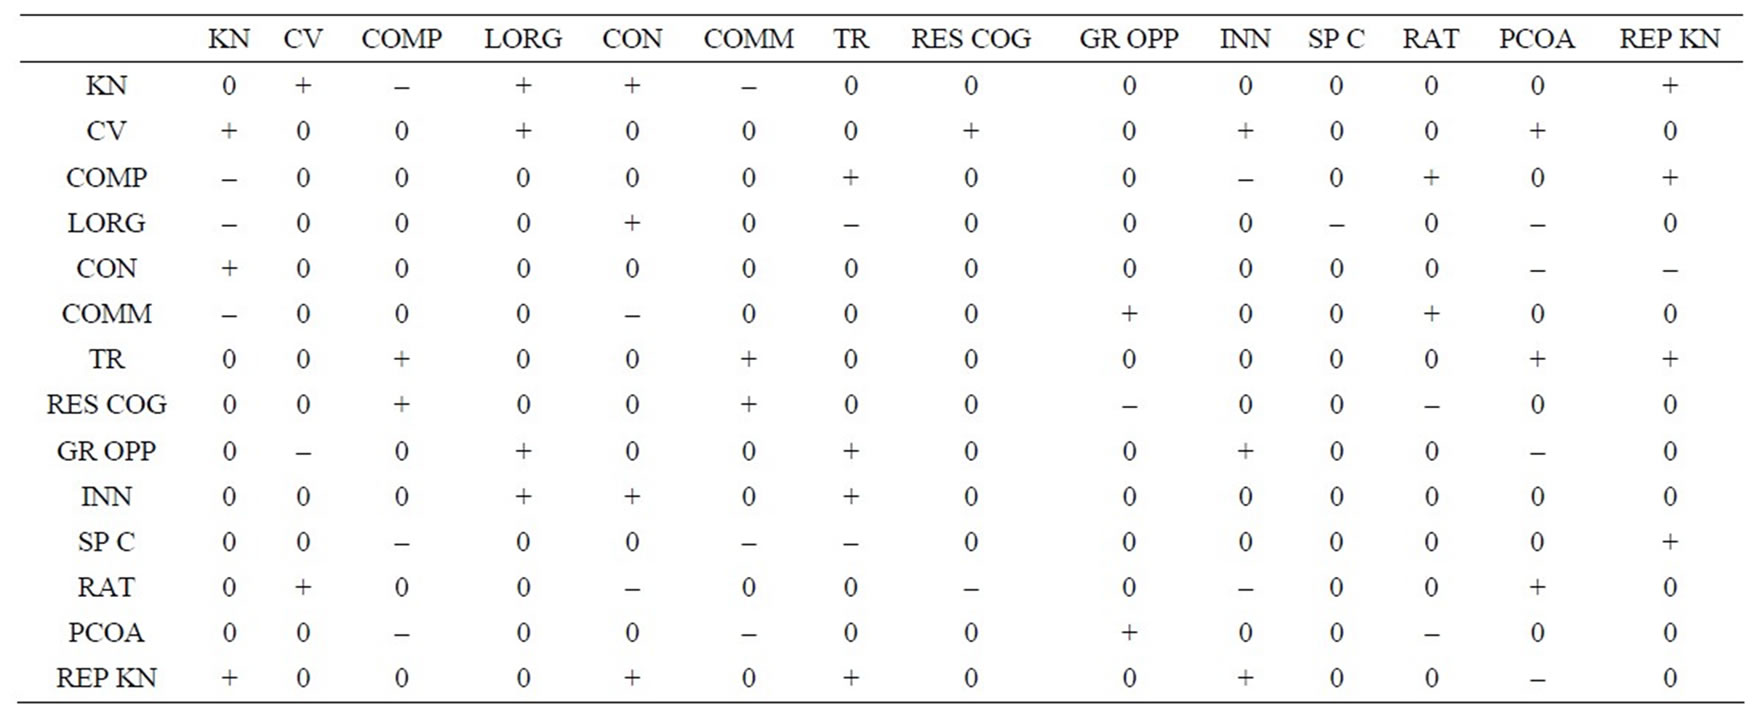
Table 11. Matrix of direct influences taking into account three relations: +, – and 0 (Case 2 of the cognitive approach).
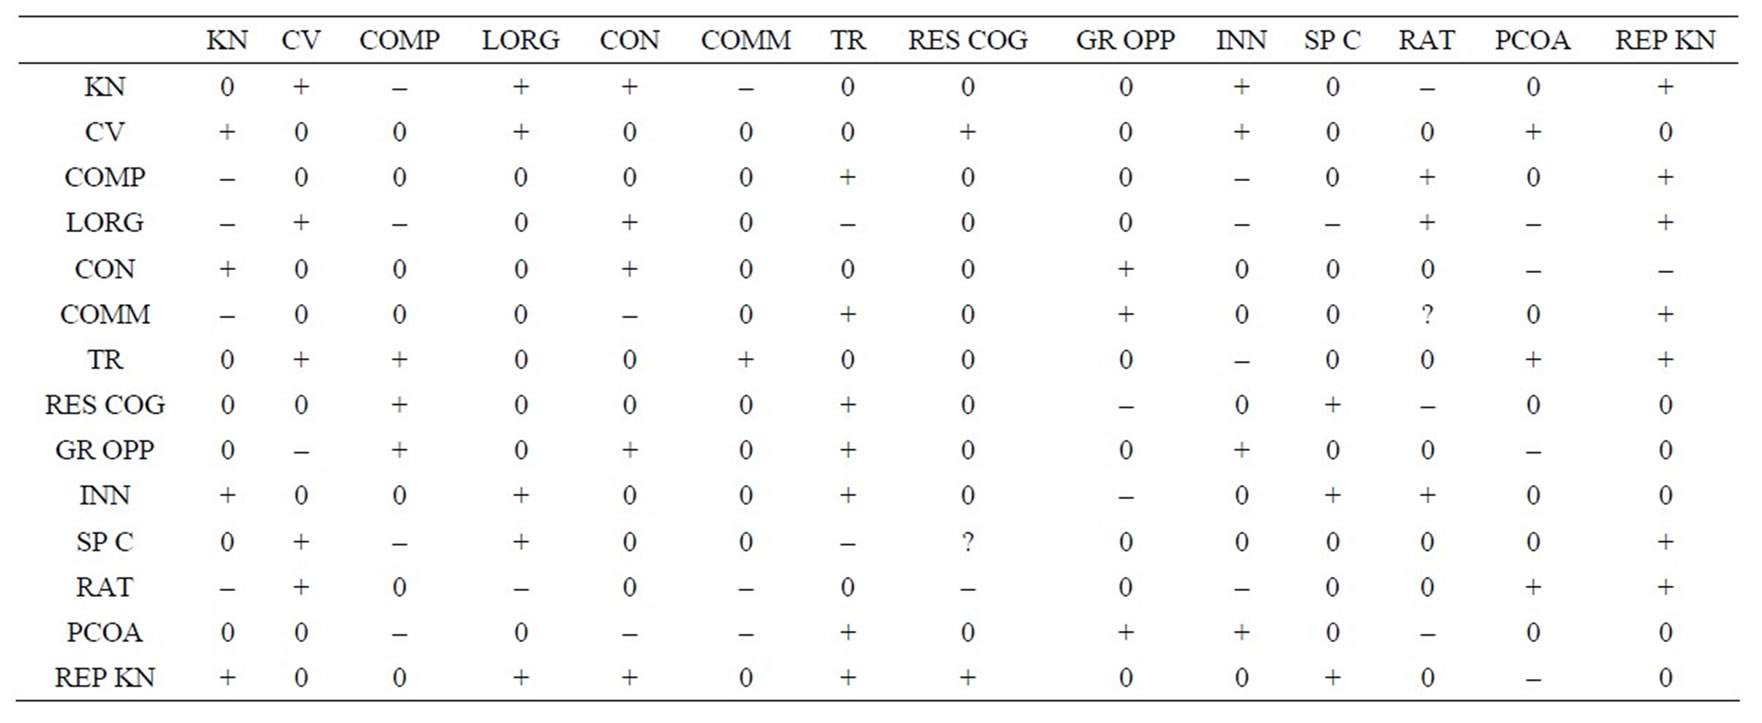
Table 12. Matrix crossed with the application of algebra and the causal rule of addition.
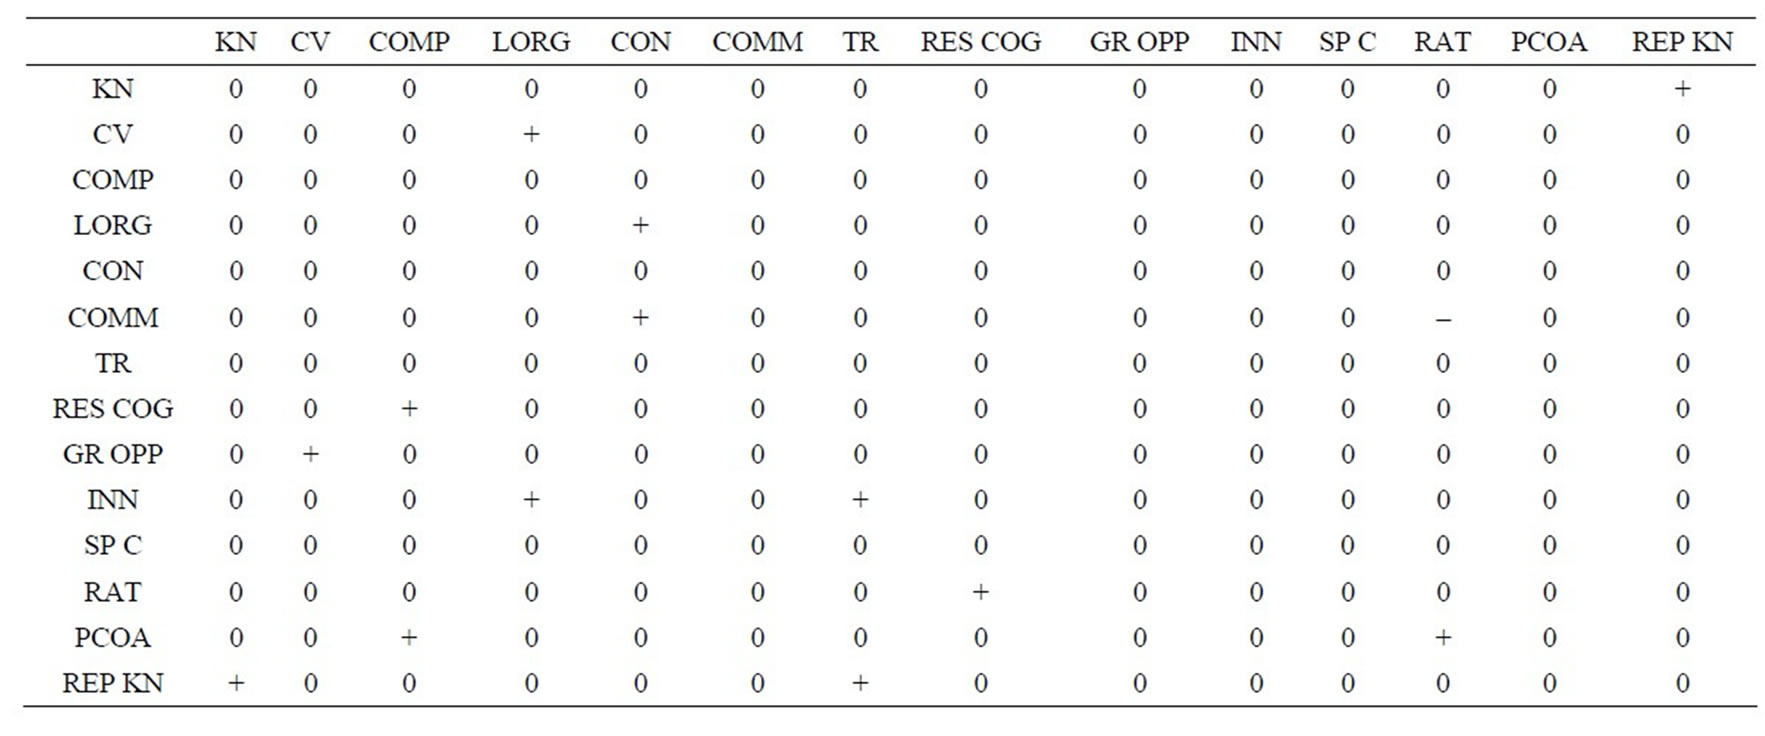
Table 13. Matrix crossed with the application of algebra causal and the multiplication rule.
into account three relations: +, – and 0 in the case 2.
Table 16 gives the matrix results crossed with the application of causal algebra and the rule of addition.
Table 17 gives the matrix results crossed with the application of causal algebra and the multiplication rule.
7. Conclusions and Implications of the Research
The benefit of cognitive maps is that they are based on a mathematical basis, which makes their results more reliable and faithful.
The use of causal algebra is advantageous in terms of cognitive maps. Indeed one can enumerate the following benefits:

Table 14. Matrix of direct influences, taking into account three relations: +, – and 0 (case1de behavioral approach).
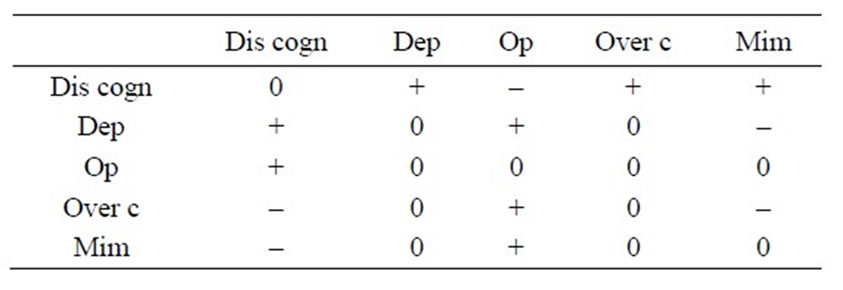
Table 15. Matrix of direct influences taking into account three relations: +, – and 0 (Case 2 of the behavioral approach).

Table 16. Matrix crossed with the application of algebra and the causal rule of addition.
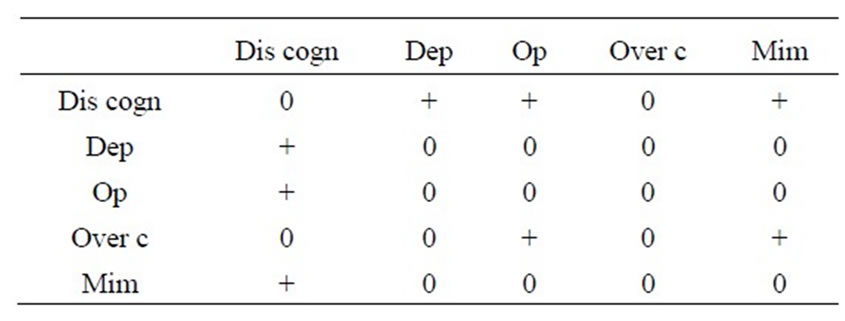
Table 17. Matrix crossed with the application of algebra causal and the multiplication rule.
1) The causal assertions contain the best way to understand how the world is organized.
2) Causality is the first idea to assign an explanation of events.
3) To choose among several alternative actions imply a causal assessment.
In this application we tried to apply algebra on two causal cognitive maps of two companies using the rules of addition and multiplication which aims to bring together and thought patterns and find a convergence in understanding the concepts Government’s key businesses. Through the use of algebra one can find a causal mental pattern common among actors from different companies.
Finally, we can say that a cognitive map (CC) is a graphical representation of a person’s beliefs, an agent or a particular area. The aim is to capture the causal relationships existing between the concepts of a given system in a simple manner.
Cognitive maps not use a conventional algebra; algebra causal is needed to treat.
REFERENCES
- M. Wellman, “Inference in Cognitive Maps,” Mathematics and Computers in Simulation, Vol. 36, No. 2, 1994, pp. 137-148. doi:10.1016/0378-4754(94)90028-0
- A. Levi and P. E. Tetlock, “A Cognitive Analysis of Japan’s 1941 Decision for War,” Journal of Conflict Resolution, Vol. 24, No. 2, 1980, pp. 195-211. doi:10.1177/002200278002400201
- K. Nakumara, S. Iwai and T. Sawaragi, “Decision Support Using Causation Knowledge Base,” IEEE Transactions on Systems, Man and Cybernetics, Vol. 12, No. 6, 1982, pp. 765-777.
- R. Axelrod, Ed., “Structure of Decision: The Cognitive Maps of Political Elites,” Princeton University Press, Princeton, 1976.
- J. M. Komocar, “Cartes Causales d’un Milieu de Travail,” In: P. Cossette, Ed., Cartes Cognitives et Organisations, éd. Eska, 1994, pp. 155-184.
- M. Audet, “Plasticity, Instrumentality and Reflexivity,” In: P. Cossette, Ed., Cognitive Maps and Organizations, Collection “Business Administration”, Quebec/Paris: The Laval University Press/Editions ESKA, 1994, pp. 187-198.
- P. Cossette, “The Cognitive Maps of Service Study Organizations,” In: P. Cossette, Ed., Cognitive Maps Organizations and Collection “Administrative Sciences”, The University Press Laval/ESKA Publishing, Quebec/Paris,1994, pp. 3-12.
- P. Cossette and M. Audet, “What is a Cognitive Map?” In: P. Cossette (Eds.), Cognitive Maps and organizations, Collection “Business administration”, Presses de l’Université Laval/Publishing ESKA, Quebec/Paris, 1994, pp. 13- 33.