Modern Economy
Vol. 3 No. 1 (2012) , Article ID: 16831 , 10 pages DOI:10.4236/me.2012.31012
Industry Orientation, Exporting and Productivity
1Department of Economics, Anadolu University, Eskisehir, Turkey
2Working Lives Research Institute, London Metropolitan University, London, UK
3Department of Economics, Anadolu University, Eskisehir, Turkey
Email: ykilicaslan@anadolu.edu.tr
Received October 17, 2011; revised November 29, 2011; accepted December 21, 2011
Keywords: Learning by Exporting; Exporting; Productivity; Manufacturing; Turkey
ABSTRACT
This paper aims to analyse the relation between exporting behaviour of the firms and productivity by testing for learning by exporting hypothesis in Turkish manufacturing industry. Moreover, this study examines whether exporting and productivity relations change with respect to the orientation of industry in which the firm operates. We use the data on the largest 1000 industrial enterprises of Turkey from 1997 to 2007. The results based on unbalanced dynamic panel data models estimated show that there is no evidence that exporting fosters productivity at the firm level in Turkish manufacturing industry. Disaggregation of industries with respect to their orientations does not change this result. Exporting, or increase in the exports of the firm, doesn’t seem to be one of the sources of productivity growth at least for the firms already exporting in Turkish manufacturing.
1. Introduction
Exporting has always been considered as important as production for two reasons: First, exporting is assumed to be one of the indirect sources of productivity growth which is a vital factor for economic growth. The idea behind this assumption is the fact that both learning and scale effects arising from exporting activity of the firm foster productivity. Second, it is one of the most important ways of overcoming balance of payment constraints for an economy that is usually believed to be an obstacle for sustainable economic growth especially for developing countries. Exporting activities, thereby, has always been favoured and supported by the government and institutions both national and international especially in developing economies.
This paper focuses on the relation between exporting behaviour of the firms and productivity by analysing the presumption that exporting makes firms more productive on which there is very few evidence. More specifically, this paper will test learning by exporting hypothesis, one of the two main assumptions on the relation between exporting and productivity, for Turkish manufacturing industry. Moreover, this hypothesis is tested for the firms operating in different oriented industries of manufacturing in order to explore if learning effects arising from exporting activity differs with respect to the orientation structure of the industry. To the best of our knowledge, this is the first attempt to test this hypothesis for the firms operating in industries with different orientations.
There are only a few studies examining exporting productivity nexus in Turkish manufacturing at the firm level [1-3]. However, these studies concentrate on only a few sub-industries of manufacturing, textile and apparel and motor vehicles and parts. In fact, the relation between exporting behaviour and productivity may well change with respect to the firms operating in industries with different orientations. This study, therefore, expected to contribute to the literature on exporting and productivity performance by investigating the existence of the relation between exporting and productivity at different oriented industries of Turkish manufacturing.
The data used in the analysis are obtained from the largest first and second 500 industrial enterprises of Turkey published annually by the Istanbul Chamber of Industry (ICI) and cover the period of 1997 to 2007 [4,5]. These firms are quite important in Turkish economy due to the fact that they produce 14.2 percent of Turkish GNP and 64.5 percent of aggregate manufacturing value added [6]. Moreover, more than 60 percent of aggregate Turkish exports are made by these firms.
The results based on unbalanced dynamic Generalised Method of Moments (GMM) panel data models estimated show that there is no statistically significant evidence of learning effects arising from exporting activity in Turkish manufacturing firms between the years 1997 and 2007. Moreover, this finding does not change with respect to the firms operating in industries with different orientations.
Organisation of the paper is as follows: In the next section, we discuss the theoretical background on the relation between exporting and productivity and review the literature. In section three, exporting and productivity association is examined descriptively. In section four, we introduce the econometric methodology and test for the hypothesis of learning by exporting. In section five, we present and discuss the results of the estimated models. Finally, we conclude in the last section.
2. Exporting and Productivity: Theoretical Background and Literature
Exporting has always seen as a good thing for both firms and countries and supported by both researchers and policy makers. Until recently, the relation between exporting and productivity has been examined at the more macro level. After 1990s, however, with the seminal work of Bernard and Jensen’s (1995) [7], productivity and exporting relations were started to be examined at the firm level. The first question to be answered was the direction of causality: whether higher productivity triggers exporting or exporting leads to further productivity gains. The answer to this question brought about the two main assumptions on the link between exporting and productivity:
The first is called “self-selection hypothesis”. This hypothesis assumes that higher productivity leads to exporting. According to self selection hypothesis, only more productive firms are able to engage in exporting activities. The reason for this is that exporting requires both overcoming the sunk cost of entry into export market and survival in an intensively competitive international market after entry [8, p. 399], [9, p. 60], and [1, p. 397]. These sunk costs include “transportation costs, expenses related to establishing a distribution channel or production costs to modify products for international markets” [10, p. 608]. Only relatively more productive firms could overcome these high sunk costs and enter into the exports market.
There is a number of quite significant evidence favouring the self-selection hypothesis [10-12]. Many studies were conducted for different countries: Significant evidence of self selection hypothesis were found by Bernard and Jensen (1999) [13] for the US and Roberts and Tybout (1997) [14] for Colombian manufacturing industries. Isgut (2001) [15], Delgado et al. (2002) [8] and Fariñas and Martín-Marcos (2007) [16] concluded that selfselection hypothesis holds for Spanish manufacturing industry. Similarly, the findings of Aw et al. (2000) [17] for Taiwan and Hahn (2004) [18] for Korea support this hypothesis. Finally, Bernard and Wagner (1997) [19], Wagner (2002) [20], Arnold and Hussinger (2005) [21] reached the conclusion supporting this hypothesis in German manufacturing industry. All these findings show that self-selection hypothesis holds for manufacturing industries of most countries.
The second assumption on the relation between exporting and productivity is “learning by exporting hypothesis”. According to this hypothesis, exporting fosters productivity due to “learning effects” arising from exporting activity of the firm. These learning effects include acquiring knowledge from best practises and receiving feedback from international costumers and suppliers [22, p. 70] and [2, p. 677]. In addition to these learning effects, exporters may take the advantage of higher capacity utilisation and economies of scale driven by the international demand depending on the industry in which they operate [10, p. 608] and [16, p. 619]. This second effect of exporting may be called as “scale effects”.
The evidence on the learning and scale effects arising from exporting, or learning by exporting hypothesis, is quite mixed and differs from country to country as compared to self-selection [23]. Clerides et al. (1998) [12], for instance, find evidence learning by exporting for Morocco. They, on the other hand, find no evidence of learning effects resulting from exporting activity in Mexico and Colombia. Blalock and Gertler (2004) [24] find evidence of learning from exporting attributable to knowledge and efficiencies gained from participation in international markets. Van Biesebroeck (2005) [25] examines a panel of manufacturing firms in nine Sub-Saharan countries and finds evidence of learning by exporting. His results indicate that exporters in these countries are more productive than non-exporters and more importantly, the firms increase their productivity advantage after entry into the export market. Salomon and Shaver (2005) [26] show that not only learning by exporting hypothesis holds for Spanish manufacturing firms but also find evidence of association between exporting and innovation. Girma et al. (2004) [27] conclude that exporting firms in the UK are generally more productive than non-exporters and they do self-select. However, they also suggest that entry does not make them any more productive meaning that learning by exporting does not hold in the UK manufacturing. Girma et al. (2005) [28] found that exporting firms tend to be larger, more productive and pay higher wages than non-exporters in the Swedish manufacturing. However, they found no evidence of preor post-entry differences at the firm level productivity.
The literature on the link between exporting and productivity in Turkish manufacturing industry is quite limited. There is a few studies testing for learning by exporting hypothesis. Yasar and Rejesus (2005) [1] suggest that learning by exporting may be the reason for the positive correlation between exporting status and firm performance in apparel-textile and motor vehicles and parts industries from 1990 to 1996 in Turkey. They argue that being in the export market exposes the plants to better technologies and more competition, which eventually improves its productivity levels. In another study, Yasar et al. (2006) [2] found that exporting firms that continuously exported have more pronounced productivity effects as compared to other exporting firms. They also stress the importance of productivity effects of exporting arising from scale effect in Turkish manufacturing. In a similar study, Yasar et al. (2007) [3] examines the presence of learning by exporting in two Turkish manufacturing industry, textile and motor vehicles and concludes that there is stronger learning by exporting effects in the textile than in motor vehicles industry. This study, on the other hand, aims to provide evidence on both overall manufacturing and sub-industries aggregated with respect to orientations of the industries by using a more recent database on Turkish manufacturing.
3. Trends in Exporting and Productivity: A Descriptive Analysis
This section presents descriptively the behaviour of exports and productivity of the manufacturing firms aggregated according to the orientations of the industries in which the firms operate. Labour productivity is measured as the real value added per worker. Two different measures of exporting activity are used: The first is export intensity measured as the share of exports in total sales from production, EXPINT. The second indicator of exporting activity of the firm is EXPORTIVITY measured as exports per employee in US dollars.
The ISIC-4 level industries are classified according to their orientations based on OECD (1992) [29] .The classification of the manufacturing industries into five categories is as follows: resource intensive, labour intensive, scale intensive, specialised supplier and science based industries. The list of industries in each group is given in Appendix. This classification, in fact, is based on the factor use in production. Therefore, they may as well reflect the differences in production technologies. The production of resource intensive industries crucially depends on natural resources such as food, paper or cement industries. Labour intensive industries such as textile, furniture and musical instruments use labour more intensively compared to the other industries. Scale intensive industries are those having large scale in production such as ship building, chemical industry and iron production. Specialised supplier industries are composed of the firms supplying special products such as agricultural machinery, radio, television and communication equipments. Lastly, goods such as drugs and medicines, office, computing and accounting machinery, and optical goods are produced by the firms operating in science based industry.
Figure 1 presents the evolution of productivity and exporting activity of the firms according to different industry orientations from 1997 to 2007. The charts may be interpreted as follows: First of all, the chart shows that productivity in aggregate manufacturing did not increase but showed small degree of decrease in the 2000s. The sharp decrease in productivity in 2001 is due to the economic crisis that Turkey experienced. The two measures of exporting indicate that exporting performance of the firms is better in the post 2000 than the pre 2000 period. The figure shows that about 30% - 40% of manufacturing output is exported. One interesting finding is that while export intensity has quite stable trend in the early 2000s and a decreasing trend especially in recent years, per worker exports has an increasing trend in the 2000s. Finally, the chart does not show clear evidence of the association between exporting and productivity.
In resource intensive industries, the share of exports in total sales does not change from 1997 to 2007; about 20% (see Figure 1). Productivity, on the other hand, has a decreasing trend by 2001 at first, but then approaches to the initial level of 1997. When exporting activity is measured as per worker exports, both variables have common trend except for the crisis year 2001. As in aggregate manufacturing, there is no clear evidence of exporting and productivity relation.
The first observation in labour intensive industry is that about half of the production is exported by the firms in labour intensive industries (see Figure 1). Productivity in this industry follows a similar pattern with that of resource intensive industries: It decreases sharply in the crisis year, then increases. However, this increase does not help enough to reach the pre-crisis period of productivity levels. The chart shows that while exporting in labour intensive industries of Turkish manufacturing has an increasing trend in the pre-crisis period, this trend turns to a diminishing pattern, especially in the last four years.
There are huge fluctuations in labour productivity in scale intensive industries from 1997 to 2007. Figure 1 shows that there has been radical and continuous increase in per worker exports, EXPORTIVITY, in this industry in spite of the fact that export intensity did not show any significant change in the same period. Although, the share of exports in output exhibited slight increase after 2001, it never reached to the level of 1999. Similar to the other industries already mentioned, it’s hard to say that the movements of productivity and exports in scale intensive industries are on the same direction.
The evolution of productivity in specialised supplier industries is quite similar with that of scale intensive industries with less fluctuation. It seems that this is the least effected industry from the crisis. The figure shows that export performance of this industry is outstanding. Both per worker exports and the share of exports showed quite significant improvements form 1997 to 2007 (see Figure 1). While the share of exports in output increased from about 20% to 40%, per worker exports has grown three folds in the 2000s in this industry. We observe a possible positive relation between exporting and productivity among
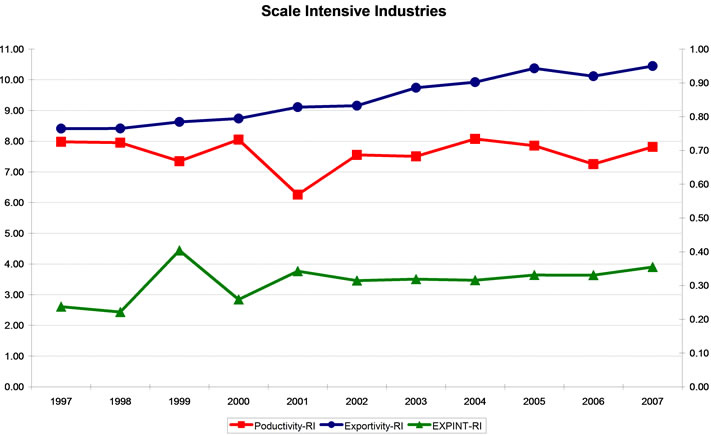
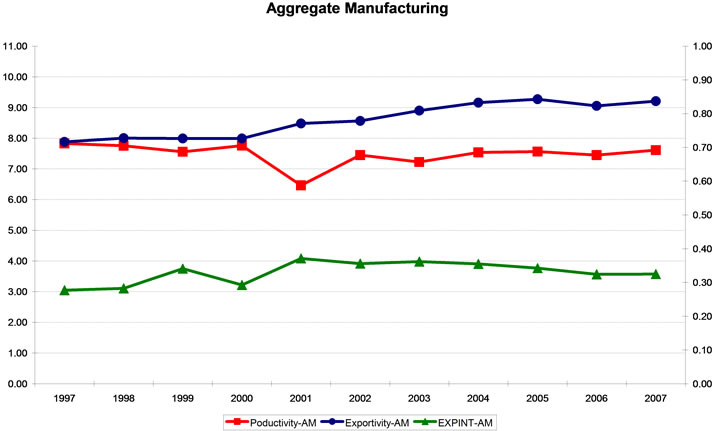
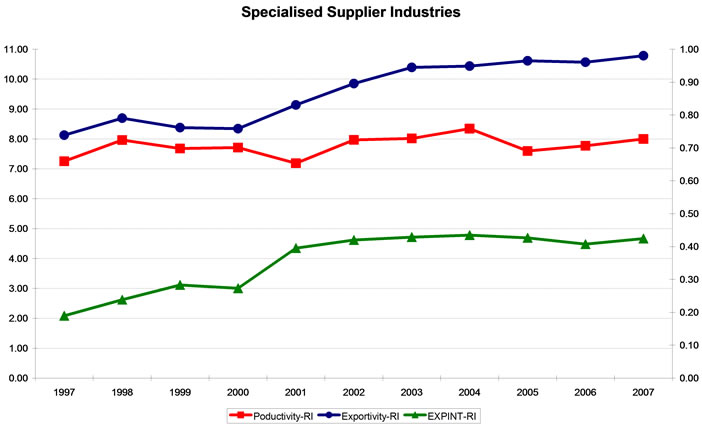
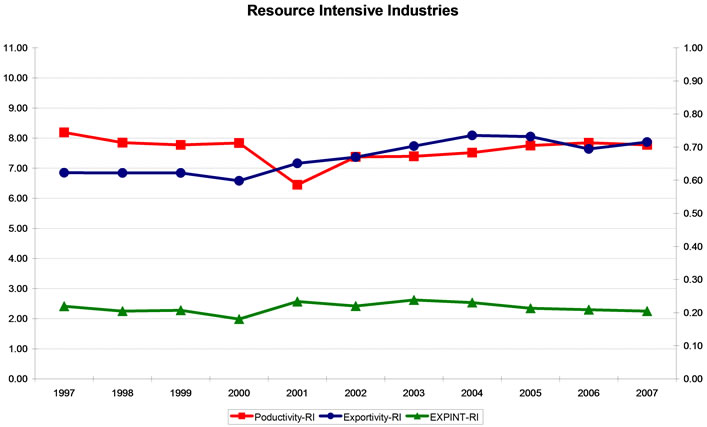
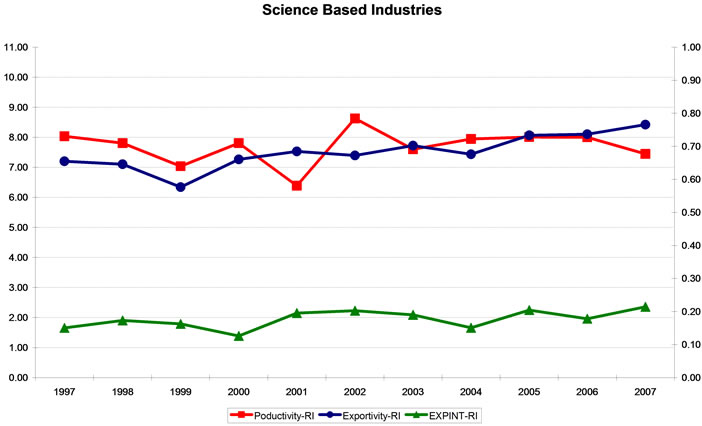
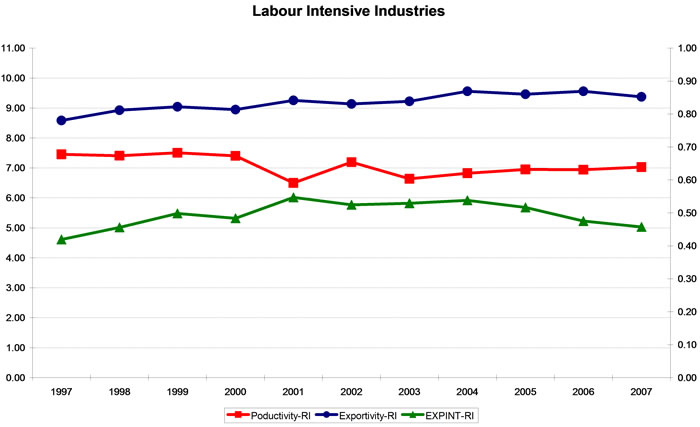
Figure 1. Productivity, exportivity and export intensity, 1997-2007.
Source: Authors’ calculations based on ICIa (2008) [4] and ICIb (2008) [5]. Note: Productivity is the log of real value added per worker. Exportivity is the log of exports per worker (in US dollars). EXPINT is the export intensity, in percentages, measured as the ratio of total exports to output. Productivity and exportivity are on the left, and export intensity is on the right axis.
the firms in specialised supplier industry to a smaller extent.
Exporting and productivity records of the firms operating in science based industries depicts that there is no relation between exports and productivity in this industry (see Figure 1). Productivity in this industry exhibits large fluctuations from year to year. This may be due to the fact that the number of firms in this industry is quite smaller as compared with other industries. Exports, on the other hand, are more stationary in this industry. Productivity and exporting records of the firms in science industry, however, do not show a strong positive relation between exporting and productivity.
In sum, all these descriptive observations on the evolution of exporting and productivity do not clarify the relation between these two variables. The only industry indicating a weak relation between exporting and productivity may be specialised supplier industry in which there seem to a positive association between exporting and productivity.
4. Econometric Methodology
Learning by exporting hypothesis can be tested by using a productivity equation augmented to account for the impact of exporting activity on labour productivity:
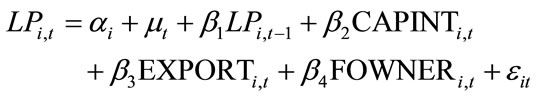 (1)
(1)
The dependent variable in the above equation, LPi,t, is the labour productivity of firm i at time t measured as the real gross value added per employee. mt and ai control for time and the unobserved firm specific effects. eit is the usual error term.
The first lag of LP included as a dependent variable in the equation above measures the speed of adjustment1. The coefficient of the lag of labour productivity is expected to be positive and less than one. If the outcome is consistent with this expectation, then this shows some degree of catching-up process in Turkish manufacturing.
The following variables are used as the explanatory variables in the estimation of the model above:
CAPINT is the capital intensity and defined as the real capital stock per employee. Capital stock, here, is proxied by the “net assets” of the firm which is calculated by discounting accumulated depreciation from total assets of the firm.
In order to test the hypothesis that exporting fosters productivity we include two variant of exporting activity. The first variable is the per worker export intensity, EXPINT. EXPINT is measured as the proportion of exports in total sales of the firm. The second variable is per worker exports in US dollars, EXPORTIVITY. The reason for inclusion of two different variables representing exporting activity of the firm is to make sure that the results are not subject to how exporting activity of the firm is measured. We expect positive and significant coefficients of these variables if there are significant learning effects arising from exporting activity in Turkish manufacturing by using this specific sample.
We also include a dummy variable, FOWNER, representing the ownership structure of the firm in the model to see if productivity changes with respect to ownership structure of the firms. FOWNER is a dummy variable taking the value of 1 if 51% or more shares of the firm are held by foreigners.
The regressions also include time dummies to see if the labour productivity changes by time. We took the 1998 as the base year for the reason that 1997 was the year of Asian crisis.
The data used in this analysis is obtained from the largest first and second 500 Industrial Enterprises of Turkey prepared by Istanbul Chamber of Industry (ICI). All variables in the ICI database are reported in nominal values. Nominal variables are converted into real values by using 3 digit ISIC industry-specific producer price indexes published by Turkish Statistical Institute (TUIK) [30]. The export figures were converted into TL (Turkish Lira) by using annual average exchange rates reported by the Central Bank of the Republic of Turkey (CBRT) [31].
We used one-step Generalised Method of Moments (GMM) estimation method proposed by Arrellano and Bond (1991) [32] in estimation of the productivity equation2. The advantage of GMM is that it controls both unobservable firm specific effects and possible simultaneity among explanatory variables. GMM estimators use variables in differences to eliminate unobservable cross sectional effects and use lagged values as instruments to correct for simultaneity bias [33, p.480].
Estimations were carried out for all manufacturing industry firms in the database and for the firms operating in four different industries classified according to their orientations. Although there are five categories, only four of them are used in regression analysis of this paper because there was not sufficient number of firms in science based industries. The purpose of estimating productivity equation for the firms operating in different oriented industries is that the structure and dynamics of production of the firms may change with respect to industry orientations simply because classification of industries with respect to the orientation based on the factor use and intensity of technology in production. Therefore, learning effects resulting from exporting may differ with respect to industry in which firm operates.
5. Estimation Results
Unbalanced dynamic panel data GMM one step estimation results are given in Tables 1 and 2. The difference between the two tables is due to the different measurements of exporting activity. While Table 1 presents the results of the regressions using the share of exports in total sales as the exporting activity of the firm, in Table 2 per worker exports is used to control for the impact of exporting activity on productivity. The results may be summarised as follows:
First of all, there doesn’t seem be a strong convergence tendency among the firms in Turkish manufacturing from 1997 to 2007. Coefficient of adjustment variable is found to be significant for the whole manufacturing, resource and scale intensive industries but the other two industries.
The relation between productivity and capital intensity, CAPINT, is found to be significant for all industries. The magnitude of this coefficient does not differ very much for different industries except for specialised supplier industries. In the specialised supplier industries, the coefficient of capital intensity is found to be smaller than the other industries and aggregate manufacturing. Differently
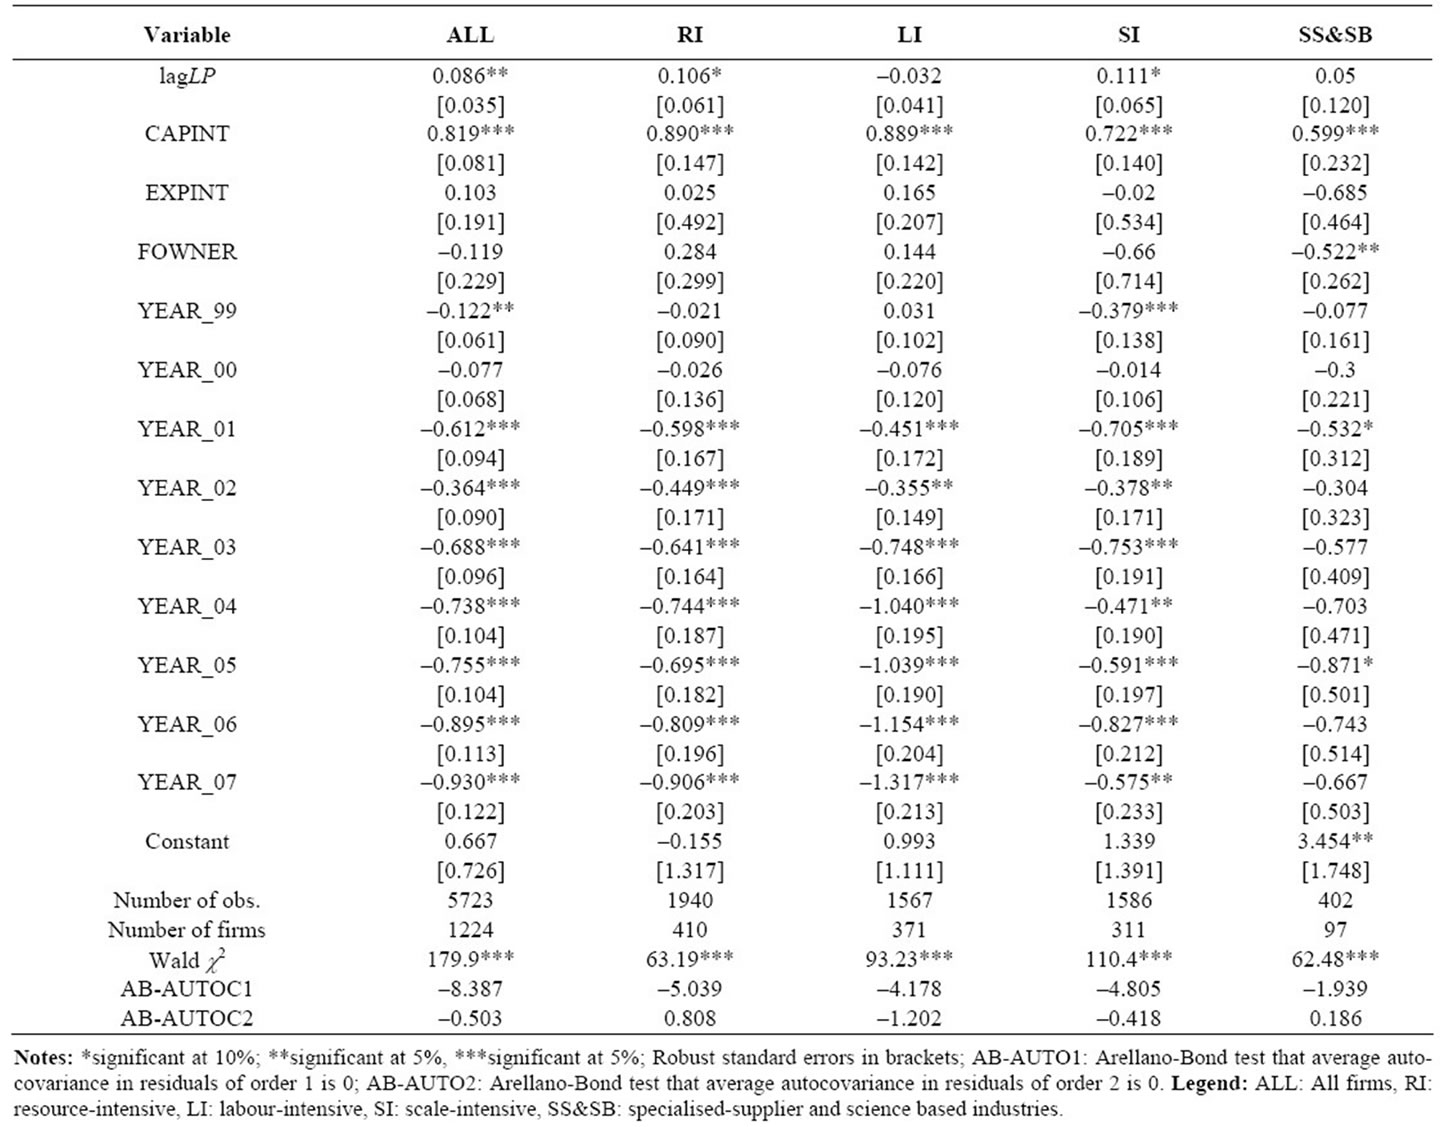
Table 1. GMM one step estimation, dependent variable is the log of labour productivity, 1997-2007.
from the other industries, there must be some other significant drivers of productivity in this industry other than capital. This is not something unexpected.
The two coefficients of exporting activity, namely EXPINT and EXPORTIVITY, were found to be insignificant for aggregate manufacturing industry (see Tables 1 and 2). This result implies that learning by exporting hypothesis does not hold in aggregate Turkish manufacturing industry. Similar to this finding, the coefficients of the two measures of exporting activity came out to be insignificant in resource intensive, labour intensive and specialised supplier industries. This means that there is no statistically significant evidence of association between exporting and productivity in these industries. In fact, our prior expectation on the relation between exporting and productivity in industries with different orientations was not this outcome. In scale intensive industries, the estimation result on the relation between exporting and productivity differs with respect to the measurement of exporting activity. In this industry, the relation is not significant when exporting measured as the share of exports in total sales, EXPINT, (see Table 1), it is, on the other hand, found to be significant and positively related with labour productivity when it is measured as per worker exports, EXPORTIVITY (see Table 2). This finding on the exporting and productivity relation in scale intensive industry is not strong enough to conclude that there is a positive relation between exporting and productivity.
We may conclude that the relation between exporting and productivity is at least sensitive to the measurement of exporting activity.
In sum, estimation results show that there is no evidence that exporting fosters productivity at the firm level in Turkish manufacturing industry. Disaggregation of industries with respect to their orientations does not change this result.
Our finding, in fact, contradicts with the studies examining learning by exporting hypothesis in Turkish manufacturing [1-3]. This contradiction may be justified as follows: Previous studies on Turkish manufacturing first
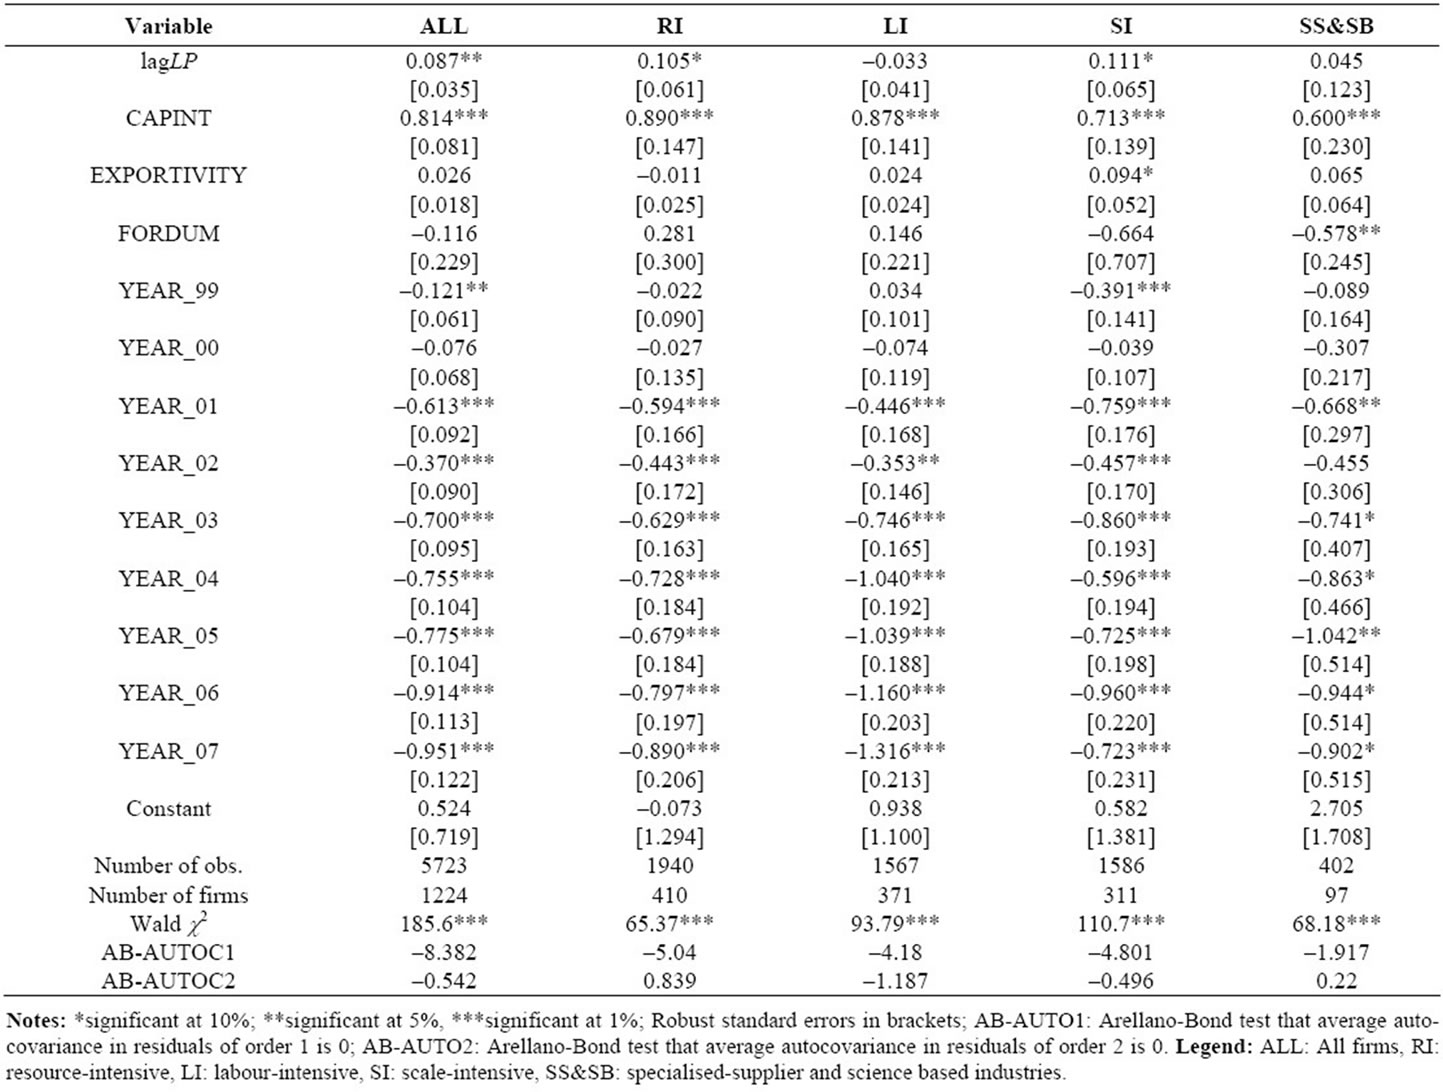
Table 2. GMM one step estimation, dependent variable is the log of labour productivity, 1997-2007.
supply evidence on learning by exporting hypothesis only from the two sub industries, textile-apparel and motor vehicles-parts, of Turkish manufacturing. This relation, in fact, may well change in aggregate manufacturing industry and in industries with different orientations. Second, the period, 1990-1996, examined in these studies is the period in which the government promoted exporting aggressively with both devaluated national currency and export subsidies and tax exemptions. Thirdly, productivity in these studies is calculated by using output (sales from production). However, using value added instead output is a better approach in measuring factor productivity. All these factors may exaggerate the relation between exporting and productivity, and lead to biased results.
Tables 1 and 2 also depict that there seem to be no statistically significant productivity difference between foreignand domestically-owned enterprises in aggregate manufacturing, resource, labour, and scale intensive industries. We found, on the other hand, foreign firms operating in specialised supplier industries are less productive than domestic firms (see Tables 1 and 2).
Finally, examination of the time dummies show that labour productivity has exhibited a decreasing pattern after the year 2001 crisis and never reached back to the pre-2001 crisis level in both aggregated Turkish manufacturing and disaggregated industries with respect to the orientations.
6. Conclusions
This study examines the relation between exporting and productivity performance of manufacturing firms. More specifically, we test whether learning by exporting hypothesis according to which exporting fosters productivity due to the learning and scale effects arising from exporting activity of the firm, holds for the firms in Turkish manufacturing industry. This paper, more importantly, examines if the evidence on learning by exporting hypothesis differs with respect to the orientation of industries in which the firms operate.
The descriptive analysis of the evolution of labour productivity and exporting measured as both exports per worker and export intensity does not provide clear evidence on the possible positive association between exporting and productivity in Turkish manufacturing. The only industry showing some degree of relation may be specialised supplier industries in which there seem to be a positive association between exporting and productivity.
The results based on dynamic unbalanced panel data estimations show that the presumption that exporting leads to higher productivity because of learning and scale effects does not hold for Turkish manufacturing industry. At the more disaggregated level of industries classified according to their orientations, we found no positive association between exporting and productivity for three sub-industries of manufacturing. We found, on the other hand, weak evidence supporting learning by exporting hypothesis in scale intensive industries when exporting activity of the firm is measured as per worker exports. However, this result is not confirmed if export intensity of the firm is used to control for exporting activity of the firm. This finding, therefore, is not strong enough to conclude that there is a positive relation between exporting and productivity in scale intensive firms.
All these findings show that there is no evidence of strong positive relation between exporting and productivity in Turkish manufacturing industry. This conclusion does not change with respect to the orientation of the industries in which the firms operate. Exporting, or increase in the exports of the firm, may not be one of the sources of productivity growth at least for the firms already exporting. This finding may possibly be attributed to the fact that export oriented industrialisation and growth policy of Turkish economy has been mainly based on the devaluation of national currency and low wages to gain competitive advantage in international markets rather than improving comparative productivity and efficiency in manufacturing production in the period analysed.
7. Acknowledgements
Post-doctoral research support from the Scientific and Technological Research Council of Turkey (TUBITAK) is gratefully acknowledged. The authors thank the participants at the 15th World Congress of the IEA held in Istanbul and Asia-Pacific Productivity Conference 2008 held in Taiwan for their invaluable comments on earlier versions of the manuscript.
REFERENCES
- M. Yasar and R. M. Rejesus, “Exporting Status and Firm Performance: Evidence from a Matched Sample,” Economics Letters, Vol. 88, No. 3, 2005, pp. 397-402. doi:10.1016/j.econlet.2005.05.001
- M. Yasar M, C. H. Nelson and R. M. Rejesus, “Productivity and Exporting Status of Manufacturing Firms: Evidence from Quantile Regressions,” Review of World Economics, Vol. 142, No. 2, 2006, pp. 675-694.
- M. Yasar, P. Garcia, C. H. Nelson and R. M. Rejesus, “Is There Evidence of Learning-by-exporting in Turkish Manufacturing Industries?” International Review of Applied Economics, Vol. 21, No. 2, 2007, pp. 293-305. doi:10.1080/02692170701189193
- ICIa (Istanbul Chamber of Industry), Turkey’s Top 500 Industrial Enterprises: 2007, September, Istanbul, 2008.
- ICIb (Istanbul Chamber of Industry), Turkey’s Next Top 500 Industrial Enterprises: 2007, September, Istanbul, 2008.
- ICI (Istanbul Chamber of Industry), The Chairman’s Speech at the Assembly/26 September 2007, 2007. http://www.iso.org.tr/en/Meclis_Konusmalari_26-09-07.aspx
- A. B. Bernard and B. J. Jensen, “Exporters, Jobs, and Wages in U.S. Manufacturing, 1976-1987,” Brookings Papers on Economic Activity, Washington DC, 1995, pp. 67-119.
- M. A. Delgado, J. C. Farin˜as and S. Ruano, “Firm Productivity and Export Markets: a Non-parametric Approach,” Journal of International Economics, Vol. 57, No. 2, 2002, pp. 397-422. doi:10.1016/S0022-1996(01)00154-4
- J. Wagner, “Exports and Productivity: A Survey of the Evidence from Firm-Level Data,” The World Economy, Vol. 30, No. 1, 2007, pp. 60-82. doi:10.1111/j.1467-9701.2007.00872.x
- D. Castellani, “Export Behavior and Productivity Growth: Evidence from Italian Manufacturing Firms,” Review World Economics, Vol. 138, No. 4, 2002, pp. 605-628.
- J. R. Baldwin and W. Gu, “Export-Market Participation and Productivity Performance in Canadian Manufacturing,” Canadian Journal of Economics, Vol. 36, No. 3, 2003, pp. 634-657. doi:10.1111/1540-5982.t01-2-00006
- S. K. Clerides, S. Lach and J. R. Tybout, “Is Learning by Exporting Important? Microdynamic Evidence from Colombia, Mexico, and Morocco,” Quarterly Journal of Economics, Vol. 113, No. 3, 1998, pp. 903-947. doi:10.1162/003355398555784
- A. B. Bernard and B. J. Jensen, “Exceptional Exporter Performance: Cause, Effect, or Both?,” Journal of International Economics, Vol. 47, No. 1, 1999, pp. 1-25. doi:10.1016/S0022-1996(98)00027-0
- M. Roberts and J. Tybout, “The Decision to Export in Columbia: An Empirical Model of Entry with Sunk Costs,” American Economic Review, Vol. 87, No. 4, 1997, pp. 545-564.
- A. E. Isgut, “What’s Different about Exporters? Evidence from Colombian Manufacturing,” Journal Development Studies, Vol. 37, No. 5, 2001, pp. 57-82. doi:10.1080/00220380412331322121
- J. C. Fariñas and A. Martín-Marcos, “Exporting and Economic Performance: Firm-level Evidence for Spanish Manufacturing,” The World Economy, Vol. 30, No. 4, 2007, pp. 618-646. doi:10.1111/j.1467-9701.2007.01007.x
- B. Y. Aw, S. Chung and M. J. Roberts, “Productivity and Turnover in the Export Market: Micro-Level Evidence from the Republic of Korea and Taiwan (China),” World Bank Economic Review, Vol. 14, No. 1, 2000, pp. 65-90.
- H. C. Hahn, “Exporting and Performance of Plants: Evidence from Korean Manufacturing,” National Bureau of Economic Research Working Paper Series WP 10208, 2004, pp. 1-41. http://www.nber.org/papers/w10208
- A. Bernard and J. Wagner, “Exports and Success in German Manufacturing,” Review of World Economics, Vol. 133, No. 1, 1997, pp. 134-157.
- J. Wagner, “The Causal Effects of Exports on Firm Size and Productivity: First Evidence from a Matching Approach,” Economics Letters, Vol. 77, No. 2, 2002, pp. 287-292. doi:10.1016/S0165-1765(02)00131-3
- M. J. Arnold and K. Hussinger, “Export Behaviour and Firm Productivity in German Manufacturing: A FirmLevel Analysis,” Review of World Economics, Vol. 141, No. 2, 2005, pp. 219-243. doi:10.1007/s10290-005-0026-8
- J. D. Loecker, “Do Exports Generate Higher Productivity? Evidence from Slovenia,” Journal of International Economics, Vol. 73, 2007, pp. 69-98. doi:10.1016/j.jinteco.2007.03.003
- A. Kraay, “Exports and Economic Performance: Evidence from a Panel of Chinese Enterprises,” In: B. M. Hoekman, and B. S. Javorcik, Eds., Global Integration and Technology Transfer, Palgrave Macmillan, 2006, pp. 139-160.
- G. Blalock and P. J. Gertler, “Learning from Exporting Revisited in a Less Developed Setting,” Journal of Development Economics, Vol. 75, 2004, pp. 397-416. doi:10.1016/j.jdeveco.2004.06.004
- J. Van Biesebroeck “Exporting Raises Productivity in Sub-Saharan African Manufacturing Firms,” Journal of International Economics, Vol. 67, 2005, pp. 373-391. doi:10.1016/j.jinteco.2004.12.002
- R. M. Salomon and M. J. Shaver, “Learning by Exporting: New Insights from Examining Firm Innovation,” Journal of Economics and Management Strategy, Vol. 14, No. 2, 2005, pp. 431-460. doi:10.1111/j.1530-9134.2005.00047.x
- S. Girma, D. Greenaway and R. Kneller, “Does Exporting Increase Productivity? A Microeconometric Analysis of Matched Firms,” Review of International Economics, Vol. 12, No. 5, 2004, pp. 855-866. doi:10.1111/j.1467-9396.2004.00486.x
- S. Girma, J. Gullstrand and R. Kneller, “Exporting May Not Always Boost Firm Productivity,” Review of World Economics, Vol. 141, No. 4, 2005, pp. 561-582. doi:10.1007/s10290-005-0045-5
- OECD, “Structural Change and Industrial Performance,” OECD, Paris, 1992.
- TUIK, “Turkish Statistical Institute, the Producer Price Index and Indices by Sectors and Sub-Sectors,” 2008. http://www.tuik.gov.tr. Accessed 25 January 2008.
- CBRT, “The Central Bank of the Republic of Turkey,” Exchange Rates, 2008. http://evds.tcmb.gov.tr/yeni/cbt-uk.html
- M. Arellano and S. Bond, “Some Tests of Specification for Panel Data: Monte Carlo Evidence and an Application to Employment Equations,” The Review of Economic Studies, Vol. 58, No. 2, 1991, pp. 277-297. doi:10.2307/2297968
- G. Ballot, F. Fakhfakh and E. Taymaz, “Who Benefits from Training and R&D?” British Journal of Industrial Relations, Vol. 44, No. 3, 2006, pp. 473-495. doi:10.1111/j.1467-8543.2006.00509.x
Appendix
Classification of Manufacturing Industries According to Their Orientation, (ISIC Code-Industry Name)
Resource Intensive Industries
3111-Slaughtering, preparing and preserving meat; 3112- Manufacture of dairy products; 3113-Canning and preserving of fruits and vegetables; 3114-Canning, preserving and processing of fish, crustaceans and similar foods; 3115-Manufacture of vegetable and animal oils and fats; 3116-Grain mill products; 3117-Manufacture of bakery products;3118-Sugar factories and refineries; 3119- Manufacture of cocoa, chocolate and sugar confectionery; 3121-Manufacture of food products nce.; 3122-Manufacture of prepared animal feeds; 3131-Distilling, rectifying and blending spirits; 3132-Wine industries; 3133- Malt liquors and malt; 3134-Soft drinks and carbonated waters industries; 3140-Tobacco manufactures; 3411- Manufacture of pulp, paper and paperboard; 3412- Manufacture of containers and boxes of paper and paperboard; 3419-Manufacture of pulp, paper and paperboard articles nce.; 3420-Printing, publishing and allied industries; 3530-Petroleum refineries; 3540-Manufacture of miscellaneous products of petroleum and coal; 3610-Manufacture of pottery, china and earthenware; 3620-Manufacture of glass and glass products; 3691-Manufacture of structural clay products; 3692-Manufacture of cement, lime and plaster; 3699-Manufacture of non-metallic mineral products nce.; 3720-Non-ferrous metal basic industries.
Labour Intensive Industries
3211-Spinning, weaving and finishing textiles; 3212- Manufacture of made up textile goods except wearing apparel; 3213-Knitting mills; 3214-Manufacture of carpets and rugs; 3215-Cordage, rope and twine industries; 3219-Manufacture of textiles nce.; 3220-Manufacture of wearing apparel, except footwear; 3231-Tanneries and leather finishing; 3232-Fur dressing and dyeing industries; 3233-Manufacture of products of leather and leather substitutes; 3240-Manufacture of footwear, except vulcanized or moulded rubber or plastic footwear; 3811- Manufacture of cutlery, hand tools and general hardware; 3812-Manufacture of furniture and fixtures primarily of metal; 3813-Manufacture of structural metal products; 3819-Manufacture of fabricated metal products except machinery and equipment nce.; 3901-Manufacture of jewellery and related articles; 3902-Manufacture of musical instruments; 3903-Manufacture of sporting and athletic goods; 3909-Manufacturing industries nce.
Scale Intensive Industries
3311-Sawmills, planing and other wood mills; 3312- Manufacture of wooden and cane containers and small cane ware; 3319-Manufacture of wood and cork products nce.; 3320-Manufacture of furniture and fixtures, except primarily of metal; 3511-Manufacture of basic industrial chemicals except fertilizers; 3512-Manufacture of fertilizers and pesticides; 3513-Manufacture of synthetic resins, plastic materials and man-made fibres except glass; 3521-Manufacture of paints, varnishes and lacquers; 3523- Manufacture of soap and cleaning, preparations, perfumes, cosmetics and other toilet preparations; 3529- Manufacture of chemical products nce.; 3551-Tyre and tube industries; 3559-Manufacture of rubber products nce.; 3560-Manufacture of plastic products nce.; 3710- Iron and steel basic industries; 3841-Shipbuilding and repairing; 3842-Manufacture of railroad equipment; 3843- Manufacture of motor vehicles; 844-Manufacture of motorcycles and bicycles; 3849-Manufacture of transport equipment nce.
Specialised Supplier Industries
3821-Manufacture of engines and turbines; 3822-Manufacture of agricultural machinery and equipment; 3823- Manufacture of metal and woodworking machinery; 3824- Manufacture of special industrial machinery and equipment except metal and wood-working machinery; 3829- Machinery and equipment except electrical nce.; 3831- Manufacture of electrical industrial machinery and apparatus; 3833-Manufacture of electrical appliances and house-hold goods; 3839-Manufacture of electrical apparatus and supplier nce.
Science Based Industries
3522-Manufacture of drugs and medicines; 3825- Manufacture of office, computing and accounting machinery; 3845-Aerospace; 3851-Manufacture of professional and scientific, and measuring and controlling equipment, nce.; 3852-Manufacture of photographic and optical goods; 3853-Manufacture of watches and clocks.
Source: OECD, 1992.
NOTES
1Note that the “(” in convergence debate is equal to the estimated coefficient of lagLP, ((1), minus 1. The null hypothesis in testing for the existence of catch-up, or convergence, then, is Ho: ((1 – 1) = ( = 0.
2We also estimated Arellano-Bover/Blundell-Bond’s linear dynamic panel data model, so called system GMM, but the results were the same.