Journal of Environmental Protection
Vol.4 No.1(2013), Article ID:27331,12 pages DOI:10.4236/jep.2013.41012
Bioadsorption of Pb(II) onto Anethum graveolens from Contaminated Wastewater: Equilibrium and Kinetic Studies
![]()
1Faculty of Science and Arts at Shaqra, Shaqra University, Shaqra, KSA; 2Textile Research Division, National Research Center, Dokki, Cairo, Egypt; 3Shaqra University, Shaqra, KSA.
Email: *lihashem2000@yahoo.com, alihashem@su.edu.sa
Received October 18th, 2012; revised November 18th, 2012; accepted December 15th, 2012
Keywords: Anethum graveolens Biomass; Bioadsorption; Pb(II) Removal; Adsorption Kinetic
ABSTRACT
In the present study we reported the feasibility of the Anethum graveolens as biosorbent to remove Pb(II) from aqueous solutions. Anethum graveolens was characterized by scanning electron microscopy and elemental analysis. The ability of Anethum graveolens to adsorb Pb(II) was investigated by using batch adsorption procedure. The effects such as pH, contact time, adsorbate concentration and biosorbent dosage on the adsorption capacity were studied. The experimental data were analysed using various adsorption kinetic models viz., the pseudo-first and second-order equations, Bangham’s equation, intraparticle diffusion and Elovich models. Results show that the pseudo-second-order equation provides the best correlation for the biosorption process. The equilibrium nature of Pb(II) adsorption at 30◦C has been described by the Langmuir, Freundlich, Temkin and Redlich-Peterson isotherm models. The equilibrium data fit well on Langmuir isotherm. The monolayer adsorption capacity of Pb(II) onto Anethum graveolens as obtained from Langmuir isotherm at 30◦C was found to be 303 mg/g. This high adsorption capacity of Anethum graveolens places this biosorbent as one of the best adsorbents for removal of Pb(II) from aqueous effluents.
1. Introduction
Developments in technology have led to the release of heavy metals such as lead, copper, chromium, nickel and zinc, which are hazardous to the environment and their toxicity and presence in the ecosystem poses a possible human health risk [1].
Lead is one of these heavy metals, and can be introduced to liquid wastes from the manufacturing processes of storage batteries, smelting and refining of lead and from the processes of mining. In water, lead tends to accumulate in aquatic organisms through the food chain and by direct uptake [2]. Lead is believed to cause hypertension, reproductive disorders and neurological and metabolic problems in humans [2].
Among the many methods available to reduce heavy metals concentrations from wastewater, the most common are chemical precipitation, ion-exchange, and reverse osmosis. Precipitation methods are particularly reliable but require large settling tanks for the precipitation of alkalines sludges and a subsequent treatment is needed [3,4]. Ion-exchange has the advantage of allowing the recovery of metallic ions, but it is expensive and sophisticated.
The adsorption process [5] is one of the most effective methods used to remove heavy metals from aqueous solution. Activated carbon is the most widely used adsorbent for this purpose because of its extended surface area, microporous structure, high adsorption capacity and high degree of surface reactivity. The commercial activated carbons are very expensive [6], this led to search for cheaper adsorbent. Consequently, numerous low-cost alternative adsorbent have been proposed including lingocellulosic wastes [7-11].
The agricultural wastes were considered as low-cost since they 1) require little processing and 2) are abundant in nature. Commonly, it concerns vegetal materials, then the term of biosorption is used to designate the fixation of contaminants onto biomaterials.
The main focus of this study was to evaluate the biosorption aptitude of a novel, low cost, and renewable biomass, Anethum graveolens for the removal of Pb(II) from aqueous solutions. The effects of pH, contact time, initial metal concentration and biomass dosage on the biosorption capacity were investigated. Moreover, various kinetic models were used to examine the experimental data. Experimental equilibrium data were fitted to the Langmuir, Freundlich, Temkin and Redlich-Peterson isotherm equations to determine the best-fit isotherm equation.
2. Experimental
Materials
Bio-dsorbent, Anethum graveolens, a desert plant is widely spread in Libya and Kingdom of Saudi Arabia. There is no previous report used Anethum graveolens as adsorbent material for removal of heavy metals. The roots were separated from the stems and leaves, washed with distilled water several times to remove the surface adhered particles and water soluble particles and dried at 80˚C in an electric oven for 24 h and ground using a mixer, and sieved to pass through a 150 - 200 mm. The roots were chosen because they contain the highest percentage of the cellulose content.
Reagents
Lead acetate, EDTA, ethanol, sodium carbonate and acetic acid were of analytical reagent grade supplied by Merck Company, Germany.
3. Methods
Bioadsorption Studies
The adsorbate solutions of 100 - 800 mg/l were prepared by dissolving certain weights of lead acetate in certain volumes of distilled water. The pH (2 - 4.5) of the solutions was adjusted with acetic acid or sodium carbonate solution. Equal volumes (100 ml of each) of the previously prepared metal ion solutions were placed in the corresponding number of 125 ml Erlenmeyer flasks each of which containing 0.05 g of the adsorbent and the whole flasks were shaken at 30˚C in a thermostatic water-bath at 150 rpm for 2 h. At the end of agitation time, the metal ion solutions were separated by filtration. The blank experiments were simultaneously carried out without the adsorbent. The extent of metal ion adsorption onto adsorbent was calculated mathematically by measuring the metal ion concentration before and after the adsorption through direct titration against standard EDTA solution. The amount of lead adsorbed, qe (mg/g) and percent removal of Pb(II) on Anethum graveolens were calculated according to the following equations:
 (1)
(1)
Percent Removal = (2)
(2)
where Co and Ce are the initial and final concentrations of metal ion, mg/V is the volume of metal ion (l), W is the weight of bioadsorbent (g).
Analyses
Scanning electron microscopy (SEM)
To carry out an SEM analysis of Anethum graveolens biomass, the sample was first mounted on a standard microscope stub and coating with a thin layer of gold using a Polaron Diode Sputter unit. The analysis was performed using a JEOL JSM-15 scanning electron microscope.
Error analysis
In the single-component isotherm studies, the optimization procedure requires an error function to be defined to evaluate the fit of the isotherm to the experimental equilibrium data. The common error functions for determining the optimum isotherm parameters were, average relative error (ARE), sum of the squares of the errors (ERRSQ), hybrid fractional error function (HYBRID), Marquardt’s percent standard deviation (MPSD) and sum of absolute errors (EABS) [12]. In the present study, the average relative error (ARE) was used to determine the best fit in isotherm model as:
 (3)
(3)
4. Results and Discussion
SEM of bioadsorbent
The SEM image (Figure 1) clearly shows that the sample of Anethum graveolens L is mainly composed of irregular and porous particles which indicated high surface area. It is clear from this figure that, Anethum graveolens has considerable numbers of pores where there is a good possibility of Pb(II) ions to be trapped and adsorbed into these pores.
Elemental analysis
The C, H, N contents of Anethum graveolens were analyzed with a Perkin-Elmer 240 CHN elemental analyzer. The element contents are as follows: C, 37.03%, H, 4.9%, N, 2.2%.
Factors affecting bio adsorption of Pb(II) onto Anethum graveolens
(Effect of initial pH)
The pH of the aqueous solution is an important controlling parameter in the adsorption process [13,14]. In the present work, adsorption of Pb(II) onto Anethum graveolens adsorbent was studied over the pH range of 2.0 - 4.5 for a constant adsorbent dose and constant concentration of adsorbate at 30˚C. As the acidity of the medium decreased, the extent of adsorption capacity, qe decreased (Figure 2). At high acidity, the Anethum graveolens particle surface will be completely covered with H3O+ ions and Pb(II) ions can hardly compete with

Figure 1. Scan Electron Microscope (SEM) of Anethum graveolens.
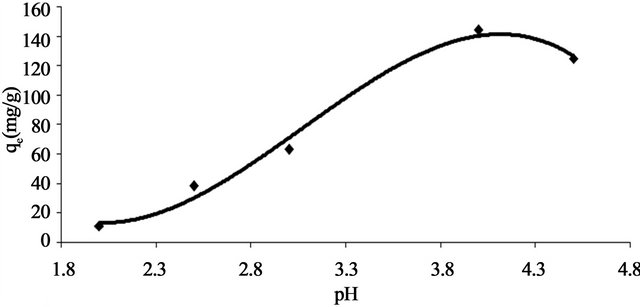
Figure 2. Effect of pH on adsorption capacity of Pb(II) onto Anethum graveolens at 30˚C.
them for adsorption sites. With the increase in pH, the competing effect of hydronium ions decreases and the positively charged Pb(II) ions adsorb on the free binding sites of the adsorbents. This is a common observation for all cases of adsorption of metal cations on solid surface in media of different acidity-basicity [15]. It is also significant that the active sites on the Anethum graveolens surface are weakly acidic in nature and with increase in pH, they are gradually deprotonated making available more and more sites for metal ion uptake [16]. At pH value higher than 4.5, the adsorption studied could not be carried out because metal ion will precipitate as lead hydroxide in this range.
Effect of adsorbent concentration (Adsorbent dose)
The effect of adsorbent concentration on both adsorption capacity and percent removal of lead are shown in Figure 3. It is clear from this figure that the percent removal of lead increases from 11% to 64% by increasing the concentration of adsorbent from 0.5 to 8 g/l and then remained at approximately the same level at higher adsorbent concentration. The increase in percent removal of Pb(II) with increasing adsorbent concentration in the first range could be attributed to the greater availability of the exchangeable sites of the adsorbent. The leveling of the percent removal at higher adsorbent concentration could be attributed to the blocking of the available active sites on the adsorbent surface. On the other hand, the adsorption capacity (qe), or the amount of Pb(II) adsorbed per unit mass of adsorbent (mg/g), decreases by increasing the concentration of adsorbent (Figure 3). The decrease in adsorption capacity with increasing the adsorbent concentration is mainly due to overlapping of the adsorption sites as a result of overcrowding of the adsorbent particles and is also due to the competition among Pb(II) ions for the surface sites [11].
Effect of contact time
Figure 4 shows the effect of contact time on the adsorption capacity, qe (mg/g) of Pb(II) onto Anethum graveolens at 30˚C using adsorbate concentration of 330 mg/l at fixed pH and at adsorbent concentration. Equilibrium adsorption was established after 15 min within the concentration range studied indicating that the adsorption rate is very fast. It is further observed that the adsorption curve is smooth and continuous, which indicate the possibility of the formation of monolayer coverage of Pb(II) ions onto Anethum graveolens This data is important because equilibrium time is one of the parameters for economical wastewater treatment.
Kinetics of adsorption
Pseudo-first-order model
The pseudo-first-order equation [17] is:
 (4)
(4)
where qt is the amount of adsorbate adsorbed at time t (mg/g), qe is the adsorption capacity at equilibrium (mg/g), k is the pseudo-first-order rate constant (min–1), and t is the contact time (min). The integration of Equation (4) with the initial condition, qt = 0 at t = 0, the following equation is obtained:
 (5)
(5)
In order to obtain the rate constants, the straight line plot of  against t for Pb(II) onto Anethum graveolens have been tested. The intercept of this plot should give
 . However, if the intercept does not equal to qe, the reaction is not likely to be first order even if this plot has high correlation coefficient (R2) with the experimental data [18]. For the data obtained in the present study, the plots of
  versus t as required by Equation (5) for the adsorption of Pb(II) ions at initial concentrations of 300 mg/l by Anethum graveolens (figure not show) gave correlation coefficients, R2, which had low values. This indicates that the adsorption of Pb
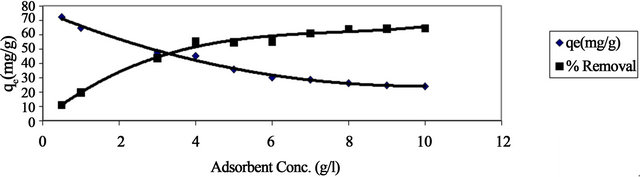
Figure 3. Effect of adsorbent concentration on both adsorption capacity and % removal of Pb(II) onto Anethum graveolens at 30˚C.
(II) onto Anethum graveolens is not acceptable for this mode
Bhattacharya-Venkobachar
The Bhattacharya-Venkobachar [19] Equation is:
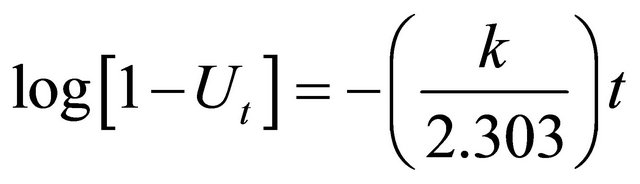
where
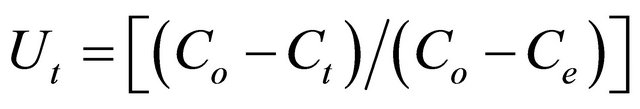 (6)
(6)
where Co, Ct and Ce are the concentration of Pb(II) ions (mg/l) at time zero, time, t, and at equilibrium time and k is the first order rate constant (min–1) for adsorption of Pb(II) ions onto Anethum graveolens The vales of R2 for the concentration of 300 mg/l (figure not shown) has very low value. This indicates that the adsorption of Pb(II) onto Anethum graveolens is not acceptable for this mode.
Pseudo-second-order model
The pseudo-second-order model is represented as [18]:
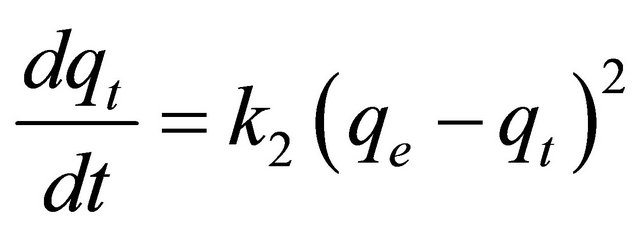 (7)
(7)
where k2 is the pseudo-second-order rate constant (g/mg×min). Integrating Equation (7) with the initial condition, qt = 0 at t = 0, the following equation is obtained:
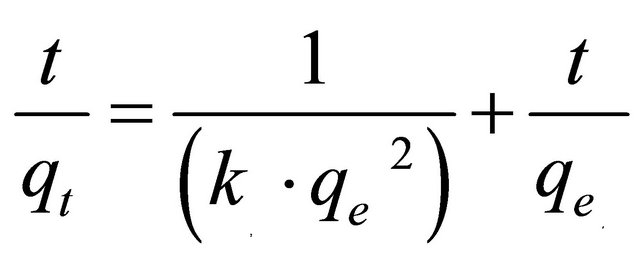 (8)
(8)
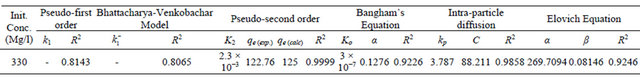
where k2 is the pseudo-second-order adsorption rate constant. This equation predicts that if the system follows pseudo-second-order kinetics, the plot of  versus t should be linear. Plotting the experimental data obtained for the adsorption Pb(II) ions at initial concentration of 300 mg/l onto Anethum graveolens according to the relationship given in Equation (8) gave linear plots with correlation coefficients, R2, of 0.9999 for Pb(II) concentration of 300 mg/l as shown in Figure 5" target="_self"> Figure 5 and listed in Table 1, thereby indicating the applicability of the pseudosecond-order kinetic equation to the experimental data. The experimental and calculated adsorption capacities for the two Pb(II) concentration of 300 mg/l as well as the values of k2, and R2 are presented also in Table 1. The first-order and pseudo-second-order models cannot identify the diffusion mechanism and the kinetic results were then subjected to analyze by the intra-particle diffusion mode.
Bangham’s equation
Bangham’s equation [20] was employed for applicability of adsorption of Pb(II) onto Anethum graveolens, whether the adsorption process is diffusion controlled.
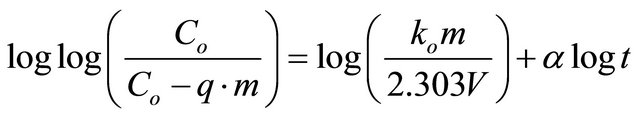 (9)
(9)
where Co is initial concentration of adsorbate (mg/l), V is volume of solution (ml), m is weight of adsorbent used per liter of solution (g/l), q is the amount of adsorbate retained at time t (mg/g),  (
( ) and k0 are constants.
The double logarithmic plot, according to Equation (9) yield satisfactory linear curves for the adsorption of Pb(II) by Anethum graveolens The correlation coefficient value, R2 (Figure 6) were 0.9226 for the concentration of 300 mg/g. This indicates that the adsorption of Pb(II) onto Anethum graveolens is acceptable for this model and shows that the diffusion of adsorbate into the pores of the adsorbent was the rate-controlling step [20].
Intra-particle diffusion
The intra-particle diffusion model [21] can be expressed by the following equation:
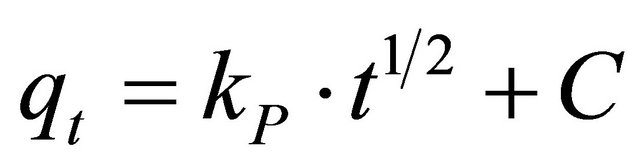 (10)
(10)
where kp is the intra-particle diffusion rate constant (mg. g−1×min ) and qt is the amount of solute adsorbed per unit mass of adsorbent. The data of solid phase metal concentration against time t at the initial concentration of 300 mg/l of Pb(II) were further processed for testing the rate of diffusion in the adsorption process. Adsorption process incorporates the transport of adsorbate from the bulk solution to the interior surface of the pores in Anethum graveolens The rate parameter for intra-particle diffusion, kp for the Pb(II) concentration of 300 mg/l is measured according to Equation (10). The plots of qt versus
  for the Pb(II) concentration of 300 mg/l of is shown in Figure 7. The plot is curved at the initial por-
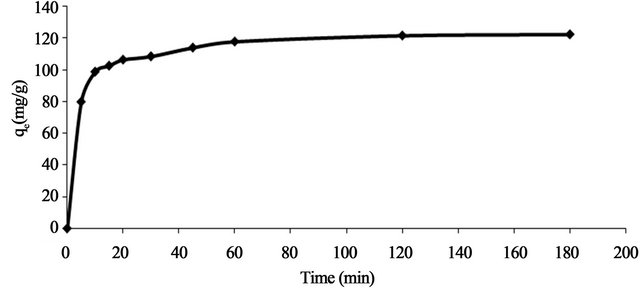
Figure 4. Effect of contact time and initial concentration on adsorption capacity of Pb(II) onto Anethum graveolens at 30˚C.
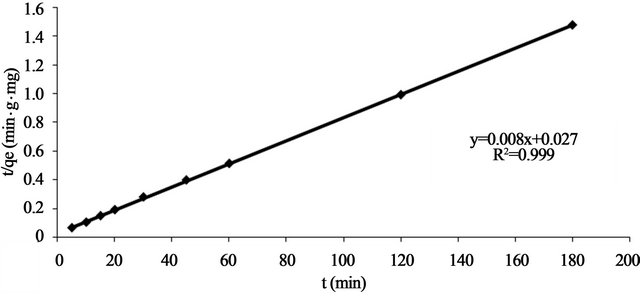
Figure 5. Pseudo-Second order reaction of Pb(II) onto Anethum graveolens for concentration of 330 mg/l at 30˚C.
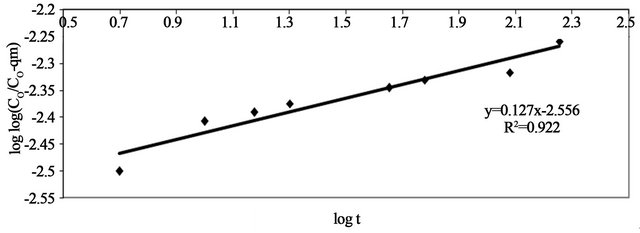
Figure 6. Pseudo-Second order reaction of Pb(II) onto Anethum graveolens for concentration of 330 mg/l at 30˚C.
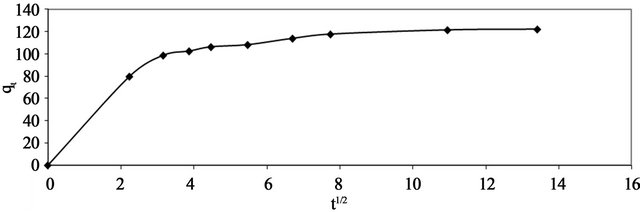
Figure 7. Intra-particle diffusion of Pb(II) onto Anethum graveolens for concentration of 330 mg/l at 30˚C.
tion followed by linear portion and plateau. The initial curved portion is attributed to the bulk diffusion and the linear portion to the intra-particle diffusion, while the plateau corresponding to equilibrium. The deviation of straight lines from the origin (Figure 8) may be because of the difference between the rate of mass transfer in the initial and final stages of adsorption. Further, such deviation of straight line from the origin indicates that the pore diffusion is not the rate-controlling step [22]. The values of kp (mg×g−1×min−1) obtained from the slope of the straight line (Figure 8) are listed in Table 1. The value of R2 for the plot is listed also in Table 1. The value of intercept, C (Table 1) give an idea about the boundary layer thickness, i.e., the larger the intercept, is the greater the boundary layer effect [23]. This value indicates that the adsorption of Pb(II) onto Anethum graveolens may be follow the intra-particle diffusion mechanism.
Elovich equation
The Elovich model equation is generally expressed as [24]:
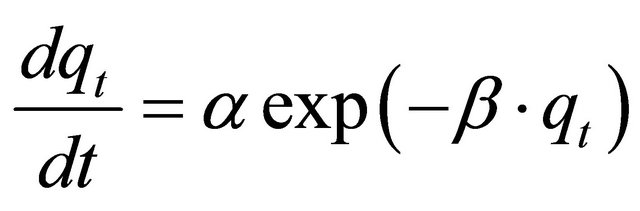
 (11)
(11)
where  is the initial adsorption rate (mg/g×min−1) and
  is the adsorption constant (g/mg) during the experiment.
To simplify the Elovich equation, Chien and Clayton
[24] assumed 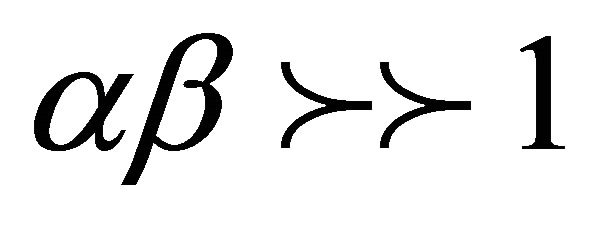 and by applying the boundary conditions q = 0 at t = 0 and qt = qt at t = t , Equation (11) become:
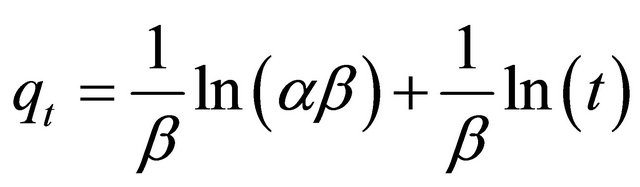 (12)
(12)
If Pb(II) adsorption onto Anethum graveolens fits the Elovih model, a plot of qe versus ln t should yield a linear relationship with a slope of  and an intercept of
 . Figure 9 shows a plot of linearization form of Elovich model at the Pb(II) concentration of 300 mg/ The slope and intercept of the plot of qt versus ln t was used to determine the constant
  and the initial adsorption rate α. The correlation coefficient value, R2 for the plot is listed in Table 1. The correlation coefficient for the Elovich kinetic model obtained at the Pb(II) concentration of 300 mg/l was over 0.92. This indicates that the adsorption of Pb(II) onto Anethum graveolens is acceptable for this mode.
Effect of adsorbate concentration
Adsorption isotherm
Adsorption isotherms describe how adsorbates interact with adsorbents are critical in optimising the use of adsorbents. The amount of adsorbate per unit mass of adsorbent at equilibrium, qe (mg/g) and the adsorbate equilibrium concentration, Ce (mg/l) allows plotting the adsorption isotherm, qe versus Ce (Figure 10) at 30˚C and
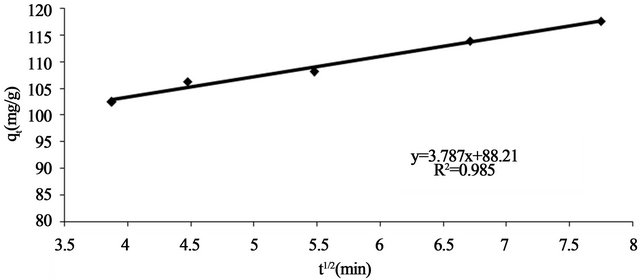
Figure 8. Test intra-particle diffusion of Pb(II) onto Anethum graveolens for concentration of 330 mg/l at 30˚C.
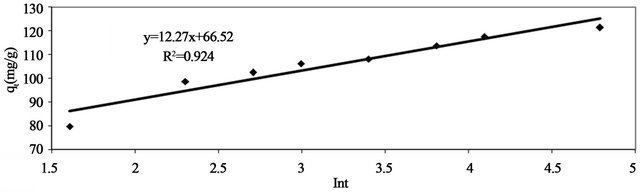
Figure 9. Elovich model of Pb(II) onto Anethum graveolens for concentration of 330 mg/l at 30˚C.
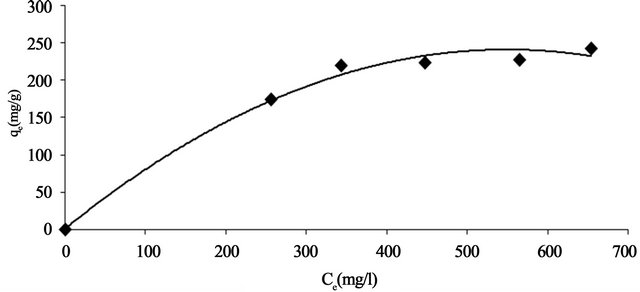
Figure 10. Equilibrium adsorption isotherm Pb(II) onto Anethum graveolens at 30˚C.
Table 1. Kinetic parameters for adsorption of Pb(II) onto Anethum graveolens at 30˚C.
mathematical models can be used to describe and characterize the adsorption process. The four most common isotherms for describing solid-liquid sorption systems are the Langmuir, the Freundlich, Temkin and the RedlichPeterson isotherms. Therefore, in order to investigate the adsorption capacity of Pb(II) onto Anethum graveolens, the experimental data were fitted to these equilibrium models.
The Langmuir model
The Langmuir adsorption isotherm [25] is most widely used for the adsorption of a pollutant from a liquid solution given the following hypotheses:
• Monolayer adsorption (the adsorbed layer is one molecule thick);
• Adsorption takes place at specific homogeneous sites within the adsorbent;
• Once a metal ion occupies a site, no further adsorption can take place at that site;
• Adsorptional energy is constant and does not depend on the degree of occupation of an adsorbent’s active centres;
• The strength of the intermolecular attractive forces is believed to fall off rapidly with distance;
• The adsorbent has a finite capacity for the metal ion (at equilibrium, a saturation point is reached where no further adsorption can occur);
• All sites are identical and energetically equivalent;
• The adsorbent is structurally homogeneous;
• There is no interaction between molecules adsorbed on neighboring sites.
The Langmuir model is described by the following equation:
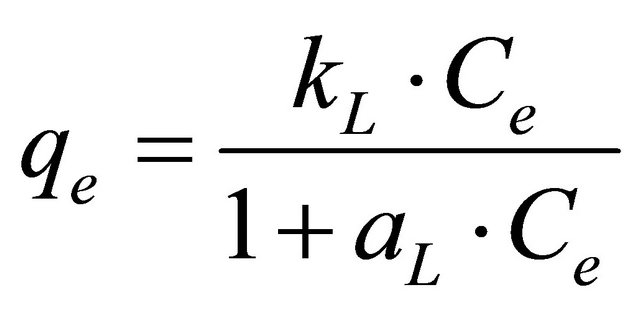 (13)
(13)
The linear form of Langmuir isotherm is given by the following equation:
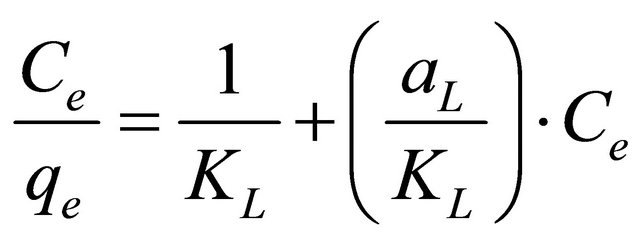 (14)
(14)
where aL is Langmuir isotherm constant (l/mg), KL is the Langmuir constant (l/g) and  represents the adsorption capacity, Qmax. The linear plots (Figure 11) of
  vs Ce give straight line with the slope
  and intercept
  The Langmuir constants of adsorption of Pb(II) ions onto Anethum graveolens biomass are listed in Table 2. The equilibrium constant KL may be used to determine the enthalpy of adsorption, ∆H. The relation between KL and Qmax is given by the following equation:
 (15)
(15)
where b is related to the energy of adsorption (l/mg). The value of constant b and correlation coefficient, R2 are also listed in Table 2. It has been reported that the effect of isotherm shape with a view to predicting if an adsorption system is favourable or unfavorable [26]. RL, decides the shape of the isotherm as given below:
RL values Nature of adsorption process RL > 1 Unfavourable RL = 1 Linear 0 < RL < 1 Favourable RL = 0 Irreversible The essential features of Langmuir isotherm can be expressed in terms of a dimensionless constant separation factor or equilibrium parameter, RL, which expressed by the following equation:
 (16)
(16)
where Co is the initial concentration of Pb(II) and b is mentioned before. The RL values for Pb(II) concentration of 330 mg/l onto Anethum graveolens biomass at 30˚C are given in Table 2. The values of the correlation coefficient, R2 of Langmuir plot are over 0.97 indicate that the bioadsorption of Pb(II) onto Anethum graveolens biomass is fitted well on the Langmuir isotherm (obey the Langmuir isotherm).
The Freundlich model
The Freundlich model [27] is a special case applied to non-ideal adsorption on heterogeneous surfaces and also to multilayer adsorption, suggesting that binding sites are not equivalent and/or independent. This model is described by Equation (17) as follows:
 (17)
(17)
The bio-adsorption data of Pb(II) by Anethum graveolens is analyzed also by Freundlish mode The logarithmic form of Freundlish model is given by the following equation:
 (18)
(18)
where qe is the equilibrium concentration Pb(II) on biomass adsorbent (mg/g), Ce the equilibrium concentration of lead in solution (mg/l) and KF (mg/g) and n are the Freundlich constants characteristic of the system, indicators of adsorption capacity and adsorption intensity, respectively. Linear plots of log qe vs logCe at 30˚C (Figure 12) suggest the applicability of adsorption process of Pb(II) onto Anethum graveolens on Freundlich isotherm. The values of KF and n were evaluated from the intercept and the slope of the plot and their numerical values are listed in Table 2. The n value gives an indication to favorability of adsorption. The value of n was 3.34 at 30˚C (0 < n < 10) showing that the adsorption of Pb(II) ions onto Anethum graveolens is favourable. The correlation coefficient, R2 values (Table 2) of Pb(II) by Anethum graveolens was over 0.80 indicating that the adsorption of Pb(II) ions on Anethum graveolens are not fitted well on Freundlish isotherm.
The Tempkin model
The Temkin isotherm [28] has been used in the following form:
 (19)
(19)
where R is the universal gas constant (8.31441 J−1×mol−1×K−1 ), T is the absolute temperature (K), AT is the Temkin isotherm constant (g/mg) and bT is Temkin constant. The sorption data were analyzed according to the linear form of the Temkin isotherm as:
 (20)
(20)
Linear plots of qe vs ln Ce at 30˚C (Figure 13) suggest the applicability of adsorption process of Pb(II) onto Anethum graveolens on Temkin isotherm. The values of AT and bT were evaluated from the intercept and the slope of the plot and their numerical values along with R2 are listed in Table 2. R2 value (Table 2) of Pb(II) by Anethum graveolens was over 0.85 indicating that the adsorption of Pb(II) ions on Anethum graveolens is slightly fitted on Temkin isotherm.
Redlich-Peterson isotherm
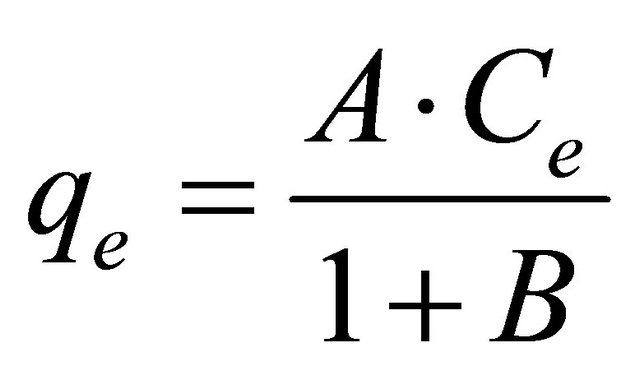
Redlich-Peterson [29] is incorporated three parameters into an empirical isotherm. The Redlich-Peterson isotherm model combines elements from both the Langmuir and Freundlich equations, and the mechanism of adsorption is a hybrid unique and does not follows ideal monolayer adsorption. The Redlich-Peterson equation is widely used as a compromise between Langmuir and Freundlich systems. The equation of this model is:
 (21)
(21)
where qe is the amount of lead adsorbed (mg/g) at equilibrium, Ce (mg/l) is the concentration of adsorbate at equilibrium, A (l/g) and B are the Redlich constants and g is exponent, which lies between 1 and 0. The application of this equation has been discussed widely and the limiting behavior is summarized as:
a) When g = 1 the equation is reduced to the Langmuir model as:
 (22)
(22)
b) When g = 0 the equation is reduced to Henery’s law as:
 (23)
(23)
The linear form of this model is obtained by applying logarithms to both sided of Equation (21) as follows:
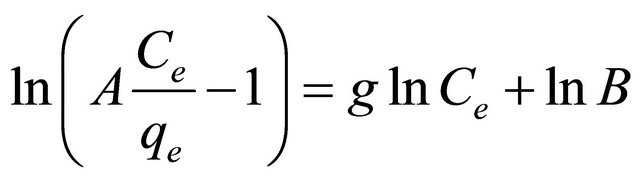 (24)
(24)
The three isotherm constants A, B and g can be evaluated from the linear plot presented by Equation (24) and shown in Figure 14 using a trial and error optimization method. A general trial and error procedure which is ap
Table 2. Constants and ARE of different adsorption models for Pb(II) onto Anethum graveolens at 30˚C.
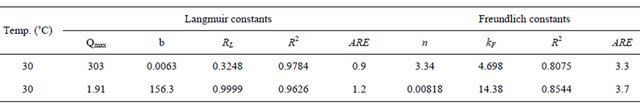
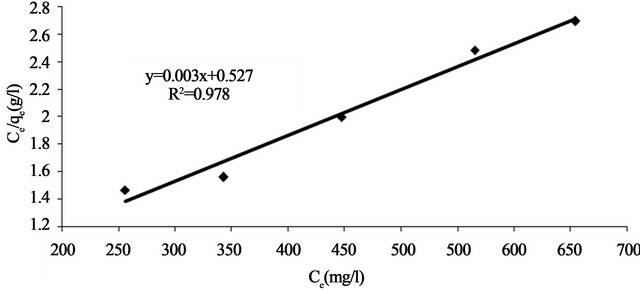
Figure 11. Langmuir adsorption plot of Pb(II) onto Anethum graveolens at 30˚C.
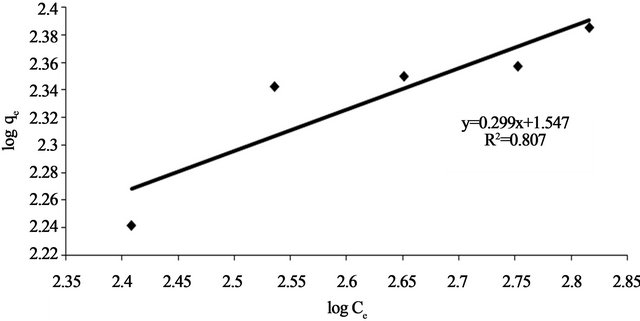
Figure 12. Freundlich adsorption plot of Pb(II) onto Anethum graveolens at 30˚C.
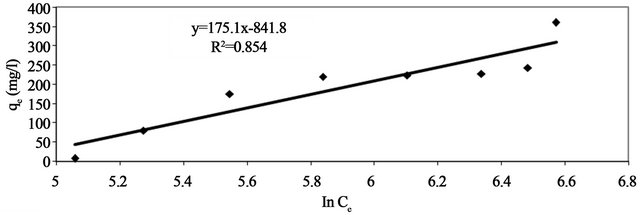
Figure 13. Temkin adsorption plot of Pb(II) onto Anethum graveolens at 30˚C.
plicable to computer operation was developed to determine the correlation coefficient, R2, for a series of values of A for the linear regression of ln 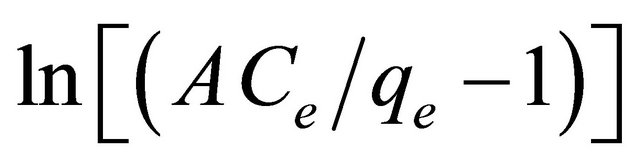 versus ln Ce at 30˚C to obtain the best values of A which yields a maximum value of R2. R2 value (Table 2) of Pb(II) by Anethum graveolens was over 0.96 indicating that the adsorption of Pb(II) ions on Anethum graveolens is fitted well also on Redlich-Peterson n isotherm (obey the Redlich-Peterson isotherm).
The comparison between the experimental data and the theoretical data obtained from isotherm models of Pb(II) onto Anethum graveolens are shown in Figure 15 which illustrates that the Langmuir isotherm fitted the experimental data better than other isotherms.
Error analysis
The use of R2 is limited to solve linear forms of isotherm equation, which measures the difference between experimental and theoretical data in linearized plots only, but not the errors in non-linear form of isotherm curved. For this reason we use average relative error (ARE) to determine the best fit in isotherm models. For all isotherm models, the value of ARE for adsorption of Pb(II) onto Anethum graveolens are calculated and presented in Table 2. The most obvious conclusions from these results are that the Langmuir isotherm model has the lowest values for ARE and therefore fits the data better than the rest of isotherm models.
Mechanism of bio adsorption
The bioadsorbent contains various organic compounds (lignin, cellulose and hemicellulose) with polyphenolic groups that might be useful for binding metal ions. The scan image of bio adsorbent shows that Anethum graveolens has a microporous structure; therefore, pores are large enough to let Pb(II) ions through. According to the data obtained from intra-particle diffusion model, and elemental analysis of bio adsorbent, the mechanism of adsorption of Pb(II) ions on porous adsorbents may involve four steps 1) diffusion of the ions to the external surface of adsorbent; 2) diffusion of ions into the pores of adsorbent; and 3) adsorption of the ions on the internal surface of adsorbent; 4) chelation between the electrondonating nature of O-, and N-containing groups in the Anethum graveolens and electron-accepting nature in Pb(II).
5. Conclusion
The desert plant residue, Anethum graveolens is a lowcost adsorbent which is abundantly available in Saudi Arabia and Libya as waste material. It can be used as an
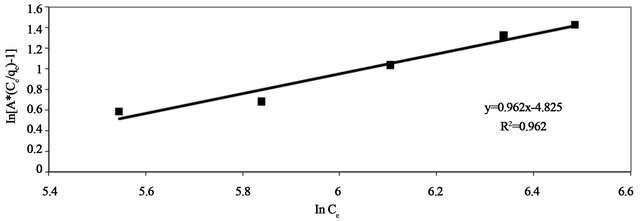
Figure 14. Redlich-Peterson adsorption plot of Pb(II) onto Anethum graveolens at 30˚C.
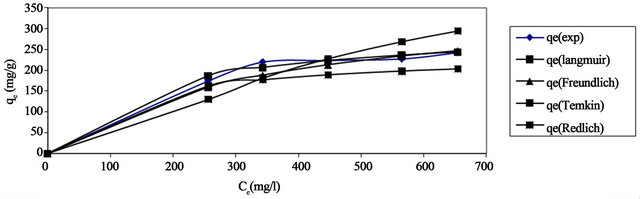
Figure 15. Comparision between different isotherm Pb(II) onto Anethum graveolens at 30˚C.
effective adsorbent for the removal and recovery of Pb(II) from wastewater. The adsorption of Pb(II) onto Anethum graveolens is pH dependent. The maximum adsorption capacity, Qmax was 303 mg/g at pH 4 and at 30˚C. The adsorption follows second-order and intraparticle diffusion kinetics. The adsorption process follows Langmuir and Redlich-Peterson isotherms but slightly fitted on Temkin and Freundlich models.
6. Acknowledgements
The authors thank Ibrahim Mohamed (Chemistry Department, Sebha University) for assistance during this work.
REFERENCES
- D. O. Zer and A. O. Zer, “Investigation of Zinc (II) Adsorption on Cladophora crispata in a Two-Staged Reactor,” Journal of Chemical Technology and Biotechnology, Vol. 75, No. 5, 2000, pp. 410-416.
- M. N. Rashed, “Lead Removal from Contaminated Water Using Mineral Adsorbents,” The Environmentalist, Vol. 21, No. 3, 2001, pp. 187-195. doi:10.1023/A:1017931404249
- C. S. Brooks, “Metal Recovery from Industrial Waste,” Lewis Publishers, Michigan, 1991.
- R. Roberto, F. R. Laura, M. G. C. Rosa and M. B. J. Jovita, “Adsorption of Trivalent Chromium from Aqueous Solutions onto Activated Carbon,” Journal of Chemical Technology and Biotechnology, Vol. 62, No. 1, 1995, pp. 64-67. doi:10.1002/jctb.280620110
- M. M. Nassar and M. S. El-Geundi, “Comparative Cost of Color Removal from Textile Effluents Using Natural Adsorbents,” Journal of Chemical Technology and Biotechnology, Vol. 50, No. 1, 1991, pp. 257-264. doi:10.1002/jctb.280500210
- G. McKay, “Adsorption of Dyestuffs from Aqueous Solutions with Activated Carbon, Part I: Equilibrium and Batch Contact-Time Studies,” Journal of Chemical Technology and Biotechnology, Vol. 32, No. 7-12, 1982, pp. 773-780 doi:10.1002/jctb.5030320713
- A. Hashem, A. M. Azzeer, and A. Ayoub, “Removal of Hg (II) Ions from Laboratory Wastewater onto Phosphorylated Haloxylon ammodendron: Kinetic and Equilibrium Studies,” Polymer-Plastics Technology and Engineering, Vol. 49, No. 4, 2010, pp. 1395-1404.
- A. A. Khalil, H. H. Sokker, A. Al-Anwar, A. Abd ElZaher and A. Hashem, “Preparation, Characterization and Utilization of Amidoximated Poly (AN/MAA)-Grafted Alhagi Residues for the Removal of Zn (II) from Aqueous Solution,” Adsorption Science & Technology, Vol. 27, No. 4, 2009, pp. 363-383. doi:10.1260/026361709790252669
- A. Hashem, A. Abdel-Lateff, S. Farag and D. M. Hussein, “Treatment of Alhagi Residues with Tartaric Acid for the Removal of Zn(II) Ions from Aqueous Solution,” Adsorption Science & Technology, Vol. 26, No. 9, 2008, pp. 661-678.
- A. Hashem, E. Abdel-Halim, H. A. Maauof, M. A. Ramadan and A. Abo-Okeil, “Treatment of Sawdust with Polyamine for Wastewater Treatment,” Energy Education Science and Technology, Vol. 19, 2007, pp. 45-58.
- A. Hashem, A. Abou-Okeil, A. El-Shafie and M. El-Sakhawy, “Grafting of High α-Cellulose Pulp Extracted from Sunflower Stalks for Removal of Hg (II) from Aqueous Solution,” Polymer-Plastics Technology and Engineering, Vol. 45, 2006, pp. 135-141.
- S. C. Tsai and K. W. Juang, “Comparison of Linear and Non-Linear Forms of Isotherm Models for Strontium Sorption on a Sodium Bentonite,” Journal of Radioanalytical and Nuclear Chemistry, Vol. 243, No. 3, 2000, pp. 741- 746. doi:10.1023/A:1010694910170
- Y. Nuhoglu and E. Oguz, “Removal of Copper (II) from Aqueous Solutions by Biosorption on the Cone Biomass of Thuja orientalis,” Process Biochemistry, Vol. 38, No. 11, 2003, pp. 1627-1631. doi:10.1016/S0032-9592(03)00055-4
- P. X. Sheng, Y. P. Ting and J. P. Chen, “Sorption of Lead, Copper, Cadmium, Zinc, and Nickel by Marine Algal Biomass: Characterization of Biosorptive Capacity and Investigation of Mechanisms,” Journal of Colloid and Interface Science, Vol. 275, No. 1, 2004, pp. 131-141. doi:10.1016/j.jcis.2004.01.036
- V. Padmavathy, P. Vasudevan and S. C. Dhingra, “Biosorption of Nickel(II) Ions on Baker’s Yeast,” Process Biochemistry, Vol. 38, No. 10, 2003, pp. 1389-1395. doi:10.1016/S0032-9592(02)00168-1
- S. V. Dimitrova, “Metal Sorption on Blast Furnace Slag,” Water Research, Vol. 30, No. 1, 1996, pp. 228-232. doi:10.1016/0043-1354(95)00104-S
- H. C. Trivedi, V. M. Patel and R. D. Patel, “Adsorption of Cellulose Triacetate on Calcium Silicate,” European Polymer Journal, Vol. 9, No. 6, 1973, pp. 525-533. doi:10.1016/0014-3057(73)90036-0
- Y. S. Ho and G. McKeay, “The Kinetics of Sorption of Divalent Metal Ions onto Sphagnum Moss Peat,” Water Research, Vol. 34, No. 3, 2000, pp. 735-742. doi:10.1016/S0043-1354(99)00232-8
- A. K. Bhattacharya and C. Venkobachar, “Removal of Cadmium(II) by Low Cost Adsorbent,” Journal of Environmental Engineering, Vol. 110, No. 1, 1984, pp. 110- 122. doi:10.1061/(ASCE)0733-9372(1984)110:1(110)
- E. Tutem, R. Apak and C. F. Unal, “Adsorptive Removal of Chlorophenols from Water by Bituminous Shale,” Water Research, Vol. 32, No. 8, 1998, pp. 2315-2324. doi:10.1016/S0043-1354(97)00476-4
- W. J. Weber and C. J. Morris, “Advances in Water Pollution Research,” Proceeding of 1st International Conference on Water Pollution Research, Vol. 2, Pregamon Press, Oxford, 1962, p. 231.
- V. J. P. Poots, G. McKay and J. J. Healy, “Removal of Basic Dye from Effluent Using Wood as an Adsorbent,” Journal of the Water Pollution Control Federation, Vol. 50, No. 5, 1978, pp. 926-939.
- K. Nagarethinam and M. S. Mariappan, “Kinetics and Mechanism of Removal of Methylene Blue by Adsorption on Various Carbons—A Comparative Study,” Dyes and Pigments, Vol. 51, No. 1, 2001, pp. 25-40. doi:10.1016/S0143-7208(01)00056-0
- S. H. Chien and W. R. Clayton, “Application of Elovich Equation to the Kinetics of Phosphate Release and Sorption on Soils,” Soil Science Society of America Journal, Vol. 44, No. 2, 1980, pp. 265-268. doi:10.2136/sssaj1980.03615995004400020013x
- I. Langmuir, “The Constitution and Fundamental Properties of Solids and Liquids,” Journal of the American Chemical Society, Vol. 38, No. 11, 1916, pp. 2221-2295. doi:10.1021/ja02268a002
- K. R. Hall, C. Eagleton, A. Acrivos and T. Vermevlem, “Pore and Solid Diffusion Kinetics in Fixed Bed Adsorption under Constant Pattern Conditions,” Industrial & Engineering Chemistry Fundamentals, Vol. 5, No. 2, 1966, pp. 212-223. doi:10.1021/i160018a011
- H. Freundlish, “Over the Adsorption in Solution,” The Journal of Physical Chemistry, Vol. 57, 1906, pp. 385- 470.
- M. J. Tempkin and V. Pyzhev, “Kinetics of Ammonia Synthesis on Promoted Iron Catalysts,” Acta Physiochim, URSS, Vol. 12, 1940, pp. 217-222.
- O. Redlich and D. Peterson, “A Useful Adsorption Isotherm,” Journal of Physical Chemistry, Vol. 63, No. 6, 1959, pp. 1024-1026. doi:10.1021/j150576a611
NOTES
*Corresponding author.