Atmospheric and Climate Sciences
Vol.3 No.3(2013), Article ID:34082,13 pages DOI:10.4236/acs.2013.33039
Green Areas and Microscale Thermal Comfort in Arid Environments: A Case Study in Mendoza, Argentina
Universidad Tecnológica Nacional/CONICET, Mendoza, Argentina
Email: epuliafito@frm.utn.edu.ar
Copyright © 2013 Salvador Enrique Puliafito et al. This is an open access article distributed under the Creative Commons Attribution License, which permits unrestricted use, distribution, and reproduction in any medium, provided the original work is properly cited.
Received April 2, 2013; revised May 3, 2013; accepted May 10, 2013
Keywords: UHI; PET Index; Local Climate Zones; Mobile Measurements; Urban Climate Comfort
ABSTRACT
A series of mobile and stationary meteorological measurements were performed in the city of Mendoza, Argentina to study the local influence of green areas on the urban canopy layer heat island effect at the micro scale, during the Austral summer of 2003-2005. These results were associated in representative local climate zones (LCZ), which helped to identify different thermal conditions within the city. The physiologically equivalent temperature index was used to determine the thermal comfort in each LCZ, showing that during daylight, trees and parks improve thermal comfort through shading and evapotranspiration; but at the same time, urban tree corridors delay night cooling by retaining warm air beneath their canopies. Also irrigation showed to positively influence on the extension and intensity of the cooling effect of rural areas and parks. The cooling influence of an urban park spreads out through the neighborhoods for 800 - 1000 m, with an average temperature decrease of 1.3˚C during daytime and >4.0˚C at nighttime.
1. Introduction
Increasing urbanization rates are associated with changes in land use and land cover (LULC), air pollution and a higher demand for energy and water consumption. These anthropogenic changes have increased the temperature difference between urban and rural or peripheral environments, the effect of which is known as “urban heat island” (UHI). Urban landscape units, such as buildings, streets, canyons, trees, gardens and parks interact differently with the adjacent atmospheric layers, both in spatial and temporal scales, depending on the solar radiation exposure, net longwave radiation exchange, and ventilation [1-4]. Urban climatologist recognizes two different interaction layers [1]: the urban canopy layer (UCL), which reaches from the ground surfaces to the roof level and the urban boundary layer (UBL), which is part of the planetary layer and lies above the UCL. The UCL is controlled by energy exchange at the micro scale, while the UBL is governed by local land uses and regional meteorology. At the horizontal scale three zones may be identified [1, 2]: 1) the micro scale, from individual building, tree or street to a city block size (0 - 100 m); 2) the local scale, from several homogenous blocks to a neighborhood (200 - 2000 m); and 3) the regional scale, which includes the city scale (5000 - 20,000 m). These vertical and horizontal scales generate two different UHI processes: the UCL_UHI and the UBL_UHI. The main causes for the onset of UCL_UHI are [1,4]: 1) changes in the surface albedo increases absorption of short-wave radiation and reduces long-wave radiation losses, leading to higher energy storage in buildings and constructed environments; 2) less turbulence in urban canyons reduces the sensible heat loss; 3) increased anthropogenic activities produces additional heat; 4) less vegetation reduces evapotranspiration rates. The magnitude of the UBL_UHI is influenced by the topography, the size of the city, wind speed, height and amount of clouds, and frequency of inversion layers [2,5]. Other additional causes may be attributed to the increasing particle concentration from urban pollution [6,7], which can alter the energy balance of the atmosphere, thus increasing local air temperatures and reducing cooling rates [8].
Purpose of This Study
Research on UHI has been presented in many articles based mostly on northern hemisphere cities with humid and temperate climate [9-11].
References [4,12] present a broad review on physical processes and measuring techniques, while [13] presents an extensive literature review of studies conducted on tropical and subtropical cities. However, relatively fewer studies have been conducted on arid environments with the exception of Phoenix where leading investigations have been performed for some time [9,14,15]. Other studies on arid environments were performed in Kuwait [16], Cairo [17], Ouagadougou [18], Eilat [19], Mexico City [20,21], Mexicali [22], Negev Desert [23] and Muscat [24]. Extreme air temperature conditions in arid climates, especially in summer days, exacerbate UHI effect, resulting in frequent thermal discomfort.
The purpose of this work is to contribute to the research on arid environments by studying the influence of vegetation (whether natural or irrigated) on thermal comfort in the city of Mendoza, Argentina. The field investigation is based on a series of mobile measurements calibrated with standard meteorological data collected from local weather stations. Changes in the irrigation regime are also used to study the influence of water availability on UBL_UHI. Consequently, this study aims to answer the following questions: 1) what is the temporal and spatial variation of temperature and humidity in an arid environment with regard to diverse LULC? And 2) how can green areas improve urban thermal comfort?
2. Material and Methods
2.1. Research Overview
To answer to the above questions, the following research methodology was adopted: 1) Local Climate Zones (LCZ) [25] were assigned to the city of Mendoza using LULC maps; 2) a mobile traverse was design to monitor temperature (T) and relative humidity (RH) in each LCZ type; 3) T, RH was evaluated at each measuring point (MP); 4) a thermal comfort index was calculated using the Physiologically Equivalent Temperature (PET) [26]; and 5) meteorological surface data from fixed stations was used to evaluate the influence of irrigation at an urban park in Benegas.
2.2. LULC and LCZ
The city of Mendoza (32˚S, 68˚W, height: 750 meters above sea level) is an urban center with approximately one million inhabitants, located in an arid region on the east side of the Andes Mountain Range in western Argentina (Figure 1). The constructed area has a predominant North/South extension, following the foothills of the Andes Mountains. Relative humidity is low (<50%) with mostly sunny days and low incidence of fog. Precipitation rates are low (230 mm·yr−1), with rain mainly occurring during Austral summer months (Dec. to Feb.).
The mean wind speed is low (<2 m·s−1) with a strong influence of calm days (26% of the year) (Figure 2). The prevailing winds follow a day-night cycle characterized by a typical mountain-valley circulation: solar heating on the valley side causes a slow up-slope wind flow during the daytime (ENE through SE); while at night, due to the rapid radiative cooling of the valley, the circulation reverses causing the air masses to move down the mountain from the S and WSW [27,28].
According to the tree census of Mendoza [29], the urban metropolitan area is forested with about 650,000 trees, the main species being: Morus alba (422,500 trees), Platanus hispanica/acerifolia (97,500 trees), and Fraxinussp (pennsylvanica and excelsior; 130,000 trees), all of which provide shade along the streets, sidewalks and building facades. The trees are distributed as 1st and 2nd magnitude, depending on their height, canopy type and robustness. On the western edge of the city, bordering the foothills, there is an extensive park, i.e. San Martin Park, which covers 393 hectares. Other smaller parks are distributed throughout the city. Additional descriptions of the manmade environment in the city of Mendoza can be found elsewhere [30-31].
The Land Use/Land Cover (LULC) data was obtained from the Global Land Cover Characterization (GLCC)
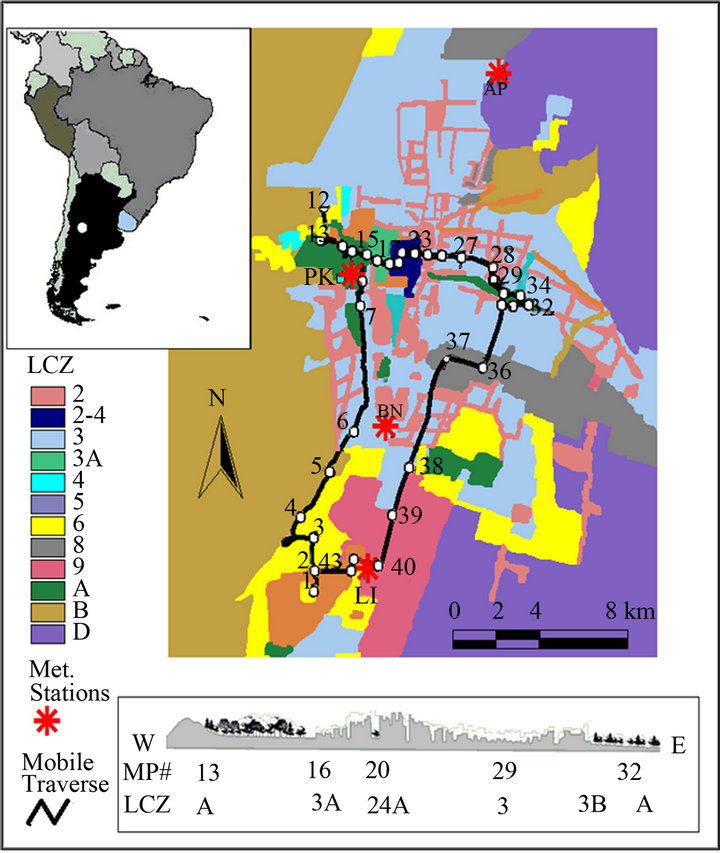
Figure 1. Overview of the Local Climate Zones (LCZ) of the city of Mendoza, Argentina (33˚S, 68˚W). The black thick contour indicates the mobile circuit and the numbers the location of the measuring points (MP). The red asterisks represent the meteorological weather stations: AP, Airport, PK, Park, BN, Benegas and LI, Luján-INTA. Below a WestEast schematic section along MP#13 through MP#32, with main LCZ.
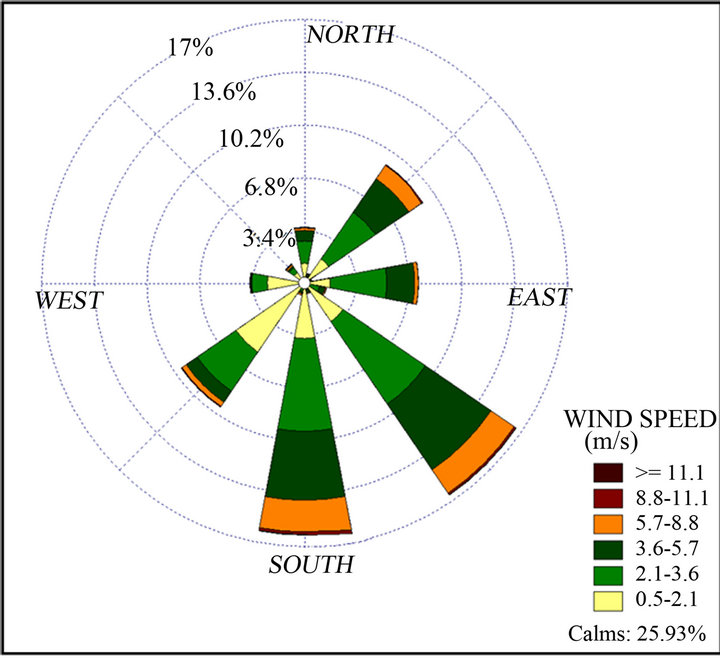
Figure 2. Yearly average wind pattern measured at the Mendoza Airport (2000-2010).
database captured at a 1-km resolution [32-33]. Finer features of land use were obtained using the soil classification from the Eco-Atlas Program from Mendoza’s Rural Development Institute (IDR) [34], which includes the interpretation and classification of Landsat images [35, 36]. 12 Local Climate Zones (LCZ) [25] were assigned to the Metropolitan Area of Mendoza, using the available LULC maps, aerial photography or Google-maps, population density maps and ground surveys of the area under study (Figure 1).
2.3. Mobile Measurements
Mobile measurements of temperature (T) and relative humidity (RH) were analyzed to study the UHI in the urban area of Mendoza. 44 measuring points (MP#) were defined to cover the micro-scale urban features for representative areas of the city and its periphery, including all types of LULC and LCZ (Table 1 and Figure 3): urban parks (Figures 3(a) and (e)), residential areas (Figures 3(b) and (f)), downtown streets with 1st (Figures 2(a) and (b)) and 2nd magnitude trees (Figures 3(b)-(d)); rural irrigated agricultural areas—mostly vineyards (Figure 3(g)), semiarid foothill areas—with natural xerophytic flora (Figure 3(h)). The continuous circuit was performed during three different daytime periods of stable temperature regimes: Early Morning, starting before sunrise at 5:30 a.m. Local Standard Time (LST = UTC − 3); Afternoon, beginning at 3:30 p.m. LST; and Late Evening, right after sunset (8:30 p.m. LST). All data were collected during the Austral summer months of December 2004, January and February 2005, selecting 15 complete runs with clear sky conditions during the three daily runs. Data were collected using an automatic Davis micro me-
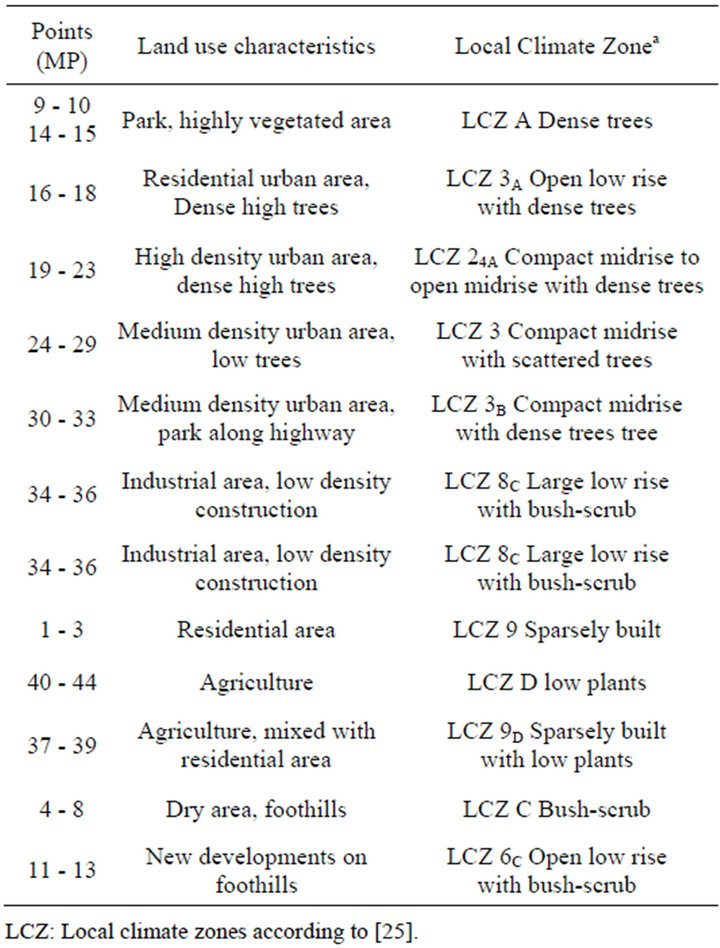
Table 1. Description of the land use characteristics and local climate zones of the measuring points.
teorological weather station (temperature (T) range: −40˚ to +65˚C, accuracy ±0.5˚C; relative humidity (RH) range: 0% a 100%, accuracy ± 3%) installed on the roof of a vehicle, which would stop a few minutes at each MP# before registering the data. The sensors were shielded against top radiation from the sun and reflected radiation from the vehicles roof. Each 80 km circuit trip lasted approximately 2 hours and consisted of two paths in a North-South and an East-West direction, starting and finishing at the same point in the southwest periphery (MP#1 = MP#44). Although T and RH were measured on stable temperature/humidity period of the day, a small departure is still present due to the time lag between the initial and end of the traverse. Each T and RH measurement was subtracted to its mean traverse value, obtaining a differential value DT and DRH. These incremental values have two components: the LCZ and the hourly variation contribution. The LCZ part was obtained by subtracting the proportional difference of the two closest hourly data (available from the fixed meteorological station) at the measurement time in each MP#.
2.4. Stationary Meteorological Stations
Meteorological data from four fixed stations have been used in this study (Figure 1): the Airport (AP) located in
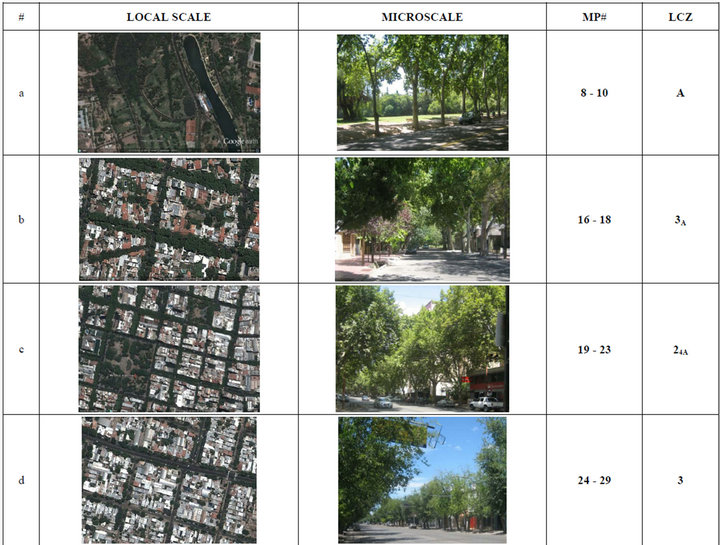
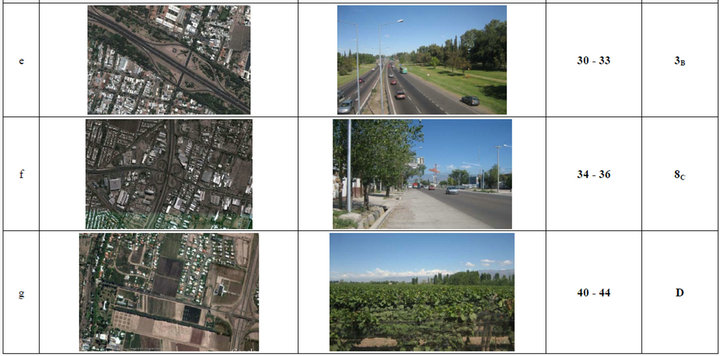
Figure 3. Aerial and ground photograph of the study area for particular measuring points representing the local scale (left panels) and the micro scale (center panels). The Right panel indicates the measuring position (MP) and the urban local climate zone (LCZ). For the localization of each MP see Figure 1; the description of the local climate zone is given in Table 1. Aerial photos are taken from Google Earth.
the northeast, San Martin Park (PK) in the west (Figure 3(a)), Lujan-INTA (LI) located in the south, and Benegas (BN) in a southern residential area. AP and PK stations (WMO #87418 and #87420, respectively) are weather stations operated by the Argentine Weather Meteorological Service (AWMS), and represent the northern noncultivated dry periphery and the urban park areas, respectively LI is an automatic station (iMetosII) operated by the National Institute for Agricultural Technology (INTA), located in the irrigated southern rural periphery (Figure 3(g)). Davis and Thies Instruments automatic stations are operated by the University of Mendoza in Benegas (BN) within a residential area
2.5. Thermal Comfort
A commonly used index for thermal comfort is the Physiological(ly) Equivalent Temperature (PET) index (˚C) [26]. Thermal comfort depends not only on local air temperature and humidity, but also on wind and radiative fluxes (i.e. directly exposed to sun radiation or under a tree shade), sky view factor (SVF), human physical internal heat production and the thermal resistance of clothing [37]. The PET index was determined with version 1.2 of the Rayman software [38].
PET calculates the amount of heat a human, would receive when exposed to sun radiation, compared to the same person under shaded conditions or in a building. Hemispherical fish-eye type photography of the sky above the measuring device under clear sky conditions was obtained, with a bitmap resolution of 3264 × 2448. This image was imported into the Rayman 1.2 software which then calculated the SVF. Solar radiation was measured at AP, PK and BN. For the mobile measurements, solar radiation was calculated according to the time of the year and hour of the day, calibrated by the fixed stations. The mean radiant temperature is calculated using the solar radiation and the SVF, which represents the percentage of direct solar incoming radiation reaching a shaded area compared to an open space with no shade.
Ref. [38] compared the application of PET on different cities and climatic conditions, such as Freiburg and Munich in Germany; Athens, Greece and Albuquerque, USA. Several other studies involving the PET index have been applied to subtropical arid environments: Ezrum, Turkey [39]; Lisbon, Portugal [40]; Fez, Morocco [41] and Sydney, Australia [42]. Regional bioclimatic studies or country spatial analyses using the PET index have been also undertaken, for example, in Argentina [43] and in Hungary [44]. The application of the PET as a comfort index for leisure, outdoor and recreational activities is also discussed in [45].
PET indices show higher variability than using solely meteorological values. This amplifying feature of PET was used in this study to compare heat stress and human thermal comfort in park areas, open rural areas and urban streets with different tree canopies and shades during the mobile measurements
3. Results
The information obtained by the mobile measurements was associated according to the LCZ characteristics (Table 1 and Figure 3) for three different time periods: Early Morning (EM), Afternoon (AF) and Late Evening (LE). Instead of the typical urban-rural difference, various UHI(LCZ1-LCZ2) or Urban Moisture Excess UME(LCZ1-LCZ2) [48,49] values can be built when considering differences between diverse local climate zones (LCZ1, LCZ2, ···).
3.1. Air Temperature (T)
The average traverse value (TAV) was 18.6˚C at EM, 30.3˚C at AF and 26.3˚C at LE. Temperatures recorded at each measuring point (T) were averaged for homogenous LCZ (TLCZ). Figure 4 show LCZ temperature differences with respect to the traverse mean value for each time period: ΔT = TLCZ – TAV.
1) Early Morning (EM). Mountain-valley circulation during these early morning hours slowly introduces (2 - 3 m·s−1) cool and dry air from the SW foothills towards the NE. The highest UHI magnitudes were obtained prior to sunrise: the constructed environment (LCZ 3A, 24A, 3 Table 1 and Figures 3(b)-(d)) were up to 1.5˚C higher than the mean traverse value, reaching an UHI(3-D) of 2.8˚C (UHI difference between urban, LCZ 3, minus the rural irrigated periphery, LCZ D).
2) Afternoon (AF). Urban-irrigated rural differences UHI(3-D) were at its lowest values 1.2˚C.
Temperature differences respect to the park area (LCZ A, Figure 3(a)) show that the downtown area (Figures 2(c) and (d)) UHI(3-A) was 0.6˚C. However the residential areas with dense trees—LCZ 3A, Figure 2(b)—reached similar values as the park (see also Section 3.3). The abundant shade of downtown streets (LCZ 24A) provide better thermal conditions than those with lower trees (LCZ 3): UHI(24A-3) = 0.8˚C. The rural arid environment was warmer than the rural irrigated areas, mostly as a consequence of the lack of shading.
3) Late Evening (LE). By this time, the sun had already set and there was no longer any direct solar radiation on horizontal surfaces in the urban area although the air temperature was still very warm. LE show slightly lower UHI results than EM. A strong spatial variation was observed in temperature between vegetated and impermeable surfaces as they started to release stored heat. Air temperatures in areas near the foothills and neighborhoods located close to parks were lower than the con-
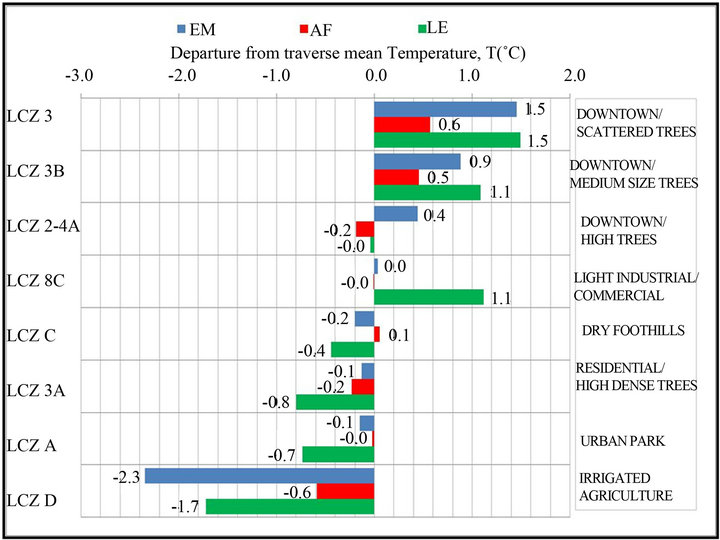
Figure 4. Mobile measurements in the City of Mendoza: departure from mean traverse temperature (˚C) differences for the main local climate zones (LCZ).
structed downtown environment (less than 1˚C). The rapid evaporative cooling of the periphery reduces the rural air temperature faster than in urban areas, enhancing the UHI during night hours (UHI(3-D) > 2˚C) [46-49].
3.2. Relative Humidity (RH) and Water Vapor Partial Pressure (E)
The average traverse relative humidity and partial pressure was 62% and 13.25 hPa at EM respectively, 30% and 12.85 hPa at AF respectively, and finally 42% and 14.15 hPa at LE respectively. Similarly to Figure 4, Figure 5 show ΔRH while Figure 6 plots ΔE, both as differences of the respective averaged LCZ value with respect to the traverse mean value for each time period.
1) Early Morning. Due to cool air temperatures at this time of the day, RH was high, ranging between 60% and 65%. Downtown area was on average 14% drier than the rural irrigated area (LCZ D), showing an UME of 0.8 hPa. With regard to the drier areas (LCZ C), the constructed areas (LCZ 2A, 3) were 2.8% drier (RH), with a low UME of 0.4 hPa. Parks were higher than 4% RH more humid than any constructed environment, but 6% drier than rural periphery.
2) Afternoon. This time showed the minimum RH variations. The constructed environment was 2% lower than the irrigated park and rural periphery. However, interestingly the residential areas with high trees (LCZ2-4A) produced an average 1.2% RH (0.2 hPa) higher than other downtown areas (LCZ 2A), showing the evapotranspiration excess produced by the trees. The higher downtown temperatures produced an UME of 0.8 hPa as compared to the rural periphery and only 0.5 hPa as compared to the dry periphery (Figure 2(h)).
3) Late Evening. A marked difference in ambient humidity was also observed between the humid green areas and the dry periphery: parks and irrigated rural areas showed E ³ 14 hPa, while dry areas showed E < 14 hPa. The urban areas present a 1.4 hPa average UME. Dry areas (LCZ C) had a traverse average DE = −1.4 hPa compared to DE = 2.5 hPa with respect to the irrigated rural periphery.
3.3. Physiological(ly) Equivalent Temperature (PET)
The average traverse value (PETAV) was 18.0˚C at EM, 46.7˚C at AF and 23.8˚C at LE. Figure 7 show PET differences with respect to the traverse mean value for each time period (ΔPET = PETLCZ – PETAV).
1) Early Morning. The PET index during this circuit showed low cool stress values in the periphery and acceptable comfort indices in downtown areas. Green areas showed slightly higher PET values as these were taken below the tree canopy. The same situation was observed in the first part of the downtown area (LCZ 3A, 2-4A; Figures 3(b) and (c)) with high buildings and 1st magnitude (tall and wide canopies) trees along the streets. The presence of both trees and buildings interrupt the wind surface flow and retain part of the daily heat. In contrast, the second part of the downtown area (LCZ 3) has 2nd magnitude (lower and smaller canopies) trees
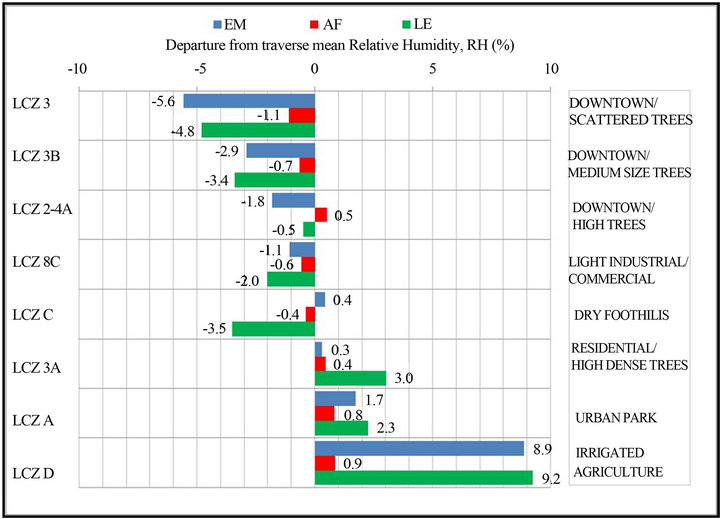
Figure 5. Mobile measurements in the City of Mendoza: departure from mean traverse relative humidity (%) differences for the main local climate zones (LCZ).
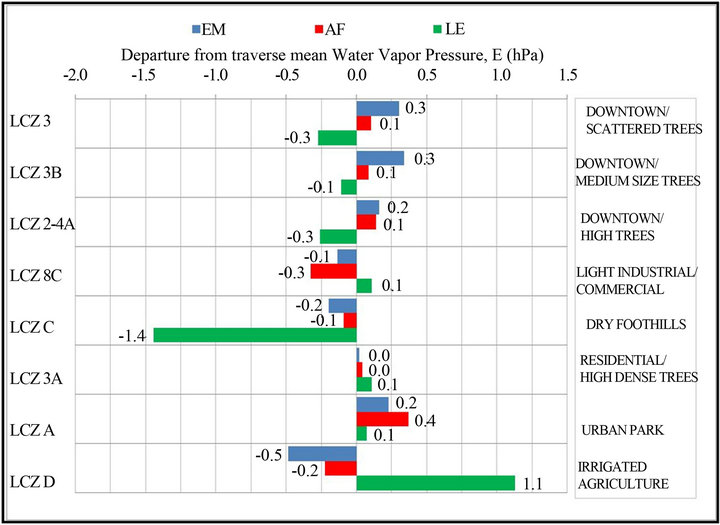
Figure 6. Mobile measurements in the City of Mendoza: departure from mean traverse water vapor partial pressure (hPa) differences for the main local climate zones (LCZ).
and lower buildings (Figure 3(d)). Large trees canopies reduce nocturnal cooling as they block the outgoing net longwave radiation. Heat from this sector had been completely removed by upwelling long wave radiation and wind flow, producing a lower PET index. Despite these differences, close to 7 a.m., the entire area under study had acceptable thermal comfort values. At this point of the day, the sensible heat of the previous day had been removed from the different types of surfaces, leaving only the natural, regional summer time conditions.
2) Afternoon. PET values showed a very hot temperature perception (>41˚C) in all environments (urban, dry foothills or cultivated/green areas). Park and residential areas had at least 2˚C to 4˚C lower PET values than the
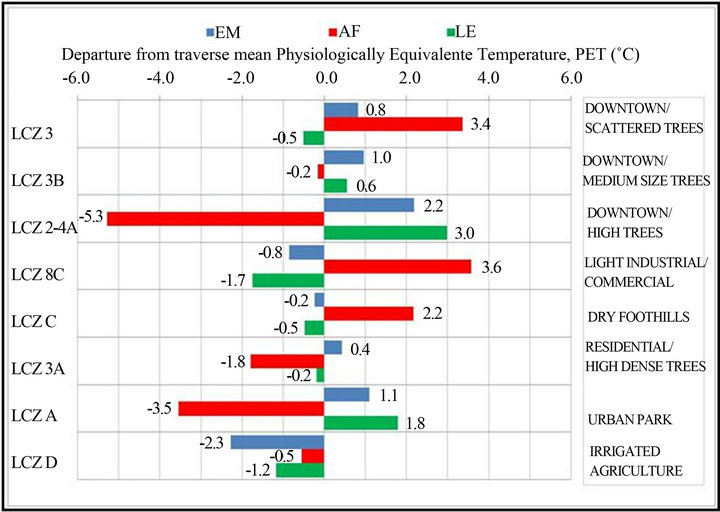
Figure 7. Mobile measurements in the City of Mendoza: departure from mean traverse PET (˚C) differences for the main local climate zones (LCZ).
periphery mainly because of tree shade. 1st magnitude trees along the streets (LCZ 3A; 2-4A) produce abundant shade and evapotranspiration reaching ΔPET of −5.3˚C. In contrast, measurements performed under direct sun radiation had higher PET values than in its surroundings.
3) Late Evening. PET reached comfort values (18˚C - 23˚C) first in the drier SW foothills and in plain areas located in the NE part of the city. The relative higher PET values found in park areas and downtown are attributed to the existence of high tree densities, which reduce the night radiative cooling by restricting the wind circulation and keeping warm air partially beneath the tree canopies.
3.4. Extension and Intensity of Green Area Effects
The mobile measurements and the data analysis of the meteorological stations highlight the extension of the cooling influence of green areas, such as San Martin Park (PK) (MP#8-10; Figure 3(a)) and East Highway Park (MP#30-33, Figure 3(e)), over their surroundings. Figure 8 show a traverse slice of the typical UHI effect found in Mendoza for different moments of a summer day as a function of the distance to the park edge. If the warmer downtown point (MP#28 in LCZ 3) is taken as a reference point, it can be observed that temperature decreases as we move closer to the park edges (MP#15 and MP#30). Figure 8 shows a first sector up to a distance of 450 m eastward from the park with maximum temperature differences directly influenced by the park coolness. This effect extended throughout the width of the park with maximum differences of −1.5˚C during the day and higher than −3.5˚C at nighttime (LCZ 3A). A second sector, from 450 to 1200 m eastward from the park, covering a residential area, had air temperatures slightly above the park boundaries, which indicate a mixed effect of park influences and dense shade from 1st magnitude canopy trees (MP#18-22; LCZ 2-4A). Continuing further eastward into the downtown area, in a third sector (2000 - 6000 m eastward), the air temperature increases as the distance from the park increases. This area of the city (MP# 23-28; LCZ 3) is characterized by 2nd magnitude trees and lower buildings heights. Similarly, by using the mobile measurements it was possible to detect a 200 - 300 m influence in a north-south direction from East Highway Park, reducing the surrounding temperatures by up to 1˚C at night, depending on the prevailing wind direction. Other studies have also found that nearby cooling effect of urban parks may reach from 500 to 1000 m perpendicular to the border of an urban park, depending on the size of green areas compared to build up areas, local wind speed and water availability in soils [21,49-52].
3.5. Effect of Irrigation
The effect of irrigation on ambient air temperature and relative humidity was studied considering a Well Irrigated Period (WIP, from Dec. 3, 2003 to Jan. 22, 2004) and a Less Irrigated Period (LIP, from Jan. 23, 2004 to Feb. 29, 2004), at the campus of Benegas (BN station). Rainfall precipitation was absent during WIP (which was warmer) and was 52 mm during LIP. AWMS data comparison showed that during the LIP period, T and RH
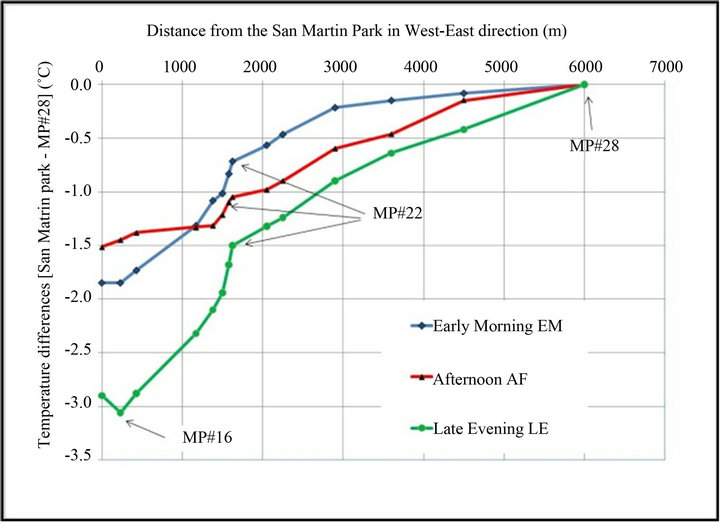
Figure 8. Differences in measured mobile circuit temperature with respect to the temperature at the downtown reference point MP#28 as a function of the distance to the park edge in West-East direction (m). The San Martin Park edge is located at MP#15. Characteristics of the circuit are given in Figure 1, Figure 3 and Table 1.
were lower at BN than at the airport (AP), while during WIP BN was colder but had higher relative humidity than AP. Then, in order to decouple the regional micrometeorological situation from the local irrigation effect, a one way ANOVA test was performed on the differences between the hourly mean values of T and E at BN and AP, comparing both periods [(BN - AP)WIP vs. (BN - AP)LIP]. A full dataset of 912 hours for each period, divided into 418 night-time data (8 p.m. to 6 a.m.) and 494 day-time data (7 a.m. to 7 p.m.) was considered. The day/night time sub-sampling was performed because the hourly variation of T and E is much more pronounced during the day due to the presence of direct radiation, while night shifts are usually inversed during the night. Table 2 shows the ANOVA results for T and E between the BN and AP stations for the two irrigated periods. The original null hypothesis (no significant difference between WIP and LIP periods) can be rejected for both day and night hours, but more clearly for vapor pressure than for temperature especially for the entire day. The analysis showed that Benegas station had higher humidity during WIP than during LIP, which can be directly attributed to the presence of irrigation. The effect was more marked during the day (ΔE = 4 hPa) than at night (ΔE = 2.4 hPa). Changes in temperature are different depending on the time of the day they are registered: BN was colder during WIP at night (ΔT = −0.5˚C) but slightly warmer during the day (ΔT = 0.15˚C). These results confirm that during night hours irrigated grass produce refreshment due to irrigation. However, in daylight hours during WIP, BN was slighter warmer due to evaporation from the humid soils and the high surface temperature of grass at midday hours. Considering both time conditions, the overall result is a net temperature reduction especially during night hours.
4. Discussions
The surrounding areas of the city of Mendoza show different land uses and local climate zones: west and north of downtown area is dominated by dry foothills (W) and dry plains (N-NE); while to the south and south east, there are agriculture irrigated areas. Hence, various temperature differences may be calculated according to the LCZ considered, helping the comparison with other arid environments. At least two main different contexts are highlighted: 1) an urban (constructed impervious environment) compared to a rural dry environment (UHI_ dry), and 2) an urban compared to an irrigated periphery including extended parks (UHI_irr). The UHI_irr has the strongest values oscillating between 1.3˚C at noon and 3˚C at night, associated with urban excess moisture of 1.2 hPa. UHI_dry is less pronounced, oscillating between 0.7˚C and 1.7˚C and with an UME most noticeable during evening hours of 2.4 hPa, due to warm air and wind circulation.
After comparing irrigated and non irrigated situations at BN, this study has shown that parks, turf/grass surfaces and agriculture areas have higher relative humidity
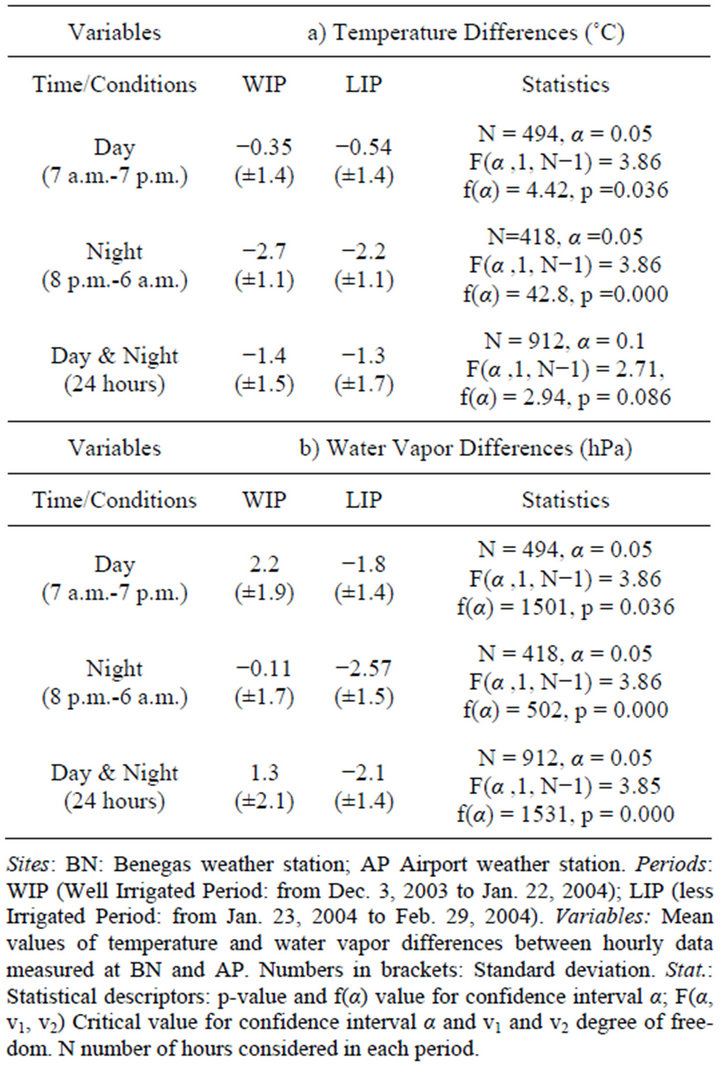
Table 2. One way ANOVA comparison of temperature and water vapor differences [(BN - AP)WIP vs. (BN - AP)LIP] for two periods: WIP and LIP.
(day and night), better thermal comfort and higher cooling effect when irrigation is present, as compared to arid periphery and foothills (both covered with xeric or scarce vegetation). This study also showed that cooling effect of urban parks expanded at least over 500 - 800 m into the surrounding urban area, showing similar results to other arid cities [50].
At a regional scale, it was observed that the UHI/UME effects are additionally governed by the topography and wind patterns. Several years of summer hourly averages show that RH at the dry periphery (AP) is drier than the irrigated periphery (LI) during the first hours in the morning (2 to 9 a.m.), while the opposite occurs during late hours (7 to 10 p.m.). This oscillation can be explained through the mountain-valley wind circulation. In the evening, a slow SW wind blows dry and cool air from the foothills through the city. As wind passes through the urban areas increases its temperature and humidity; and then, the airport (located in the dry periphery in the prevailing wind direction) receives an increase in moisture as compared to southern periphery (>2 hPa). During the afternoon, the opposite occurs; dry air from NE plains dissipates any additional moisture existing during nighttime hours. This permanent wind circulation pattern influences the spatial-temporal evolution of the UHI effect. If winds blowing towards the city go through arid areas (with scarce vegetation) during the day, more heat enters the city (producing greater discomfort); however, if these winds are nocturnal, they introduce cooler air to the city, alleviating the UHI. Consequently, a cooling strategy is to avoid new urban development in the main prevalent night wind directions.
First magnitude trees provide abundant shade along streets, pedestrian walkways and building surfaces. They prevent high solar radiation reaching the surfaces, thus reducing ambient air temperature during daylight. However, first and second magnitude trees reduce the wind velocity and retain part of the warm air beneath their canopies, causing the night radiative cooling to be slower or delayed towards later night hours, as shown by the PET calculations. Nevertheless, the thermal comfort benefit of dense canopies during noon hours, are larger than the reduced comfort during night time.
The above discussions suggest increasing urban forestry and other greening options to mitigate UHI [10,11, 53], but at the expenses of large amounts of water consumption, which may compromise the sustainability of arid cities [54]. In the foothills, xeric plants with low water consumption produces less cooling effect than large irrigated parks [15].
5. Conclusion
Results of this study have shown that 1) UHI intensity is largest at night (before sunrise); 2) LCZ classification is useful to characterize UHI; 3) larger UHI magnitudes are observed when the rural peripheral area is an irrigated agricultural/park area in contrast to dry foothills with xeric vegetation; 4) regional wind circulation regulates UME; 5) PET is a relevant index for characterizing thermal comfort; and 6) at summer midday trees and parks improve thermal comfort but delay night cooling. However, the day/night thermal comfort balance favors the use of large-medium trees.
6. Acknowledgements
We thank the authorities of the Argentina National Technological University and the Research Council CONICET for their support in our research activities. We also acknowledge Prof. A. Matzarakis (University of Freiburg, Germany) for allowing us the use of Rayman Software for the calculation of the PET index. We further thank the Argentine National Weather Service (Servicio Meteorológico Nacional) for making available the Mendoza Airport and Park surface meteorological data. We also acknowledge the Argentine National Institute for Agricultural Technology (Instituto Nacional de Tecnología Agropecuaria), and the University of Mendoza for letting us use the meteorological data from Lujan-INTA and Benegas, respectively.
REFERENCES
- T. Oke, “The Distinction between Canopy and Boundary-Layers Heat Islands,” Atmosphere, Vol. 14, 1976, pp. 268-277.
- T. Oke, “The Energetic Basis of the Urban Heat Island,” Quarterly Journal of the Royal Meteorological Society, Vol. 108, No. 455, 1982, pp. 1-24.
- C. Grimmond, C. Souch and M. Hubblel, “Influence of Tree Cover on Summertime Surface Energy Balance Fluxes, San Gabriel Valley, Los Angeles,” Climate Research, Vol. 6, No. 1, 1996, pp. 45-57. doi:10.3354/cr006045
- A. J. Arnfield, “Two Decades of Urban Climate Research: A Review of Turbulence, Exchanges of Energy and Water, and the Urban Heat Island,” International Journal of Climatology, Vol. 23, No. 1, 2003, pp. 1-26. doi:10.1002/joc.859
- I. Eliasson and B. Holmer, “Urban Heat Island Circulation in Göteborg, Sweden,” Theoretical and Applied Climatology, Vol. 42, No. 3, 1990, pp. 187-196. doi:10.1007/BF00866874
- P. Crutzen, “New Directions: The Growing Urban Heat and Pollution ‘Island’ Effect; Impact on Chemistry and Climate,” Atmospheric Environment, Vol. 38, No. 21, 2004, pp. 3539-3540. doi:10.1016/j.atmosenv.2004.03.032
- C. Sarrat, A. Lemonsu, V. Masson and D. Guedalia, “Impact of Urban Heat Island on Regional Atmospheric Pollution,” Atmospheric Environment, Vol. 40, No. 10, 2006, 1743-1758. doi:10.1016/j.atmosenv.2005.11.037
- H. Akbari, M. Pomerantz and H. Taha, “Cool Surfaces and Shade Trees to Reduce Energy Use and Improve Air Quality in Urban Areas,” Solar Energy, Vol. 70, No. 3, 2001, pp. 295-310. doi:10.1016/S0038-092X(00)00089-X
- A. Brazel, N. Selover, R. Vose and G. Heisler, “The Tale of Two Climates—Baltimore and Phoenix Urban LTER Sites,” Climate Research, Vol. 15, 2000, pp. 123-135. doi:10.3354/cr015123
- T. Oke, “The Micrometeorology of the Urban Forest,” Journal of Philosophical Transactions of the Royal Society B: Biological Sciences, Vol. 324, No. 1223, 1989, pp. 335-349. doi:10.1098/rstb.1989.0051
- H. Taha, “Urban Climates and Heat Islands: Albedo, Evapotranspiration, and Anthropogenic Heat,” Energy and Buildings, Vol. 25, No. 2, 1997, pp. 99-103. doi:10.1016/S0378-7788(96)00999-1
- P. Mirzaei and F. Haghighat, “Approaches to Study Urban Heat Island. Abilities and Limitations,” Building and Environment, Vol. 45, No. 10, 2010, pp. 2192-2201. doi:10.1016/j.buildenv.2010.04.001
- M. Roth, “Review of Urban Climate Research in (sub) Tropical Regions,” International Journal of Climatology, Vol. 27, No. 14, 2007, pp. 1859-1873. doi:10.1002/joc.1591
- S. Guhathakurta and P. Gober, “The Impact of the Phoenix Urban Heat Island on Residential Water Use,” Journal American Planning Association, Vol. 73, No. 3, 2007., pp. 317-329. doi:10.1080/01944360708977980
- W. Chow and A. Brzazel, “Assessing Xeriscaping as a Sustainable Heat Island Mitigation Approach for a Desert City,” Building and Environment, Vol. 47, 2012, pp. 170-181. doi:10.1016/j.buildenv.2011.07.027
- H. Nasrallah, A. Brazel and R. Balling, “Analysis of the Kuwait City Urban Heat Island,” International Journal of Climatology, Vol. 10, No. 4, 2006, pp. 401-405. doi:10.1002/joc.3370100407
- S. Robaa, “Urban-Suburban/Rural Differences over Greater Cairo, Egypt,” Atmósfera, Vol. 16, 2003, pp. 157-171.
- J. Lindén, “Nocturnal Cool Island in the Sahelian City of Ouagadougou, Burkina Faso,” International Journal of Climatology, Vol. 31, No. 4, 2011, pp. 605-620. doi:10.1002/joc.2069
- M. Sofer and O. Potchter, “The Urban Heat Island of a City in an Arid Zone: The Case of Eilat, Israel,” Theoretical and Apply Climatology, Vol. 85, No. 1-2, 2006, pp. 81-88. doi:10.1007/s00704-005-0181-9
- T. Oke, R. Spronken-Smith, E. Jauregui and C. Grimmond, “The Energy Balance of Central Mexico City during the Dry Season,” Atmospheric Environment, Vol. 33, No. 24-25, 1999, pp. 3919-3930. doi:10.1016/S1352-2310(99)00134-X
- E. Jauregui, “Heat Island Development in Mexico City,” Atmospheric Environment, Vol. 31, No. 22, 1997, pp. 3821-3831. doi:10.1016/S1352-2310(97)00136-2
- R. Garcia-Cueto, E. Jauregui and A. Tejeda, “Urban/ Rural Energy Balance Observations in a Desert City in Northern Mexico,” Proceedings of Fifth International Conference on Urban Climate, Lodz, September 2003, pp. 177-180.
- D. Pearlmutter, P. Berliner and E. Shaviv, “Urban Climatology in Arid Regions: Current Research in the Negev desert,” International Journal of Climatology, Vol. 27, No. 14, 2007, pp. 1875-1885. doi:10.1002/joc.1523
- Y. Charabi and A. Bakhit, “Assessment of the Canopy Urban Heat Island of a Coastal Arid Tropical City: The Case of Muscat, Oman,” Atmospheric Research, Vol. 101, No. 1-2, 2011, pp. 215-227. doi:10.1016/j.atmosres.2011.02.010
- I. Stewart and T. Oke, “Local Climate Zones for Urban Temperature Studies,” Bulletin of the American Meteorological Society, Vol. 93, No. 12, 2012, pp. 1879-1900. doi:10.1175/BAMS-D-11-00019.1
- P. Höppe, “The Physiological Equivalent Temperature— A Universal Index for the Biometeorological Assessment of the Thermal Environment,” International Journal of Biometeorology, Vol. 43, No. 2, 1999, pp. 71-75. doi:10.1007/s004840050118
- U. Schlink, O. Herbarth, M. Richter, J. L. Puliafito, M. Rehwagen, C. Puliafito, J. C. Behler and E. Puliafito, “Ozone-Monitoring in Mendoza, Argentina: Initial Results,” Journal of Air and Waste Management Association, Vol. 49, No. 1, 1999, pp. 82-87. doi:10.1080/10473289.1999.10463780
- E. Puliafito, M. Guevara and C. Puliafito, “Characterization of Urban Air Quality Using GIS as a Management System,” Environmental Pollution, Vol. 122, No. 1, 2003, pp. 105-117. doi:10.1016/S0269-7491(02)00278-6
- E. Martínez-Carretero, “The Synanthropic Flora in the Mendoza (Argentina) Urban Area,” Urban Ecosystem, Vol. 13, No. 2, 2010, pp. 237-242. doi:10.1007/s11252-009-0117-8
- M. Arboit, A. Diblas, J. Fernández Llano and C. de Rosa, “Assessing the Solar Potential of Low-Density Urban Environments in Andean Cities with Desert Climates: The Case of the City of Mendoza, in Argentina,” Renewable Energy, Vol. 33, No. 8, 2008, pp. 1733-1748. doi:10.1016/j.renene.2007.11.007
- E. Correa, C. Martinez, A. Cantón and C. de Rosa, “Seasonal Impact of Building Densities and Urban Tree Configurations on the Thermal Conditions in Urban Canyons. The Case of Mendoza Metropolitan Area in Argentina,” 25th Conference on Passive and Low Energy Architecture, PLEA, 2008.
- US Geological Survey (USGS), “The Global Land Cover Characterization (GLCC) Database,” 2010. http://www.src.com/datasets/GLCC_Info_Page.html
- O. Arino, J. Ramos, V. Kalogirou, P. Defoumy and F. Achard, “GlobCover 2009,” In: ESA Living Planet Symposium, Bergen, Norway, 2010, p. 686.
- Instituto de Desarrollo Rural (IDR), “Programa Ecoatlas.” http://www.ecoatlas.org.ar/
- P. Cremades, S. E. Puliafito, D. Allende and R. Fernandez, “An Approach for Using Remote Sensing Products and Ground Observations in the Evaluation of a Numerical Weather Prediction Model,” In: O. Möller, J. W. Signorelli and M. A. Storti, Eds., Mecánica Computacional, 2011, pp. 3529-3542.
- S. E. Puliafito, D. Allende, R. Fernández, F. Castro and P. Cremades, “New Approaches for Urban and Regional Air Pollution Modelling and Management,” In: F. Nejadkoorki, Ed., Advance in Air Pollution, Intech, Morn Hill, 2011, pp. 429-454.
- A. Matzarakis and H. Mayer, “Heat Stress in Greece,” International Journal of Biometeorology, Vol. 41, No. 1, 1997, pp. 34-39. doi:10.1007/s004840050051
- A. Matzarakis, H. Mayer and M. Iziomon, “Applications of a Universal Thermal Index: Physiological Equivalent Temperature,” International Journal of Biometeorology, Vol. 43, No. 2, 1999, pp. 76-84. doi:10.1007/s004840050119
- S. Toy and S. Yilmaz, “Thermal Sensation of People Performing Recreational Activities in Shadowy Environment: A Case Study from Turkey,” Theoretical and Applied Climatology, Vol. 101, No. 3-4, 2010, pp. 329-343. doi:10.1007/s00704-009-0220-z
- H. Andrade and M. Alcoforado, “Microclimatic Variation of Thermal Comfort in a District of Lisbon (Telheiras) at Night,” Theoretical and Applied Climatology, Vol. 92, No. 3-4, 2008, pp. 225-237. doi:10.1007/s00704-007-0321-5
- E. Johansson, “Influence of Urban Geometry on Outdoor Thermal Comfort in a Hot Dry Climate: A Study in Fez, Morocco,” Building and Environment, Vol. 41, No. 10, 2006, pp. 1326-1338. doi:10.1016/j.buildenv.2005.05.022
- J. Spagnolo and R. de Dear, “A Field Study of Thermal Comfort in Outdoor and Semi-Outdoor Environments in Subtropical Sydney Australia,” Building and Environment, Vol. 38, No. 5, 2003, pp. 721-738. doi:10.1016/S0360-1323(02)00209-3
- A. Helbig, A. Matzarakis and E. Piacentini, “North-South Variation of Bioclimatic Parameters in Argentina during Summer Months,” In: A. Matzarakis, C. R. de Freitas and D. Scott, Eds., Developments in Tourism Climatology, 2007, pp. 66-73.
- A. Gulyás and A. Matzarakis, “Selected Examples of Bioclimatic Analysis Applying the Physiologically Equivalent Temperature in Hungary,” Acta Climatologica Et Chorologica, Vol. 40-41, 2007, pp. 37-46.
- A. Gulyás, J. Ungerand and A. Matzarakis, “Assessment of the Microclimatic and Human Comfort Conditions in a Complex Urban Environment: Modelling and Measurements,” Building and Environment, Vol. 41, No. 12, 2006, pp. 1713-1722. doi:10.1016/j.buildenv.2005.07.001
- B. Holmer and I. Eliasson, “Urban-Rural Vapour Pressure Differences and Their Role in the Development of Urban Heat Islands,” International Journal of Climatology, Vol. 19, No. 9, 1999, pp. 989-1009. doi:10.1002/(SICI)1097-0088(199907)19:9<989::AID-JOC410>3.0.CO;2-1
- W. Kuttler, S. Weber, J. Schonnefeld and A. Hesselschwerdt, “Urban/Rural Atmospheric Water Vapour Pressure Differences and Urban Moisture Excess in Krefeld, Germany,” International Journal of Climatology, Vol. 27, No. 14, 2007, pp. 2005-2015. doi:10.1002/joc.1558
- B. Ackerman, “Climatology of Chicago Area UrbanRural Differences in Humidity,” Journal of Climate and Applied Meteorology, Vol. 26, No. 3, 1987, pp. 427-430. doi:10.1175/1520-0450(1987)026<0427:COCAUR>2.0.CO;2
- S. Hamada and T. Ohta, “Seasonal Variations in the Cooling Effect of Urban Green Areas on Surrounding Urban Areas,” Urban Forestry & Urban Greening, Vol. 9, No. 1, 2010, pp. 15-24. doi:10.1016/j.ufug.2009.10.002
- R. Spronken-Smith and T. Oke, “The Thermal Regime of Urban Parks in Two Cities with Different Summer Climates,” International Journal of Remote Sensing, Vol. 19, No. 11, 1998, pp. 2085-2104. doi:10.1080/014311698214884
- L. Shashua-Bar, D. Pearlmutter and E. Erell, “The Cooling Efficiency of Urban Landscape Strategies in a Hot Dry Climate,” Landscape and Urban Planning, Vol. 92, No. 3-4, 2009, pp. 179-186. doi:10.1016/j.landurbplan.2009.04.005
- J. Georgi and D. Dimitriou, “The Contribution of Urban Green Spaces to the Improvement of Environment in Cities: Case Study of Chania, Greece,” Building and Environment, Vol. 45, No. 6, 2010, pp. 1401-1414. doi:10.1016/j.buildenv.2009.12.003
- D. Bowler, L. Buyung-Ali, T. Knight and A. Pullin, “Urban Greening to Cool Towns and Cities: A Systematic Review of the Empirical Evidence,” Landscape and Urban Planning, Vol. 97, No. 3, 2010, pp. 147-155. doi:10.1016/j.landurbplan.2010.05.006
- P. Gober, “Desert Urbanization and the Challenges of Water Sustainability,” Current Opinion in Environmental Sustainability, Vol. 2, No. 3, 2010, pp. 144-150. doi:10.1016/j.cosust.2010.06.006