International Journal of Astronomy and Astrophysics
Vol.4 No.1(2014), Article ID:43574,17 pages DOI:10.4236/ijaa.2014.41012
Developing an Advanced Prototype of the Acousto-Optical Radio-Wave Spectrometer for Studying Star Formation in the Milky Way
Alexandre S. Shcherbakov, Abraham Luna
National Institute for Astrophysics, Optics & Electronics (INAOE), Puebla, Mexico
Email: alex@inaoep.mx, aluna@inaoep.mx
Copyright © 2014 by authors and Scientific Research Publishing Inc.
This work is licensed under the Creative Commons Attribution International License (CC BY).
http://creativecommons.org/licenses/by/4.0/


Received 29 November 2013; revised 25 December 2013; accepted 3 January 2014
ABSTRACT
The designed practically prototype of an advanced acousto-optical radio-wave spectrometer is presented in a view of its application to investigating the Milky Way star formation problems. The potential areas for observations of the cold interstellar medium, wherein such a spectrometer can be exploited successfully at different approximations, are: 1) comparison of the Milky Way case with extragalactic ones at scale of the complete galactic disk; 2) global studies of the Galactic spiral arms; and 3) characterization of specific regions like molecular clouds or star clusters. These aspects allow us to suggest that similar instrument will be really useful. The developed prototype of spectrometer is able to realize multi-channel wideband parallel spectrum analysis of very-highfrequency radio-wave signals with an improved resolution power exceeding 103. It includes the 1D-acousto-optic wide-aperture cell as the input device for real-time scale data processing. Here, the current state of developing this acousto-optical spectrometer in frames of the astrophysical instrumentation is briefly discussed, and the data obtained experimentally with a tellurium dioxide crystalline acousto-optical cell are presented. Then, we describe a new technique for more precise spectrum analysis within an algorithm of the collinear wave heterodyning. It implies a two-stage integrated processing, namely, the wave heterodyning of a signal in an acoustically square-law nonlinear medium and then the optical processing in the same solid-state cell. Technical advantage of this approach lies in providing a direct multi-channel parallel processing of ultra-high-frequency radio-wave signals with the resolution power exceeding 104. This algorithm can be realized on a basis of exploiting a large-aperture effective acousto-optical cell, which operates in the Bragg regime and performs the ultra-high-frequency co-directional collinear acoustic wave heterodyning. The general concept and basic conclusions here are confirmed by proof-ofprinciple experiments with the specially designed cell of a new type based on a lead molybdate crystal.
Keywords:Star Formation; Astronomical Instrumentation; Cold Interstellar Medium; Acousto-Optical Spectrum Analysis; Frequency Bandwidth and Resolution; Wide-Aperture Acousto-Optical Cell; Collinear Wave Heterodyning

1. Introduction
Research in star formation is a keystone topic in Astrophysics. Decades of research in this field concluded that the stars are formed by a complex collapse process of the progenitor cloud, and modern models for the early formation inherent in clusters include now detailed descriptions of the accretion at disk and chemical implications [1] . The sites of star formation are normally “obscured” by the presence of material in those areas where stars are under formation, and this fact represents the major obstacle to improving our knowledge of the topic. Basic ideas and conclusions are inferred indirectly, and they require the data obtained from the corresponding models and/or new observations in various wavelength bands. One has to explore the spectral distributions of energy very accurately and within wide spectral ranges as is concluded from the elaborated numerical simulations [2] . Now we know that the maternal material is basically constituted by warm dust and cold molecular gas (<100˚K). Due to a low extinction for long wavelengths, temperature, and composition of the medium around star forming regions, the most informative bands are infrared, microwave, and radio-wave ranges. The detailed phenomenology of star formation depends on the initial physical conditions of a region and combinations of these parameters accompanied by the cloud fragmentation, which includes magnetic, gravitational and velocity fields, and the accretion processes. These processes are not understood in detail, because we have not enough observational information on a widest set of environments. Fundamental parameters needed for a better understanding them include the mass, temperature, chemical composition, kinematics, magnetic field intensity, and density of gas and dust. These parameters are different for the regions of ongoing star formation, regions with potential of star formation, or old star formation regions. Observationally, these regions will form either low or high mass stars. Low mass stars (M < 8 Msun, in solar mass units) could form groups or be isolated, while high mass stars (M > 8 Msun) will be born only in groups. Questions related to: how, where, and when the star formation will evolve, represent basic branches of the researches. These researches could be theoretical and observational, galactic or extragalactic, and they could be related to the events occurring now or at the earliest stages of the Universe. The Initial Mass Function of stars (IMF), parameterizing the numbers of stars as a function of their mass, has an important influence on most of the observable properties of a galaxy, and detecting variations in the IMF could provide insights into the process of star formation. There are two main theories for the origin of the IMF: One is “competitive accretion” (stochastic) and the other one is “turbulent fragmentation” (deterministic, i.e the CMF is a precursor to the IMF). Since the IMF appears to be invariant, the deterministic theory concludes that the CMF must not depend much on environment. However, the CMF is poorly constrained at low masses (e.g. M < Msun) and there are some evidence for variations of the CMF in some regions, in such case the IMF may be finally determined or regulated by processes like accretion or feedback. Well studied regions of star formation in the 1kpc vicinity to the Sun are at the Gould Belt (c2d project and Hershel Gould Belt key project, [3] [4] , where a few star forming regions of high mass stars are placed. Then, in the Galactic context they have basically local characteristics and maybe a common origin [5] . The wide ranges for the above-mentioned physical parameters, which can be observed in the Milky Way now and along its evolution, produce the question about the contrast needed to detect the IMF variations expected for a CMF in the stochastic model. Generally, the galactic star formation could be analyzed using photometric or spectroscopic techniques. The observational group of the INAOE focuses its attention mainly on young massive clusters and their interaction with its progenitor molecular cloud. Three following directions in researches of the star forming regions in the Milky Way context can be marked out first of all: 1) comparing the Milky Way case with extragalactic ones, for example, with M82 and M81; 2) global studies of the Milky Way spiral arms scales (about a few kpc); and 3) studies of specific regions like the Milky Way molecular clouds or star clusters.
The extragalactic approximation is basically comparisons of physical conditions towards the nearest prototypical starburst galaxy M82 and the normal spiral galaxy M81. We discover that M82 has spiral structure and hundreds of recently formed clusters of massive young stars [6] [7] . The normal spiral galaxy M81 also has hundreds of clusters, but contrasting with M82, not all of them are young and massive [8] . Comparison of M82 and M81 with the Milky Way imply that we are missing hundreds of young clusters in the Milky Way galaxy, and it opens an opportunity to research them. New instrumentation with better angular and spectral resolution and faster capabilities improves the correct classification and comparison between star formation scenarios on different kinds of galaxies [9] ). In the case of M82 and M81, the usage of single dish antennas with large apertures has confirmed our previous results and improved our knowledge in the star forming process (Nobeyama 45 m and IRAM, [10] [11] ). The ALMA interferometer at millimeter waves has spectrometers with thousands of km/s in bandwidth, and fractions of km/s in velocity resolution at sub-arcsecond of angular resolution, equivalently at 200 GHz: a bandwidth of 2 GHz with resolution ~1 MHz. With these capabilities the future comparison between Milky Way and extragalactic objects will be more effective: regions properly defined and variety of scenarios. The Alfonso Serrano Large Millimeter Telescope (LMT) also is starting its researches and will require instrumentation with similar capabilities to improve our knowledge of the kinematics and molecular chemistry in global galactic scenarios [12] .
The Galactic approximation to the star formation topic is using several now available galactic plane surveys in near and far infrared as well as in radio-wave and microwave bands. Recently, modern results have been reported to show the kinematics of the Milky Way disk as a characteristic behavior on the spiral arms. The behavior similar to a solid body rotation in the site of spiral arms, i.e. the normal site of star formation, implies lower angular momentum transferred to smaller scales and increases the efficiency of collapse of the molecular cloud [9] [12] [13] . Our privileged view of the detailed composition of the Milky Way also implies a difficulty in exploring its spiral structure and distinguishing correct environments and distances to objects and regions inside spiral structure [14] . It could be done through investigation of position and velocity in the phase space (i.e. on the velocity-position diagram). However, it requires spectral information basically obtained from radio and microwaves with several hundreds of km/s in bandwidth and fractions of km/s in velocity resolution at arc-minute of angular resolution, equivalently at 200 GHz: a bandwidth of 500 MHz and resolution of 60 kHz [15] [16] . The ALMA interferometer will be benefited of large-scale surveys that supply the basic information to go in deep spatial detail.
Specific galactic star forming regions are also studied in detail. Specially, we mention the regions where Young Massive Stellar Clusters (YMC), i.e. the objects missing in the Milky Way plane, should be born. There are no more of ten YMCs in the Milky Way plane detected, and they contain a large fraction of massive stars that evolve fast and died in supernova events. The calculated events regulate the life of a complete galactic disk through injecting the energy, transform the kinematical and chemical status of large regions (~100 pc), and could induce new star forming episodes [17] . The relation of YMCs with their interstellar medium around them is a pendent topic of research [3] . Westerlund 1 is the prototypical Galactic YMC and, it is under study to define its atomic and molecular environment and its possible production of gamma rays [18] ). Star forming regions present physical characteristics and phenomena that are extremely actual processes of study: jets, molecular out flows, masers, extended green objects, and infrared dark clouds are nowadays part of the puzzle that give us clues to complete our understanding of the star forming process [19] -[21] . Stars in well-studied nearby low-mass star-forming regions (SFRs) follow the Kroupa initial mass function distribution (IMF). In a study of 12 highmass SFRs in their early embedded phase using the 24 μm source counts from Spitzer/MIPS, we find the distribution of the embedded sources in the associated molecular cloud follows the Kroupa IMF at the high-mass end, but shows a deficit of stars for masses lower than 2 Msun. The universality and shape of the IMF at the substellar mass range is still an investigation topic. In a study of 12 high-mass SFRs in their early embedded phase using the 24 μm source counts from Spitzer/MIPS, we have found that the distribution of the embedded sources in the associated molecular cloud follows the Kroupa IMF at the high-mass end, but shows a deficit of stars for masses lower than 2 Msun. On the other hand, there are extended 24 μm sources that are resolved into stars in the Spitzer/IRAC bands (~2"). Study of one such extended source surrounding the IRAS18236-1205 source, one of our 12 regions, would be able to spatially resolve this diffuse source into point sources, which would be analyzed to check whether they are the missing low-mass stars that are still in the process of formation. If so, these data would present serious challenge to the present ideas regarding the formation of low-mass stars [22] . All these processes require a high angular and spectral resolution from several hundreds of km\s in bandwidth and fractions of km\s in velocity resolution, equivalently at 200 GHz: a bandwidth of 500 MHz at resolution of 60 kHz, or also higher spectral resolution: a bandwidth of 50 MHz and resolution of 5 kHz at variable angular resolution from arcminutes to sub-arcseconds, now available with interferometers like ALMA [23] . The LMT with faster instrumentation and more adequate angular resolution should give us maps of the Milky Way plane at the microwave bands that will contribute to detecting the missing objects and its molecular environment with enough angular and spectral resolution.
Interdisciplinary collaboration in the astrophysics, optics, and electronics makes natural developing a new scientific instrumentation within the INAOE. Such projects like the LMT and HAWC (High Altitude Water Cherenkov observatory) require novel and sophisticated instrumentations to reach their goals. In connection with this, one can note the Aztec and Toltec, instruments for the LMT with bolometers at the wavelength 1 mm, the RSR (Redshift Search Receiver) with a spectrometer having total frequency bandwidth about 38 GHz and frequency resolutions of 30 MHz, which are equivalent to a bandwidth of thousands of km/s with a spectral resolution of decades of km/s, and the SEQUOIA spectrometer for images in the 100 GHz band with variable spectral resolution 0.1 - 10 km/s. In parallel, an advanced prototype of the acousto-optical spectrometer applicable to galactic maser emission at the frequency 43 GHz with the bandwidth about a few tens of km/s and a spectral resolution of fraction of km/s, which are equivalent to the frequency bandwidth of about 40 MHz with the frequency resolution close to 15 kHz is under construction in the INAOE [24] -[33] . Generally, acousto-optical spectrometers are used systematically, for example, in the satellite and airborne telescope instrumentation, like Herschel and SOFIA (Stratospheric Observatory for Infrared Astronomy), [34] , and in planet exploration like on Venus Express [35] . Their performances are at given quality and compactness together with a low energy.
2. General Introductive Remarks
Here, an opportunity of developing an advanced prototype of the acousto-optic spectrometer for radio-astronomy is practically touched. The proclaimed advances mean that the presented approach intends an attempt of progressing in this area based mainly on involving new physical phenomena, front-rank algorithms for signal processing, and modern acousto-optical materials. In any prototype of similar spectrometer, a high-frequency radio-wave signal is injected into a large-aperture acousto-optical cell via a piezoelectric transducer. In fact, this signal produces numerous sets of dynamic acoustic gratings (each corresponds to a partial frequency contribution of the initial high-frequency radio-wave signal), which modulate the incident widely expanded light beam of a fixed wavelength. In so doing, the incident light beam is divided into a set of the corresponding partial beams arranging the independent parallel frequency channels and being scanned at the angles depending on the partial acoustic frequencies. The intensity of each partial light beam is determined by the amplitude of the corresponding partial frequency component from the initial radio-wave signal as well. Later, these partial light beams are focused by the Fourier transforming lens system on a linear CCD-array for the further computer processing. The optical layout of similar radio-wave spectrometer includes various optical components, namely, the powerful single-frequency laser, optical attenuator, light polarization controller, optical beam expander, acousto-optical cell (AOC), integrating lens, and CCD linear array, see Figure 1.
At this stage of development, the main goals assume the progress in characterization of these components and the estimation of potential performances peculiar to this prototype as a whole. During the characterization one can identify here optical sub-systems like, in particular, the precise beam shaper containing the laser, optical attenuator, polarization controller, and a multi-prism beam expander. These parts require really accurate adjusting to provide the incident light beam with the needed linear, circular or elliptical polarization in an expanded light beam. The processing sub-system of spectrometer consists of a triplet of the basic components. The first of them is represented by the AOC with an appropriate active optical aperture. The second component is the achromatic doublet lens (for example, from Thorlabs or Edmund Optics), while the third one is the CCD linear array (for instance, LC1-USB CCD, Thorlabs, numbering 3000 pixels of 7 µm × 200 µm each). The characterization of this sub-system is oriented to realizing sufficiently optimal resolution of a pattern determined by the sampling theorem requirements. A general view of an advanced prototype of the acousto-optic radio-wave spectrometer is presented on Figure 2.
The AOC is a key component of the spectrometer under consideration, because just this component determines the efficiency of operation, frequency bandwidth of spectrum analysis, and frequency resolution, i.e. the accuracy of radio-wave signals identification. Together with this, the AOC provides an opportunity to realize a multi-channel parallel processing on ultra-high carrier frequencies being perfectly adequate to the current needs of radio-astronomy explained in Section 1. These needs are widely varied from the frequency bandwidth

Figure 1. Schematic arrangement of an advanced prototype of the acousto-optical radio-wave spectrometer.
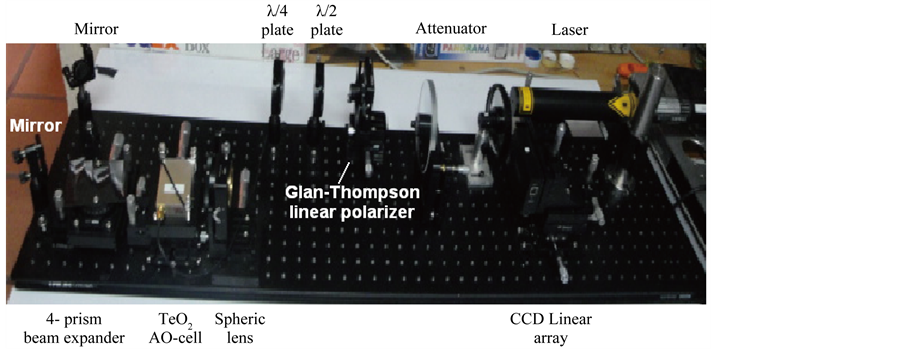
Figure 2. Photo of an advanced prototype of the acousto-optic radio-wave spectrometer.
 , the frequency resolution
 , the number of parallel signal processing (or, what is the same, the number of resolvable spots)
  and
and ,
,  ,
,  , which can be potentially realized at the top of modern technology exploiting, for example, specially designed AOCs based tellurium dioxide (TeO2) and rutile (TiO2) crystals, respectively, to more specific cases. These cases include wide variations for the needed performances as well, in particular, from
 ,
,  ,
,  to
to ,
,  ,
,  , which cannot be evidently realized within traditional AOCs and require principally novel approach to designing the AOCs considered below. This is why we touch here the possibility of improving the frequency resolution within parallel acousto-optical spectrum analysis via involving an additional nonlinear phenomenon, namely, the wave heterodyning, into the data processing. The nonlinear process of wave heterodyning is realized through co-directional collinear interaction of the longitudinal acoustic waves of finite amplitudes. This process allows us either to improve the frequency resolution of spectrum analysis at a given frequency range or to increase by a few times the current frequencies of radio-wave signals under processing. Our theoretical and experimental findings are aimed at creating a new type of AOCs, which are able to improve the resolution inherent in acousto-optical spectrum analyzer operating over ultrahigh-frequency radio-wave signals. In particular, the possibility of upgrading the frequency resolution through the acoustic wave heterodyning is experimentally demonstrated using the AOC made of rather effective lead molybdate tetragonal single crystal. The obtained results show practical efficiency of the novel approach presented. Thereafter, potentials peculiar to the acousto-optical spectrum analysis of a gigahertz-frequency range radio-wave signals with essentially improved relative value of the frequency resolution, which can exceed the order of
 ![]() in our case, are considered with exploiting a new type of the AOC.
in our case, are considered with exploiting a new type of the AOC.
3. A Multi-Prism Beam Expander
To realize a one-dimensional expanding of the laser beam one can exploit a set of rectangular prisms. Such a component is rather compact even with a large factor of expanding and can be done tunable in behavior. Using the well-known relation for light refraction [36] by the first border between air and glass  (where
  is the refractive index of a glass,
  is the top angle, and
  is the angle of light incidence), one can obtain the factor of beam expanding
 (1)
(1)
In the simplest case, when all the prisms are identical to each other and the angles  of incidence are the same for all of them, one can write
![]() . If a number of prisms is even, the beam direction can be saved with an accuracy of some spatial parallel shift, see Figure 3.
. If a number of prisms is even, the beam direction can be saved with an accuracy of some spatial parallel shift, see Figure 3.
That is why the numbers  are taken for consideration with the initial laser beam diameter of about
 . In so doing, the needed optical aperture for an AOC can be chosen, while the corresponding angles
  of incidence become to be rather large. The plots illustrating light beam expansion by triplet of sets including
  prisms with
  and
and , corresponding to the Littrow glass prisms, are presented by solid lines in Figure 4.
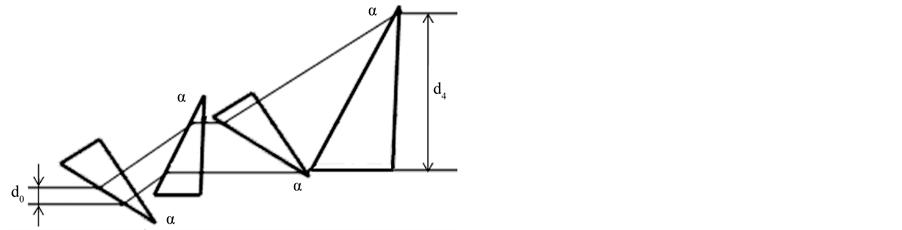
Figure 3. Passing the light beam through prisms: m = 4.

Figure 4. The combined diagram illustrating both the beam expanding and the transmission in glass prism shapers with m = {1, 2, 4}, n = 1.5, and α = 30˚.
Then, one has to estimate the transmittance T of similar beam expander. For this purpose, one can adapt the well-known relations for transmittance during the refraction [36] , which depend on the state of light polarization. Two independent on each other states can be recognized, namely the state of polarization being orthogonal to the plane of incidence and, consequently, expanding a beam and the state of polarization belonging the plane of incidence. With these two options, one can write for each border between air and prism material that
 (2)
(2)
where  and
and  are the angles of incidence and transmittance at each individual prism facet. To describe the transmittance of one prism with, naturally, two facets, one should write
 (3)
(3)
 (4)
(4)
where![]() . One can estimate that
. One can estimate that ![]() always and, consequently,
always and, consequently,
![]() where
where  and
and . Therefore, only the case related to
 ![]()
will be considered later. Restricting ourselves by the particular case of laying the light polarization in the beamexpanding plane, we arrive at the following combined diagram for both the beam expanding and the optical energy transmission, which is shown in Figure 4 and looks rather convenient practically. The plots for the optical energy transmission in Figure 4 are governed by ![]() for
for![]() . This combined diagram gives various practical possibilities. For instance, selecting the beam expansion factor of about
. This combined diagram gives various practical possibilities. For instance, selecting the beam expansion factor of about , one can find the two options: 1)
 ,
, ![]() ,
,  , and
, and  (i.e. 40%) or 2)
 ,
, ![]() ,
,  , and
, and  (i.e. 70%), as they follow from the combined diagram in Figure 4.
The top angle  of glass prisms can be also optimized. Again, we take
 ![]() and
and  for the same case of laying the light polarization in a beam expanding plane and find the contribution of the top angle
 . Analysis shows that the influence of this angle is not too much, but it can be considerable in a view of precise optimization of the prism expander performances. Taking into account the performed analysis, a quartet
 ![]() of the fused silica based BK-7 glass Littrow prisms with
of the fused silica based BK-7 glass Littrow prisms with  and
and  can be chosen for a one-dimensional expansion of a laser beam from
  to
to , providing each individual expansion at a value of
 , see Figure 2. The initial non-uniformity of lighting the input window of that AOC had been checked, and for this purpose the incident light intensity distribution had been fixed via photodetecting the beam profile obtained at the output facet of a 4-prism beam expander. The corresponding digitized oscilloscope trace for this distribution is depicted in Figure 5, so that one can estimate the non-uniformity

Figure 5. Experimental CCD-plot for the expanded beam profile, which represents the beam profile at the output facet of a 4-prism beam expander or what is the same, as the incident light distribution at the input facet of AOC.
(flatness) of its intensity by about![]() . The experimental estimation of transmittance has shown the value of 60%.
. The experimental estimation of transmittance has shown the value of 60%.
4. Characterization of the Fourier Transform Optical System
4.1. Resolvable Spot Characterization
Let us consider the Fraunhofer diffraction of the light with the wavelength  (in a medium where the effect of Fraunhofer diffraction takes place) by a rectangular aperture, whose sizes are
  and
and . When the incident optical field amplitude
 ![]() is uniformly distributed along this rectangular aperture, the pattern of Fraunhofer diffraction includes two sets of dropping maxima in two orthogonal to each other direction, so that each set of maxima can be analyzed individually [37] . This is why one can consider, for example, the light distribution in the
is uniformly distributed along this rectangular aperture, the pattern of Fraunhofer diffraction includes two sets of dropping maxima in two orthogonal to each other direction, so that each set of maxima can be analyzed individually [37] . This is why one can consider, for example, the light distribution in the ![]() -direction lying in the plane
-direction lying in the plane . The zero-level width of the main lobe, i.e. the distance between the first two zeros, is
 . The obtained estimation for
 ![]() makes it possible to touch the optical resolution in acousto-optics. If resolution is restricted only by diffraction, the Rayleigh resolution criterion is usually exploited [36] . Within this criterion, two neighboring spots can be resolved if the intensity maximum of the first spot coincides with the first zero of the other one. Under such a condition, the minimal resolvable distance is given by
makes it possible to touch the optical resolution in acousto-optics. If resolution is restricted only by diffraction, the Rayleigh resolution criterion is usually exploited [36] . Within this criterion, two neighboring spots can be resolved if the intensity maximum of the first spot coincides with the first zero of the other one. Under such a condition, the minimal resolvable distance is given by . When just non-coherent light is in operation, the two identical spots are crossing each other at an intensity level of 0.405. The accuracy of aligning aperture of the CCD-linear array relative to the lens is practically important parameter. To find it one has to estimate the depth of the lens focus
![]() , which can be approximately determined as
, which can be approximately determined as . Broadly speaking, this formula is exactly valid only for the focus depth belonging to the Gaussian beam [38] . Here, however, the focal depth W is applied to rectangular beam profile with some dropping at edges, which has been estimated as small enough. Then, taking into account the Rayleigh criterion and putting the size
 ![]() of an individual resolvable spot can be estimated by
of an individual resolvable spot can be estimated by ![]() in the diffraction limit, one can write
in the diffraction limit, one can write , where
  is replaced by the AOC’s aperture
 . In an ideal optical system, the lighted length
  in focal plane of the integrating lens can be expressed as
 , where
  and
and  are the size of an individual pixel and the number of the lighted pixels of a photo-detector, while
  is the number of resolvable spots provided by the acousto-optical cell. When an individual resolvable spot lights more that one pixel, one can introduce the number
  of pixels lighted by a one spot, which is
 . Finally, the lighted length
  can be excluded, while the number
  can be included, so that
 .
.
However, several things limit the performances of real optical system, and one of the most important factors is lens aberrations. Usually, optical systems operate within the paraxial approximation when ![]() is reasonably valid for the angle of diffraction
is reasonably valid for the angle of diffraction  close to zero. With more highly curved surfaces, paraxial theory yields increasingly large deviations from real performances, because
 ![]() at large angles of diffraction; and these deviations are known as aberrations. The aberrations are a measure of how the image differs from the paraxial prediction. Seidel [36] addressed this issue to contributions from
at large angles of diffraction; and these deviations are known as aberrations. The aberrations are a measure of how the image differs from the paraxial prediction. Seidel [36] addressed this issue to contributions from , resulting in the third-order lens aberrations. To take into account the effect of aberrations in the first approximation one can formally substitute the aperture size
  by some effective value
 , which corresponds now to the perturbed image, where the factor
  reflects the effect of aberrations. Together with this, the concrete magnitude of
  can be found from the ray tracing procedure, which gives us an opportunity to determine first of all the individual spot size
  conditioned by aberrations, so that one has to modify previous formulas with
 . Under action of aberrations, the minimal resolvable distance
![]() , the size
, the size , and the number
  of pixels lighted by a spot, and the focus depth
  take the forms:
 ,
,  , and
, and , respectively.
The second important factor limiting the system performances is connected with optical quality of the AOC perturbed by the input electrical radio-wave signal. This factor includes all potential imperfectness of material and technology, and it can be estimated only experimentally, but similar estimations will naturally include already existing contribution from lens aberrations. Hence, one has to introduce the other factor  of total perturbations, which leads to
 ,
,  ,
,  , and
, and
 .
.
4.2. Polarization Control
According to Ref. [36] , it is principally possible to control the state of light beam polarization completely using only a pair of retardation plates, namely, half and quarter wave plates. Various lasers providing a single-mode continuous-wave radiation with linear polarization ratio about 100:1 and really low level of optical noise at a visible range have been used. For practical purposes, the intensity of light beam is regulated by a pair of linear optical attenuators, which can in principle affect the state of polarization. This is why an additional crystalline Glan-Thompson polarizer has been exploited thereupon to minimize possible variations from just linear polarization state of this source down to the ratio 100,000:1. A half-wave plate can rotate the initially linear polarization state by an arbitrary angle; for example, to the horizontal polarization state, which has been chosen as optimally matched with the selected laboratory coordinates. Then, a quarter-wave plate in combination with that half-wave plate allows us changing the polarization state from linear to arbitrary elliptical state and also controlling the angle of the ellipse of polarization. Potentially, rotating both the half and quarter wave plates makes it possible to control the polarization state even with the contribution of light-beam expander due to when the light beam passes through this expander, it changes the polarization state. All the measurements had been made using the polarimeter TX5004 (Thorlabs), which performs the needed measurements using the Poincare sphere technique.
5. Experimental Data
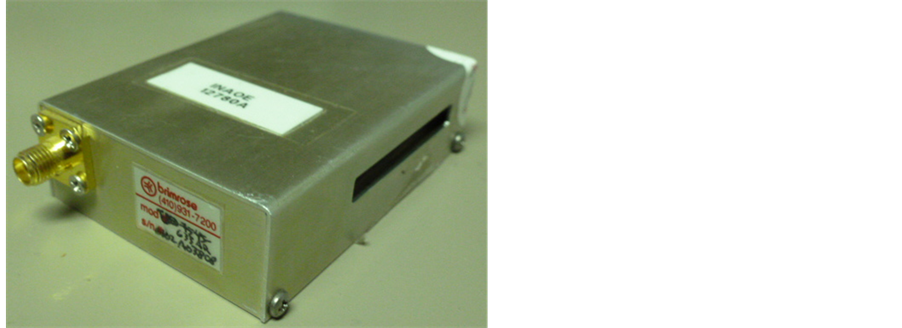
Testing the optical system of an advanced prototype had been carried out with the Bragg cell, made of tellurium dioxide (TeO2) crystal (Brimrose Corp.), which has an active optical aperture of , see Figure 6(a). Within operating at the optical wavelengths of 532 or 633 nm with linear state of the incident light polarization on the central acoustic frequency of about 75 MHz, this cell provides the deflection angle of about 3 angular degrees and allows a maximum input acoustic power of about 1.0 W. The acoustic wave velocity can be estimated by
 . The experimental studies consisted in two parts. The first one included measuring the bandwidths of acousto-optical interaction in the Bragg regime of light scattering in the first order. The second part of our experiments was related to estimating possible resolution of the AOC via measurements of the light intensity distributions of individual spots in focal plane of the integrating lens for light scattering by a TeO2-cell in the first order. Figure 6(b) shows the experimental plot for the frequency bandshape inherent in the TeO2-cell. One can observe the characteristic variations of efficiency at a top of the experimental plot. This oscillation is motivated by some uncoupling of both active and reactive parts of the cell’s impedance at different frequencies. Each maximum of efficiency is potentially corresponding to better matching of impedance at the takes radiowave frequency. Practically obtained non-uniformity of the frequency characteristic is equal to about 14%. This non-uniformity is small enough to be easily compensated electronically within array camera when postprocessing the final bias response. Total experimental frequency bandwidth at a −3 dB-level has been estimated by
 .
.
To obtain sufficiently reliable estimations for the frequency resolution providing by the TeO2–cell together with the above-described optical system (including the CCD-array with 3000 pixels of 7 µm ´ 200 µm each) a
 (a)
(a)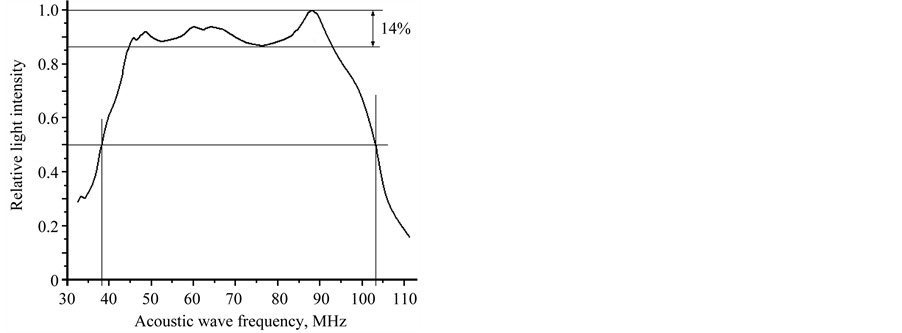 (b)
(b)
Figure 6. A 35-mm active aperture TeO2-crystal based AOC, Brimrose Corp. (a) and the experimentally obtained frequency bandshape for this AOC (b, explanation in text).
triplet of precise optical measurements had been performed at the wavelength 532 nm. The first of them has the goal of characterizing just the optical system without any contribution of an AOC. Therefore, at this step only an empty optical aperture of the needed sizes was lightedand the corresponding profile was registered. Figure 7(a) presents the obtained distribution in the focal plane of a lens. One can see that this profile corresponds to the spot size of about 16 µm with the side lobe level of about 5.15% for the first side lobe. The aim of the second measurement is: to take into account the quality of material used within manufacturing the AOC. This measurement should exploit real active optical aperture of the AOC, but without any electrical signal applied at the input port (the regime of so-called “cold cell”). Figure 7(b) demonstrates the light intensity profile gives the spot size of about 20 µm and the level of side lobes of about 6.0%. The third measurement had been realized in the regime of so-called “hot cell”, i.e. with a radio-wave signal applied at the input port of TeO2–cell. Figure 7(c) depicts the light intensity profile with the spot size of 21 µm and the side lobe level of about 6.3%.
Our experimental results had been obtained using the integrating lens # 30-976 (Edmund Optics) with  at the wavelength 532 nm, so that theoretically
 . Together with this, plots in Figure 7 exhibit
  and
and , hence
 ,
,  ,
,  , and
, and  mm. The last data show that about 38.5% of active optical aperture of the AOC is lost due to imperfectness of the lens and cell’s material. Then, instead of theoretical limit of frequency resolution
 , one yields the measured value
 .
.
Thus the obtained number of resolvable spots is . Finally, the expected lighted length in focal plane of the integrating lens can be considered as
 . This length potentially includes about 6450 pixels of 7 µm each, i.e. capabilities of the optical system under consideration exceeded possibilities of the exploited CCD-array with 3000 pixels by more than two times.
6. Frequency and Resolution Performances of the Ordinary Bragg AOC
Let us estimate generally the frequency bandwidth , the frequency resolution
![]() , and the number
, and the number  of resolvable spots inherent in the Bragg AOC operating in a one-phonon normal light scattering regime. The frequency bandwidth is given by [39] [40]
 ![]() . The Bragg limit is determined by the inequality for Klein-Cook parameter
. The Bragg limit is determined by the inequality for Klein-Cook parameter ![]() [41] . In this limit, the Heisenberg uncertainty principle leads to the frequency resolution
[41] . In this limit, the Heisenberg uncertainty principle leads to the frequency resolution![]() , where
, where  is the time aperture of AOC with the space aperture D. The number
  of resolvable spots is given by the ratio
 . In ultra-high-frequency AOCs, the value of
  is restricted by both the geometrical factors and the acoustic attenuation in cells’ material. The first
 (a) (b) (c)
Figure 7. Light intensity profiles of individual spots: (a) empty aperture without AOC, (b) AOC without the input radio-wave signal and c) AOC with the input radio-wave signal.
geometric factor is the maximal size of aperture , so that one can estimate the maximal bandwidth as
 , where
  is the central carrier frequency of the acoustic wave, and obtain the first limitation
![]() . The second geometric factor is governed by the acoustic beam divergence. Let the aperture D belongs to the near zone of acoustic field radiated by the piezoelectric transducer, whose size is L, so that
. The second geometric factor is governed by the acoustic beam divergence. Let the aperture D belongs to the near zone of acoustic field radiated by the piezoelectric transducer, whose size is L, so that![]() . This relation leads to
. This relation leads to ![]() and to the second limitation
and to the second limitation
 . The third limitation is conditioned by acoustic attenuation being a function of
 .
.
The level  dB of attenuation allows the aperture
![]() , where the factor
, where the factor ![]() of acoustic losses expressed in [dB/(cm×GHz2)]. Substituting this formula into formula for
of acoustic losses expressed in [dB/(cm×GHz2)]. Substituting this formula into formula for , one can find
![]() . Thus, the spot number
. Thus, the spot number  is restricted by a triplet of these independent limitations.
To make numerical estimations let us take a lead molybdate (PbMoO4) crystalline AOC, exhibiting:![]() ,
,  , n = 2.26, and
 ![]() [39] [42] [43] . The numerical estimations have been realized for the apertures D = 1 - 4 cm; the attenuation factors along the total aperture
[39] [42] [43] . The numerical estimations have been realized for the apertures D = 1 - 4 cm; the attenuation factors along the total aperture  and 6 dB/aperture, and the Klein-Cook parameter
 , see Figure 8. It is seen that a lead molybdate AOC with
 ,
,  , and
, and  dB/aperture is capable to provide
 ![]() with
with  within
  at a central frequency
 . Together with this, using Figure 8 one can conclude that conventional lead molybdate deflector even with
  is not operable at
 .
.
Thus, now one can formulate the question facing this section. Taking alone a given lead molybdate AOC with the given aperture , is it possible to keep the same number of resolvable spots with the same potential frequency resolution in the same frequency bandwidth at significantly increased central carrier frequency
  exceeding 600 MHz? The further consideration gives definitely positive answer to this question under condition of exploiting the collinear acoustic wave heterodyning technique.
7. Operating an Acousto-Optical Cell with the Wave Heterodyning
Let us overview potential possibilities related to exploiting a collinear wave mixing in a medium without any group-velocity dispersion while with strongly dispersive losses. This medium allows realizing effective wave heterodyning, when the beneficial data in the signal wave are converted from a relatively high-frequency carrier wave to a difference-frequency wave. The accuracy of frequency measurements is physically determined by the uncertainty in the energy or momentum inherent in a photon localized in the interaction area [44] . Due to rather strong dispersion of losses, the heterodyning leads to increasing the characteristic length and time of propagation (they both are associated with a clear optical aperture) for the converted signal in that medium and to improving significantly the accuracy of signal processing. As a result, the real-time optical analysis of frequency spectra,
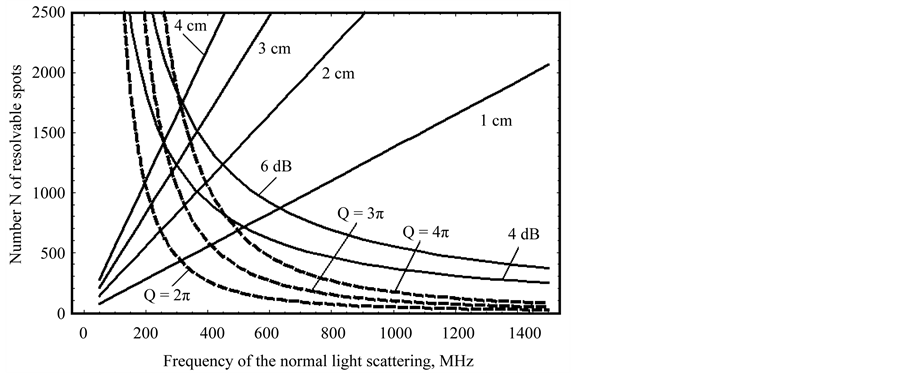
Figure 8. The combined effect of a triplet of the restricting factors. The solid straight lines are related to N1 with the apertures D = 1, 2, 3, and 4 cm. The dashed lines regards to N2 with Q = 2p, 3p, and 4p. The solid falling curves illustrate N3, i.e. the acoustic attenuation with total losses of 4 and 6 dB along the optical aperture.
belonging to analogue ultra-high frequency radio-wave signals, can be done with considerably improved frequency resolution. This result is based on a two-cascade processing, i.e. on exploiting a pair of different wave processes one after the other sequentially in the same crystalline AOC. This cell includes two resonant piezoelectric transducers, converting the input electronic signals into gigahertz-frequency elastic waves, with the corresponding electronic ports on its upper facet, clear optical aperture , and an effective acoustic absorber on its bottom facet, see Figure 9.
The first wave process represents mixing the longitudinal elastic waves of finite amplitudes in a compactly localized upper domain of a cell where relatively powerful pump of the frequency ![]() interacts with relatively weaker signal elastic wave of the frequency
interacts with relatively weaker signal elastic wave of the frequency![]() . Within this nonlinear process the collinear wave heterodyning takes place providing appearance of an elastic wave of the difference-frequency
. Within this nonlinear process the collinear wave heterodyning takes place providing appearance of an elastic wave of the difference-frequency , which is able to propagate along a large-aperture cell due to weaker manifestation of strongly dispersive losses at lower frequencies. The second wave process is the subsequent Bragg light scattering by the difference-frequency elastic wave in as possible linear regime, i.e. in the regime of a given acoustic field for the incident light beam. This process occurs within a clear aperture
  lighted by a wide incident optical beam of the wavelength
  and is able to realize optical spectrum analysis by itself. When, for example, the signal wave is rather intricate in behavior and consists of various frequencies, each individual spectral component from the difference-frequency elastic wave plays the role of a partial thick dynamic diffractive grating for the incident light beam. The length
  of interaction has to provide the Bragg regime of light scattering. In so doing, the acousto-optical spectrum analysis of a gigahertz-frequency range radio-wave signals with essentially improved frequency resolution can be realized. During our proof-of-principle experiments a new type of the acousto-optical cell made of rather effective lead molybdate single crystal was exploited. These experimental data show that the elaborated approach, based algorithmically on a two-cascade processing, allows a direct multi-channel parallel optical analysis of spectra inherent in ultra-high-frequency radio-wave signals at relative accuracy better than
![]() .
.
8. Performances of a Novel Lead Molybdate Crystalline AOC
A novel solid-state acousto-optical cell had been designed and used in the standard scheme of a prototype for the acousto-optical spectrum analyzer of ultra-high-frequency radio-signals with the laser ( , the issuing optical power exceeds 100 mW), large-aperture achromatic doublet lens, and a 3000-pixel CCD linear array. A lead molybdate (PbMoO4) single crystal
 ![]() with practically available optical aperture
with practically available optical aperture , oriented along the [001]-axis for an acoustic beam along [100]-axis for an optical beam [42] [43] , was used in that cell. The cell completed with a pair of electronic input ports for the pump and signal on one of its facets as well as with acoustic absorber on the opposite facet. This crystalline material was chosen because of its high value of the relative figure of acousto-optical merit that can be characterized by a value of
![]() for both possible eigen-states of light polarization in this tetragonal crystal and its rather high acoustic interaction efficiency for collinear longitudinal waves in the [001]-direction described by
for both possible eigen-states of light polarization in this tetragonal crystal and its rather high acoustic interaction efficiency for collinear longitudinal waves in the [001]-direction described by ![]()

Figure 9. Schematic arrangement of the interacting beams in a two-cascade AOC [45] .
[42] [43] . The piezoelectric transducer with length of , generating the signal wave with power density of ~ 100 mW/mm2, was made of a thin
 ![]() -cut lithium niobate, so that it excited purely longitudinal acoustic wave, with conversion losses of about 2 dB at its resonant frequency close to 1530 MHz. The singlefrequency pumping longitudinal acoustic wave with the power density of up to 600 mW/mm2 was generated at a carrier frequency of approximately
-cut lithium niobate, so that it excited purely longitudinal acoustic wave, with conversion losses of about 2 dB at its resonant frequency close to 1530 MHz. The singlefrequency pumping longitudinal acoustic wave with the power density of up to 600 mW/mm2 was generated at a carrier frequency of approximately , so that the case of
 ![]() had been experimentally realized. During the experiments, we have placed a diaphragm in about 5-mm vicinity of the piezoelectric transducers area (about 13.5% of the total aperture) to minimize the effect of this area, where an increase in the power of difference frequency waves takes place. Consequently, the working optical aperture of a cell was a little bit longer than 3.7 cm. The bandwidth of that prototype was about 180 MHz. The efficiency of light scattering by an additional acoustic wave at the difference-frequency was slightly exceeding 1%. Figure 10 shows the digitized oscilloscope traces of amplitude-frequency distribution peculiar to that prototype with the acoustooptical cell based on the collinear wave heterodyning. The digitized trace of this distribution had been recorded by a multi-pixel CCD linear array photo-camera through connecting the input signal port of a cell at an ultrahigh-frequency radio-wave sweep-generator and fulfilling the acoustic wave heterodyning in a lead molybdate crystal. For a radio-wave signal, producing the dynamic acoustic grating on the resulting carrier difference-frequency of about 235 MHz, the attenuation is close to 3 dB over the total cell aperture. At the same time, for the signal acoustic waves at even the lower original frequency
had been experimentally realized. During the experiments, we have placed a diaphragm in about 5-mm vicinity of the piezoelectric transducers area (about 13.5% of the total aperture) to minimize the effect of this area, where an increase in the power of difference frequency waves takes place. Consequently, the working optical aperture of a cell was a little bit longer than 3.7 cm. The bandwidth of that prototype was about 180 MHz. The efficiency of light scattering by an additional acoustic wave at the difference-frequency was slightly exceeding 1%. Figure 10 shows the digitized oscilloscope traces of amplitude-frequency distribution peculiar to that prototype with the acoustooptical cell based on the collinear wave heterodyning. The digitized trace of this distribution had been recorded by a multi-pixel CCD linear array photo-camera through connecting the input signal port of a cell at an ultrahigh-frequency radio-wave sweep-generator and fulfilling the acoustic wave heterodyning in a lead molybdate crystal. For a radio-wave signal, producing the dynamic acoustic grating on the resulting carrier difference-frequency of about 235 MHz, the attenuation is close to 3 dB over the total cell aperture. At the same time, for the signal acoustic waves at even the lower original frequency  the attenuation exceeds 100 dB along a 3.7 cm aperture, which is perfectly unacceptable in practice. Within the second set of our experimental tests, we examined the resolution of spectrum analyzer with the cell exploiting the collinear acousticwave heterodyning. In fact, the intensity distribution of an individual resolvable spot in the focal plane of the integrating lens had been considered. In so doing, the technique, which had long been in use, with very narrow slit diaphragm scanning over sufficiently sensitive photodetector and subsequent logarithmic amplifier was applied to our needs. Practically, this technique gives an opportunity to fix the continuous distribution of light intensity in the lobes of an individual spot really carefully in a rather wide dynamic range of about 25 dB [45] [46] . One can see that the measured level of the first lobes lies at a level of about ‒13 dB with initially homogeneous lighting of the operating cell’s aperture, which is in good coincidence with the well-known theoretical prediction [45] [46] . Figure 11 presents the digitized trace, which had been recorded in the focal plane of the integrating lens via applying exactly a single-frequency excitation at the input signal port of the proposed cell. In the case under consideration, physical limit of the frequency resolution is
 , while experimentally obtained value, affected by acoustic losses as well as by technical imperfectness of the integrating lens, corresponds to a frequency resolution of about
  at a level of ‒10 dB and gives the number of resolvable spots or, what is the same, the number of parallel frequency channels
 . By this is meant that the proposed technique for direct parallel optical spectrum analysis of gigahertz-frequency range radio-wave signals provides at least 1500-channel processing even within our proof-of-principle experiment. As this takes place, the accuracy or the relative frequency resolution
  (where
 ) is better than
![]() , which is practically unattainable for conventional direct acousto-optical methods of spectrum analysis.
, which is practically unattainable for conventional direct acousto-optical methods of spectrum analysis.
9. Brief Discussion and Conclusive Remarks
The presented information makes it possible to have a look at the potential progress within designing modern

Figure 10. The digitized oscilloscope trace of the bandshape of the PbMoO4 crystaline AOC with collinear heterodyning exploiting the longitudinal elastic waves of finite amplitude in a crystal [46] .
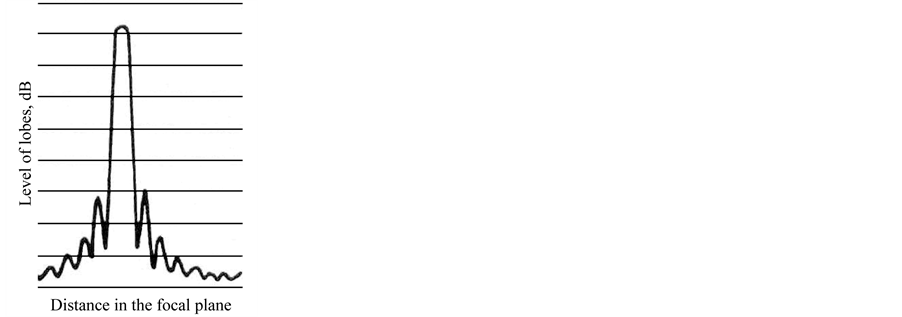
Figure 11. The digitized profile of an individual resolvable spot peculiar to a PbMoO4-cell with the most uniform distribution  of difference-frequency wave distributed along 3.7 cm aperture; horizontal lines are spaced by 2.5 dB [46] .
prototype of the acousto-optical spectrometer for precise analysis of various radio-wave signals in radio-astronomy. The chosen arrangement of a prototype realizes the direct analysis of radio-wave signal in frequency plane of the Fourier transform system. Moreover, such an approach allows in the future significant schematic development based on exploiting new physical principles as well as involving novel acousto-optical materials being capable to improve the performance data of spectrometer. The obtained practical results confirm the validity of the chosen technical solutions as a whole. Nevertheless, it is clearly seen that, for instance, quality of some mechanical and optical components, in particular the lens exploited with the peculiar mechanical mount, should be substantially increased to provide a great help in improving performances of the prototype developed. Then, it should be noted that experimental technique of measurements and characterization has to be also progressed.
Together with this, we demonstrate both the possibility and the potential advantages of applying a co-directional collinear wave heterodyning to essential, about an order of magnitude, improvement of the frequency resolution within a multi-channel parallel acousto-optical spectrum analysis of gigahertz-frequency range analogue radio-wave signals. In so doing, an opportunity of implementing acousto-optical data processing with the wave heterodyning has been experimentally performed utilizing the specially designed acousto-optical cell made of a lead molybdate single crystal. The proposed technique exploits a two-cascade algorithm of processing and is intended for direct parallel and precise optical spectrum analysis and provides about 1500-frequency-channels for processing analogue radio-wave signals in a gigahertz-frequency range with the accuracy or, what is the same, with the relative frequency resolution better than , which is usually unattainable for conventional direct acousto-optical methods. The obtained results reflect fruitful character of modern approaches based on applying various non-linear phenomena to improve the performance data of optical processing and give an appropriate example of this kind. At the moment, a few practical advantages of the presented approach can be noted. First, the proposed device does not need additional electronic equipment for mixing the signals and selecting the resulting currier frequency, because heterodyning can be performed directly in a cell and provide potentially the dynamic range of about 90 dB peculiar to wave processes in solids. Then, the approach under consideration decreases the required relative bandwidth of piezoelectric transducer from
  at the resulting frequency within a conventional cell to
  at the initial carrier frequency. Within our proof-of-principle experiment the acousto-optical cell with 2 piezoelectric transducers was used, but generally it is not necessary. Due to the relative bandwidth does not exceed
![]() , potentially it is quite reasonable to exploit just only one transducer. Third, in the case of a spatially multi-channel arrangement of the acousto-optical cell, the identity of neighboring spatial channels to each other can be provided by adjusting the corresponding heterodynes. Finally, one should note that the number of isotropic or crystalline materials, which are appropriate for acousto-optical cells processing signals in a gigahertz-frequency range, is definitely restricted due to fast-growing influence of a square-law frequency dependence for the acoustic attenuation in solids. For instance, one can easily show [45] [46] that the above-discussed lead molybdate crystal cannot be used for creating a conventional acousto-optical cell operating with signals whose carrier frequency exceeds about 300 - 400 MHz. Nevertheless, just this crystalline material had been exploited for the control over 1.5 GHz signals within these studies. Consequently, one can conclude that a two-cascade arrangement of a cell presented here allows extending the spectrum of acousto-optical materials being appropriate for direct processing of ultra-high-frequency analogue radiowave signals. Remarkable qualities of the acousto-optical spectrometers are stability, compactness and low energy consumption, such qualities now could be potentiated for using the collinear wave heterodyning discussed in this document, because this new characteristic gives us the opportunity to explore the dynamic selection of frequency bandwidth and resolution using the acousto-optical spectroscopy technique.
, potentially it is quite reasonable to exploit just only one transducer. Third, in the case of a spatially multi-channel arrangement of the acousto-optical cell, the identity of neighboring spatial channels to each other can be provided by adjusting the corresponding heterodynes. Finally, one should note that the number of isotropic or crystalline materials, which are appropriate for acousto-optical cells processing signals in a gigahertz-frequency range, is definitely restricted due to fast-growing influence of a square-law frequency dependence for the acoustic attenuation in solids. For instance, one can easily show [45] [46] that the above-discussed lead molybdate crystal cannot be used for creating a conventional acousto-optical cell operating with signals whose carrier frequency exceeds about 300 - 400 MHz. Nevertheless, just this crystalline material had been exploited for the control over 1.5 GHz signals within these studies. Consequently, one can conclude that a two-cascade arrangement of a cell presented here allows extending the spectrum of acousto-optical materials being appropriate for direct processing of ultra-high-frequency analogue radiowave signals. Remarkable qualities of the acousto-optical spectrometers are stability, compactness and low energy consumption, such qualities now could be potentiated for using the collinear wave heterodyning discussed in this document, because this new characteristic gives us the opportunity to explore the dynamic selection of frequency bandwidth and resolution using the acousto-optical spectroscopy technique.
Acknowledgements
This work has been financially supported by the CONACyT, Mexico within the projects # 61237 (initially) and 182841.
References
- Bastian, N., Cabrera-Ziri, I., Davies, B. and Larsen, S.S. (2013) Constraining Globular Cluster Formation Through Studies of Young Massive Clusters—I. A Lack of Ongoing Star Formation within Young Clusters. Monthly Notices of the Royal Astronomical Society, Advance Access, 12. http://dx.doi.10.1093/mnras/stt1779
- Offner, S., Robitaille, T.P., Hansen, C., McKee, C.F. and Klein, R.I. (2012) Oberving Simulated Protostars with Outflows: How Accurate Are Protostellar Properties Inferred from SEDs?” Astrophysical Journal, 753, 98-115. http://dx.doi.10.1088/0004-637X/753/2/98
- II Evans, N.J., Dunham, M.M., Jørgensen, J.K., Enoch, M.L., Merín, B., van Dishoeck, E.F., Alcalá, J.M., Myers, P.C., Stapelfeldt, K.R., Huard, T.L., Allen, L.E., Harvey, P.M., van Kempen, T., Blake, G.A., Koerner, D.W., Mundy, L.G., Padgett, D.L. and Sargent, A.I. (2009) The Spitzer c2d Legacy Results: Star-Formation Rates and Efficiencies; Evolution and Lifetimes. Astrophysical Journal Supplements, 181, 321-350. http://dx.doi.10.1088/0067-0049/181/2/321
- Ph. André, et al. (2010) From Filamentary Clouds to Prestellar Cores to the Stellar IMF: Initial Highlights from the Herschel Gould Belt Survey. Astronomy & Astrophysics, 518, L102-L109. http://dx.doi.10.1051/0004-6361/201014666
- Grenier, I.A. (2004) The Gould Belt, Star Formation, and the Local Interstellar Medium. arXiv:astro-ph/0409096.
- Mayya, Y.D., Carrasco, L. and Luna, A. (2005) The Discovery of Spiral Arms in the Starburst Galaxy M82. Astrophysical Journal, 628, L33-L36. http://dx.doi.10.1086/432644
- Mayya, Y.D., Romano, R., Rodríguez Merino, L., Luna, A., Carrasco, L. and Rosa González, D. (2008) HST ACS Imaging of M82: A Comparison of Mass and Size Distribution Functions of the Younger Nuclear and Older Disk Clusters. Astrophysical Journal, 679, 404-419. http://dx.doi.10.1086/587541
- Mayya, Y.D., Rosa González, D., Santiago-Cortés., M., Arellano-Córdova, K. and Rodríguez, M. (2013) GTC Long-Slit Spectroscopy of Compact Stellar Clusters in M81. Revista Mexicana de Astronomía y Astrofísica Conference Series, 42, 22-23.
- Kennicutt, R.C. and Evans, N.J. (2012) Star Formation in the Milky Way and Nearby Galaxies. Annual Review of Astronomy & Astrophysics, 50, 531-608. http://dx.doi.10.1146/annurev-astro-081811-125610
- Salak, D., Nakai, N., Miyamoto, Y., Yamauchi, A. and Tsuru, T.G. (2013) Large-Field CO(J = 1 → 0) Observations of the Starburst Galaxy M 82. Publications of the Astronomical Society of Japan, 65, 66-81.
- Heithausen, A. (2012) On the Nature of Dust Clouds in the Region towards M81 and NGC 3077. Astronomy & Astrophysics, 543, 21-27. http://dx.doi.10.1051/0004-6361/201117861
- Elmegreen, B.G. (2011) Star Formation on Galactic Scales: Empirical Laws. European Astronomical Society Publications Series, 51, 3-17. http://dx.doi.10.1051/eas/1151001
- Luna, A., Bronfman, L., Carrasco, L. and May, J. (2006) Molecular Gas, Kinematics, and OB Star Formation in the Spiral Arms of the Southern Milky Way. Astrophysical Journal, 641, 938-948. http://dx.doi.10.1086/500163
- Efremov, Yu.N. (2011) On the Spiral Structure of the Milky Way Galaxy. Astronomy Reports, 55, 108-122. http://dx.doi.10.1134/S1063772911020016
- Bronfman, L., May, J. and Luna, A. (2000) A CO Survey of the Southern Galaxy. In: Mangum, J.G. and Radford, S.J.E., Eds., Imaging at Radio through Submillimeter Wavelengths, Astronomical Society of the Pacific Conference Series, 217, 66-71.
- Sawada, T., Hasegawa, T., Handa, T., Morino, J.-I., Oka, T., Booth, R., Bronfman, L., Hayashi, M., Luna Castellanos, A., Nyman, L.-A., Sakamoto, S., Seta, M., Shaver, P., Sorai, K. and Usuda, K.S. (2001) The Tokyo-Onsala-ESO-Calan Galactic CO J = 2-1 Survey. I. The Galactic Center Region. Astrophysical Journal Supplements, 136, 189-219. http://dx.doi.10.1086/321793
- Mayya, Y.D., Luna, A., Carrasco, L. and Bronfman, L. (2012) The Interplay Between the Young Stellar Super Cluster Westerlund 1, and the Surrounding Interstellar Medium. European Physical Journal Web of Conferences, 19, 8006- 8009. http://dx.doi.10.1051/epjconf/20121908006
- Luna, A., Mayya, Y.D., Carrasco, L. and Bronfman, L. (2010) The Discovery of a Molecular Cavity in the Norma Near Arm Associated with H.E.S.S gamma-ray Source Located in the Direction of Westerlund 1. Astrophysical Journal, 713, L45-L49. http://dx.doi.10.1088/2041-8205/713/1/L45
- Zinnecker, H. and Yorke, H.W. (2007) Toward Understanding Massive Star Formation. Annual Review of Astronomy and Astrophysics, 45, 481-563. http://dx.doi.10.1146/annurev.astro.44.051905.092549
- Retes, R., Luna, A., Mayya, D. and Carrasco, L. (2009) Embedded Young Stellar Population in the Molecular Region Towards IRAS 18236-1205 Source. Revista Mexicana de Astronomía y Astrofísica, Conference Series, 37, 165-169. http://adsabs.harvard.edu/abs/2009RMxAC..37..165R
- Retes, R., Luna, A., Mayya Y.D. and Carrasco, L. (2011) Characterizing the Embedded Young Stellar Objects in the Galactic Star-forming Region IRAS 18236-1205. Revista Mexicana de Astronomía y Astrofísica, Conference Series, 40, 249-250. http://adsabs.harvard.edu/abs/2011RMxAC..40..249R
- André, Ph., Könyves, V., Arzoumanian, D., Palmeirim, P. and Peretto, N. (2013) Star Formation as Revealed by Herschel. Astronomical Society of the Pacific Conferences, 476, 95.
- Bronfman, L. and Merello, M. (2013) From Large Scale Surveys of the Galaxy to High Resolution Observations with ALMA. Astronomical Society of the Pacific Conferences, 476, 231.
- Shcherbakov, A.S., Balderas Mata, S.E., Tepichin Rodriguez, E., Luna Castellanos, A., Sanchez Lucero, D. and Maximov, Je. (2007) The Main Peculiarities of Arranging the Optical Scheme of Acousto-Optical Spectrometer for the Mexican Large Millimeter Telescope. Proceedings of SPIE, 6663, 1-9.
- Shcherbakov, A.S., Luna Castellanos, A., Balderas Mata, S. E. and Maximov, Je. (2007) Upgrading the Frequency Resolution of Spectrum Analyzers for Radio-Astronomy due to Exploiting a Multi-Phonon Light Scattering in TeO2 Crystalline Modulators. Proceedings of SPIE, 6796, 1-10.
- Shcherbakov, A.S., Luna Castellanos, A. and Balderas Mata, S.E. (2007) Optical Modulators Exploting a Multi-Phonon Light Scattering in TeO2 Structures. Proceedings of SPIE, 6796, 1-12.
- Shcherbakov, A.S., Tepichin Rodriguez, E., Aguirre Lopez, A. and Maximov, Je. (2009) Frequency Bandwidth and Potential Resolution of Optical Modulators Exploiting a Multi-Phonon Light Scattering in Crystals. Optik—International Journal for Light and Electron Optics, 120, 301-312. http://doi:10.1016/j.ijleo.2007.06.027
- Herrera Martinez, G., Luna Castellanos, A., Carrasco Bazúa, L., Shcherbakov, A.S., Sanchez Lucero, D. and Mendoza Torres, E. (2009) A Design of an Acousto-Optical Spectrometer. Mexican Review of Astromomy & Astrophysics, Conference Series, 37, 156-159.
- Shcherbakov, A.S., Luna Castellanos, A. and Sanchez Lucero, D. (2009) Characterization of the Beam Shaper and Fourier Transform System in a Prototype of the Acousto-Optical Spectrometer for Mexican Large Millimeter Telescope. Proceedings of SPIE, 7386, 1-12.
- Shcherbakov, A.S., Sanchez Lucero, D., Luna Castellanos, A. and Maximov, Je. (2010) Some Peculiarities of Designing the Optical Scheme of Tellurium Dioxide Crystalline Cell Based Acousto-Optical Spectrometer for the Mexican Large Millimeter Telescope. Proceedings of SPIE, 7598, 1-10.
- Herrera Martínez, G., Luna Castellanos, A., Carrasco Bazúa, L. and Shcherbakov, A.S. (2011) Testing the Bragg Cell of an Acousto-Optical Spectrometer for Radio Astronomy. Mexican Review of Astromomy & Astrophysics, Conference Series, 40, 305.
- Shcherbakov, A.S., Sanchez Lucero, D. and Luna Castellanos, A. (2011) Global Characterization of an Advanced Prototype of a Multi-Channel Acousto-Optical Spectrometer for the Mexican Large Millimeter Telescope. Proceedings of SPIE, 7934, 1-12.
- Shcherbakov, A.S., Sanchez Lucero, D., Luna Castellanos, A. and Maximov, Je. (2011) Characterizing the Polarization Features of a Multi-Prism Fused-Silica Beam Expander for a Wide-Aperture Acousto-optic Applications. Proceedings of SPIE, 7934, 1-11.
- Korablev, O., Fedorova, A., Bertaux, J.-L., Stepanov, A.V., Kiselev, A., Kalinnikov, Yu.K. A., Titov, Yu., Montmessin, F., Dubois, J.P., Villard, E., Sarago, V., Belyaev, D., Reberac, A. and Neefs, E. (2012) SPICAV IR Acousto-Optic Spectrometer Experiment on Venus Express. Planetary and Space Science, 65, 38-57. http://dx.doi.10.1016/j.pss.2012.01.002
- Helmich, F.P. (2011) Herschel HIFI—The Heterodyne Instrument for the Far-Infrared. European Astronomical Society Publications Series, 52, 15-20. Http://dx.doi.10.1051/eas/1152003
- Born, M. and Wolf, E. (1999) Principles of Optics. 7th Edition, Cambridge University, Cambridge.
- Goodman, J.W. (2005) Introduction to Fourier Optics. 3rd Edition, Roberts & Co., Greenwood Village.
- Iizuka, K. (2002) Elements of Photonics. Vol. 1, John Wiley & Sons, New York.
- Balakshy, V.I., Parygin, V.N. and Chirkov, L.E. (1985) Physical Principles of Acousto-Optics. Radio i Szyaz, Moscow.
- Das, P.D. and DeCusatis, C.M. (1991) Acousto-Optic Signal Processing: Fundamentals & Applications. Artech House, Boston.
- Klein, R.W. and Cook, B.D. (1967) A Unified Approach to Ultrasonic Light Diffraction. IEEE Transactions on Sonics & Ultrasonics, 14, 123-134. http://dx.doi.org/10.1109/T-SU.1967.29423
- Dmitriev, V.G., Gurzadyan, G.G. and Nikogosyan, D.N. (1999) Handbook of Nonlinear Optical Crystals. 3rd Edition, Springer, Berlin. http://dx.doi.org/10.1007/978-3-540-46793-9
- Blistanov, A.A. (2007) Crystals for Quantum and Nonlinear Optics. MISIS, Moscow.
- Dirac, P.A.M. (1999) The Principles of Quantum Mechanics. 4th Edition, Oxford University Press, Oxford.
- Shcherbakov, A.S., Bliznetsov, A.M., Castellanos, A.L. and Sánchez Lucero, D. (2010) Acousto-Optical Spectrum Analysis of Ultra-High Frequency Radio-Wave Analogue Signals With an Improved Resolution Exploiting the Collinear Acoustic Wave Heterodyning. Optik—International Journal for Light and Electron Optics, 121, 1497-1506. http://doi:1016/j.ijleo.2009.02.015
- Shcherbakov, A.S., Sánchez Lucero, D., Luna Castellanos, A. and Belokurova, O.I. (2010) Direct Multi-Channel Optical Spectrum Analysis of Radio-Wave Signals Using Collinear Wave Heterodyning in Single Acousto-Optical Cell. Journal of Optics, 12, 045203. http://doi:10.1088/20408978/12/4/045203