Journal of Diabetes Mellitus
Vol.2 No.2(2012), Article ID:19360,7 pages DOI:10.4236/jdm.2012.22036
The development and validation of a risk score for predicting microalbuminuria in type 2 diabetic patients*
![]()
1Department of Community Medicine, Faculty of Medicine, Chiang Mai University, Chiang Mai, Thailand; #Corresponding Author: jayantorn.s@gmail.com
2Department of Medicine, Bangkok Metropolitan Medical College and Vajira Hospital, Bangkok, Thailand
3Department of Clinical Epidemiology, Faculty of Medicine, Siriraj Hospital, Bangkok, Thailand
Received 10 February 2012; revised 18 March 2012; accepted 26 April 2012
Keywords: microalbuminuria; risk score; type 2 diabetes; risk factor; scoring scheme
ABSTRACT
Objective: To develop and validate a prognostic scoring scheme for the prediction of microalbuminuria in type 2 diabetic patients of Thai descent. Methods: The clinical information from type 2 diabetic patients who were treated at community hospitals was used to develop a prediction model (derivation set). The model evaluated at a tertiary hospital (validation set). A stepwise logistic regression model was used to identify the independent risk variables from the derivation set and a simple point scoring system was derived from the beta-coefficients. The risk scoring scheme was validated by the validation set. Results: The risk scoring scheme is based on six risk predictors: the duration of diabetes, age at the onset of diabetes, systolic blood pressure, low density lipoprotein levels, creatinine levels, and alcohol consumption. The total score ranged from 0 to 11.5. The likelihood of microalbuminuria in patients with low risk (scores ≤ 2) was 0.28, with moderate risk (scores 2.5 to 5.5) was 0.86, and high risk (scores ≥ 6) was 7.36. The area under the ROC curve of the derivation set and validation set were 0.768 (95% CI 0.73 - 0.81) and 0.758 (95% CI 0.70 - 0.80), respectively. Conclusion: Our scoring system is a simple and reasonably accurate method for predicting the future presence of microalbuminuria in type 2 diabetic patients.
1. INTRODUCTION
Microalbuminuria is an early predictor of the renal, cardiovascular and retinopathy complications of diabetes [1-5]. The American Diabetes Association (ADA) recommends that a standard screening test for microalbuminuria should be used at diagnosis and at least yearly thereafter in type 2 diabetes [6]. Previous studies reported that there were only 2.1% of diabetes patients in the Mid-Atlantic region population of privately insured individuals received a microalbuminuria test [7]. In Thailand, around 41.0% of type 2 diabetes patients in tertiary care units were not screened for microalbuminuria [8].
There are two methods now readily available for microalbuminuria diagnosis. Firstly, urinary concentrations of very small amounts of albumin can be determined quantitatively, this method usually involves radioimmunoassay which has high sensitivity and specificity but quite expensive and the most of the primary care units in Thailand have a least performance for this method in screening tests for microalbuminuria. Secondly, qualitative methods can be used to screen for microalbuminuria; these are more readily available for use in the clinic, less complicated and cheaper than quantitative assessments but they are also less accurate and less specific [9]. Both methods required three urine specimens collection within twelve months period and obtained on different days. If two out of three are positive then the patient still has microalbuminuria and only one or none out of the three are positive then the microalbuminuria has regressed [6]. These are not convenient for patients and they may be unable or unwilling to have the test performed.
We found no study that has been conducted to assess the predictive value of a combination of the risk factors for microalbuminuria. The risk of developing microalbuminuria in type 2 diabetes depends on several determinants. Risk determinants include age, gender, body mass index (BMI), duration of diabetes, age at diagnosis, glycemic control, blood pressure control, dislipidemia and smoking [10-12]. If several of these factors could be used to develop a predictor score with a reasonable ability to predict microalbuminuria, all type 2 diabetes patients could be screened for early detection and early treatment. The aims of this study were to develop and validate a risk scoring scheme for the prediction microalbuminuria in type 2 diabetes patients.
2. METHODS
We conducted a case-control study analogue design in 4 diabetes clinics in Thailand, including 3 units in community hospitals, and 1 unit in tertiary hospital. Data from type 2 diabetes patients who had undergone treatment at community hospitals were used to develop a prediction model; the subjects represented “the derivation set”. Data from type 2 diabetes patients who had undergone treatment at tertiary hospital were used to evaluate the performance of the model obtained from the derivation set of subjects; they represented “the validation set”. The study was approved by the Ethical Review Committee for Research in Human subjects of the Thai Ministry of Public Health and the Bangkok Metropolitan Medical College and Vajira Hospital.
2.1. Study Population
Eligible subjects of the derivation set were type 2 diabetic patients aged ≥18 years and without a history of nephropathy and/or renal failure who attended the outpatient at diabetes clinic of each hospital between January and December 2009. 225 type 2 diabetic subjects with microalbuminuria were cases group and 225 type 2 diabetic subjects with normoalbuminuria were controls group diagnosed by radioimmunoassay or Micral test. The sample size was calculated based on ability of the study to determine risk factors of microalbuminuria type 2 diabetes [13]. The authors expected 80% power to detect microalbuminuria with 95% confident interval based on logistic regression result of fitting a logistic regression model [14].
The validation set were type 2 diabetic patients aged ≥ 18 years and without a history of nephropathy and/or renal failure who attended the outpatient at diabetes clinic of tertiary hospital between January and December 2008. The subjects who had not laboratory information in the medical record or the database of diabetes clinic were excluded from the study. 116 diabetic subjects with microalbuminuria were cases group and 116 diabetic subjects with normoalbuminuria were controls group.
2.2. Data Collection
Medical history information of the derivation set was retrieved from the databases and medical records of the diabetes clinics and baseline characteristics were collected by interview. The patients were thoroughly informed and signed a consent form.
For the validation set, both baseline characteristics and medical history information were retrieved from the databases and medical records.
Clinical characteristic were composed of age, gender, occupational, education, duration of diabetes, diabetes complications, treatment privilege, family history of diabetes, systolic and diastolic blood pressure, body weight, body height, history of hypertension, alcohol drinking and smoking. Laboratory data were composed of microalbuminuria, lipid profile, creatinine, fasting blood sugar (FBS), and HbA1c levels. Clinical laboratory investigations were done in each hospital.
2.3. Definition
Type 2 diabetes mellitus is defined as previously diagnosed diabetes. The presence of microalbuminuria was proteinuria range from 30 - 299 µg/mg diagnosed from radioimmunoassay in at least two of three urine specimens collected or a positive test results two of three urine specimens collected by Micral test. The diagnoses of cardiovascular diseases, dislipidemia, and hypertension were based on clinical diagnosis documented in medical records.
2.4. Statistical Analysis
Univariate analysis was used to identify the association between independent factors and microalbuminuria. Stepwise logistic regressions were used to define associated factors with microalbuminuria in type 2 diabetes after adjusting for covariate factors. Regression coefficients were transformed into item scores and added up to a total score [15]. The factor of microalbuminuria was analyzed using total scores as the only predictor.
The scoring scheme accuracy was present with an area under the receiver operating characteristic (ROC) curve. The risk scoring scheme was validated with the validation set. Another independent set of microalbuminuria cases referred from the tertiary hospital were also evaluated for risk scores. The level of significance was set at p-Value 0.05.
3. RESULTS
3.1. Generation of Risk Prediction Score
From the derivation set, comparing between microalbuminuria and normoalbuminuria group, microalbuminuria group shown had a higher proportion of male sex (34.2% vs. 24.9%, p-Value 0.030), longer duration of diabetes (8.32 ± 6.25 vs. 6.11 ± 5.37 years, p-Value 0.001), younger age at diagnosis (49.95 ± 11.37 vs. 53.01 ± 10.38 years, p-Value 0.003), lower LDL-C (3.23 ± 1.02 vs. 4.08 ± 0.83 mmol/L, p-Value < 0.001), higher tobacco smoking (18.7% vs. 9.8%, p-Value 0.007), higher alcohol drinking (18.7% vs. 8.9%, p-Value 0.003), higher use of insulin (9.8% vs. 2.2%, p-Value 0.001) and higher use of antihyperlipidemia drugs (70.7% vs. 59.6%, p-Value 0.013). Age, HbA1c, FBS, high-density lipoproteins (HDL-C), triglyceride, history of ischemic heart disease (IHD), history of dislipidemia and history of hypertension were not significantly different (Table 1).
The independent variables with probability values lower than 0.10 were chosen for enter into the multivariable regression model, although drug treatment were not chosen include the model. The continuous variables were displayed by a graph that carries out a locally weighted regression of microalbuminuria on each independent variable. We then categorized cutoff levels of each continuous variable and considered the statistical significance of the trend of odds.
The stepwise logistic regression analysis was used for identifying independent risk factors for microalbuminuria. Probability values lower than 0.05 were decided. Six risk predictors were selected due to microalbuminuria. These risk predictors were duration of diabetes, age at onset of diabetes, systolic blood pressure, creatinine,
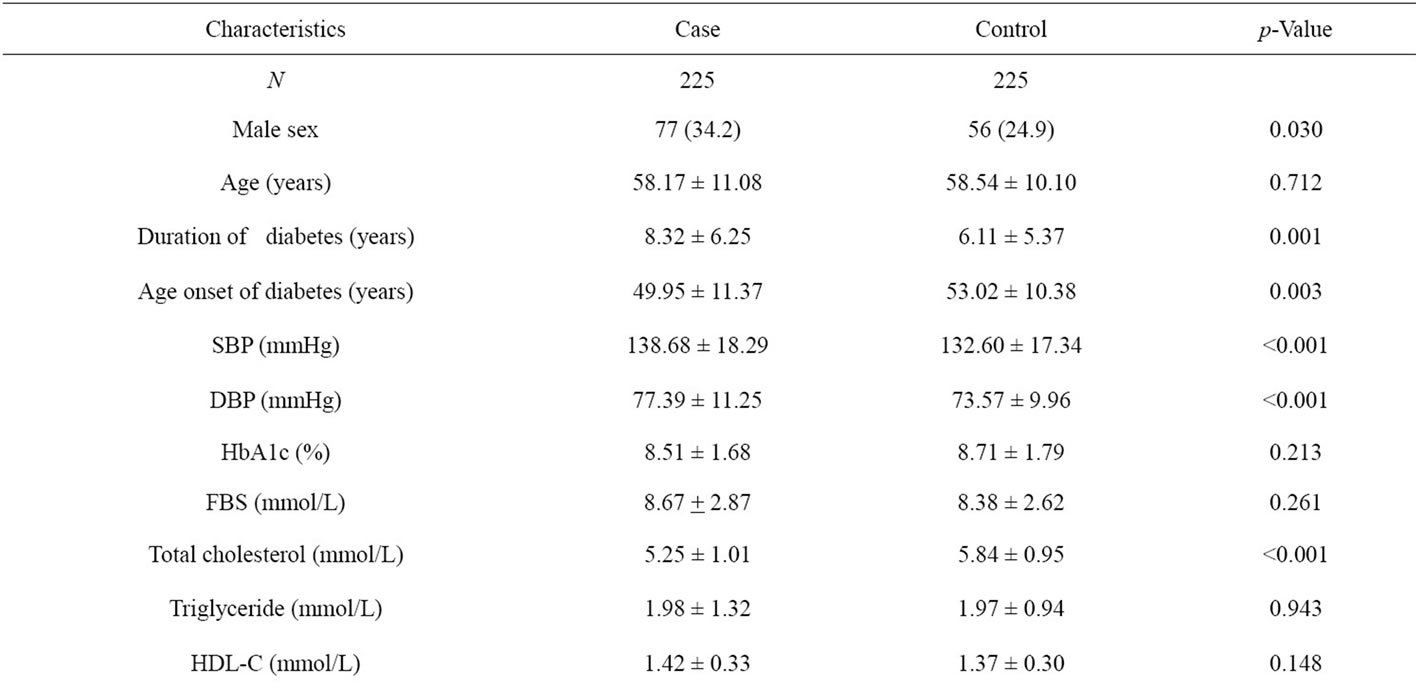
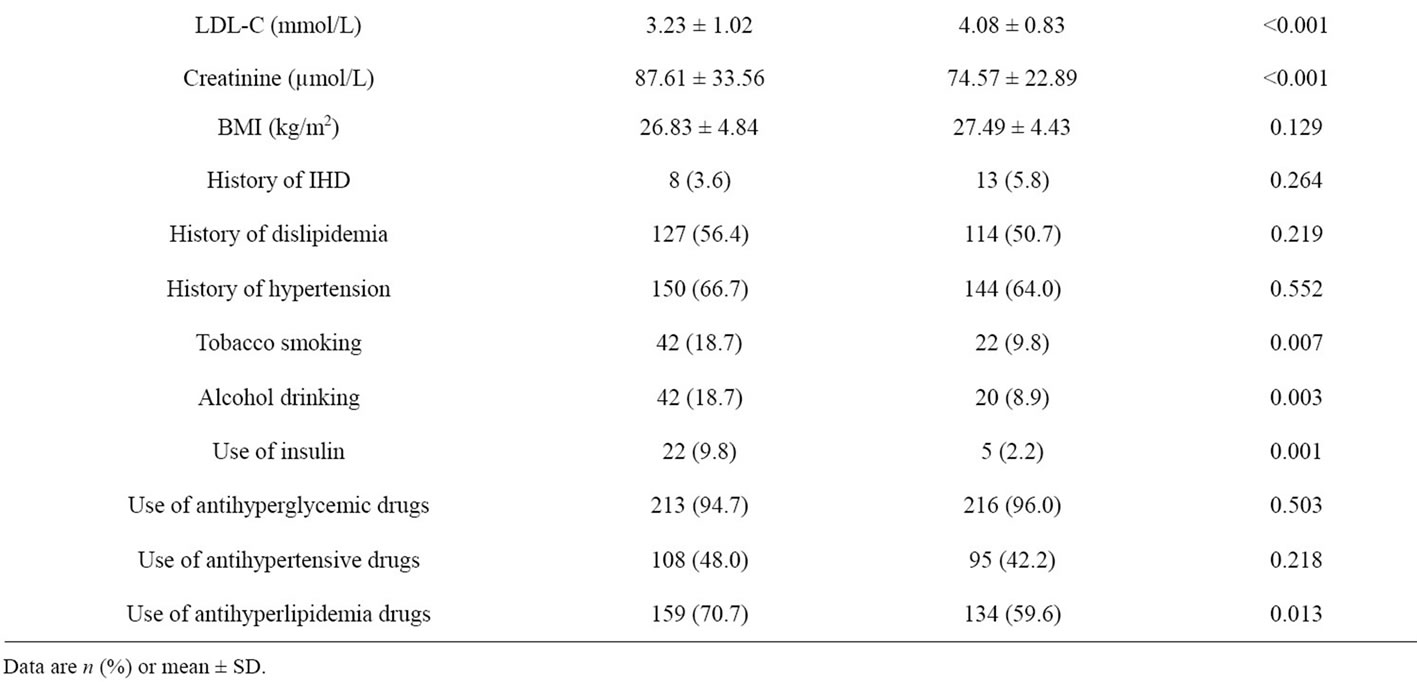
Table 1. Baseline clinical and biochemical characteristics of Thai type 2 diabetes in the derivation set.
LDL-C and alcohol drinking.
Assignment of score point was based on the corresponding regression coefficients. The regression coefficients were transformed by dividing with the smallest coefficients in the model (0.56) and then rounding to the nearest 0.5 to obtain item scores. After item scores were summed up to total scores, they ranged from 0 to 11.5 (Table 2).
When using total scores as the only predictors in the logistic model, the scoring scheme explanined 76.8% of the proability of the presence of microalbuminuria (p-Value 0.363) demonstrated by the area under the ROC curve (Figure 1). When the total scores were categorized into three levels; low risk (scores ≤ 2), moderate risk (scores 2.5 - 5.5) and high risk (scores ≥ 6) in Table 3. 30.67% of the controls group were in low risk level, 64.44% in moderate risk and 4.89% in high risk. In cases groups, the percentage were 8.44%, 55.56% and 36.00%, respectively. The Likelihood Ratio (LR) indicated that type 2 diabetes subjects in the low risk level and high risk were respectively 0.28 and 7.36 times more likely to present with micoralbuminuria (Table 3).
3.2. Validation of Scoring Scheme
The validation set was comprised of 232 type 2 diabetes patients. When we compare this dataset with the derivation set, the two sets are different in various characteristics (Table 4).
The scoring scheme was applied to the validation set; it successfully distinguished subjects according to risk of microalbuminuria. Subjects with higher scores had an increased probability of the presence of microalbuminuria (Table 5). The areas under the ROC curve of the logistic model in the derivation and validation sets were 0.768 (95% CI 0.73 - 0.81) and 0.758 (95% CI 0.70 - 0.82) respectively, suggesting similar performance (pValue 0.798) as shown in Figure 1.
4. DISCUSSION
Risk factors of microalbuminuria in type 2 diabetes in these findings are consistent with prior reports [16-20].

Table 2. Coefficient (95%CI) of significant predictor and item scores.
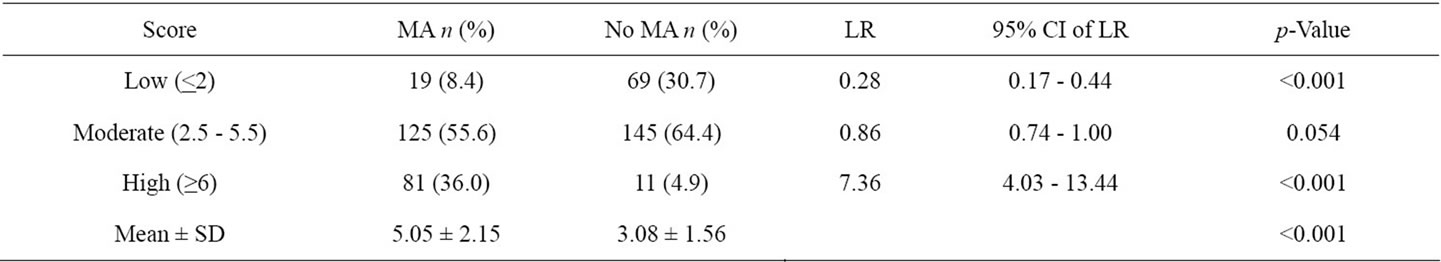
Table 3. Distribution of score levels and likelihood ratio of microalbuminuria.
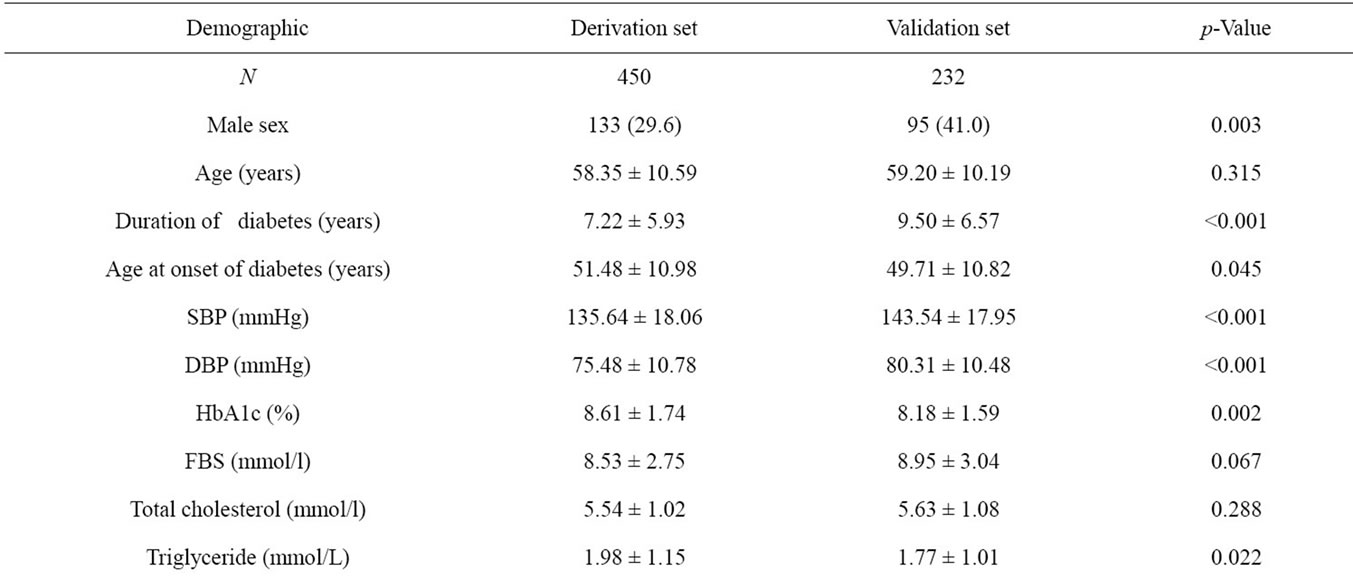
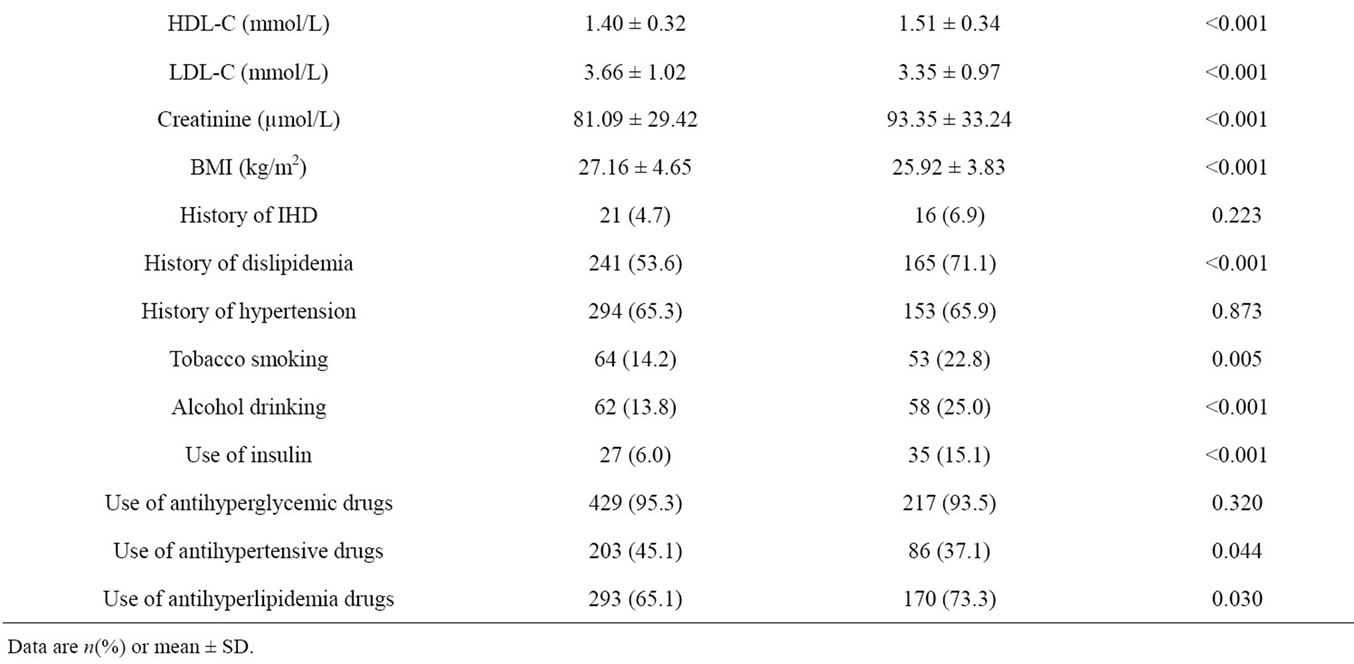
Table 4. Characteristics of samples in the derivation set and validation set.
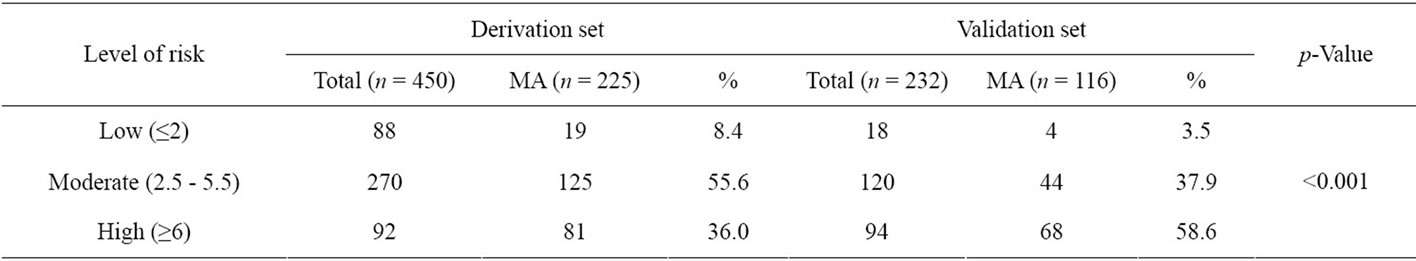
Table 5. Performance of the risk scoring scheme in the derivation and the validation set.
Duration of diabetes, age at onset of diabetes, systolic blood pressure, LDL-C, creatinine and alcohol drinking were independent predictors of microalbuminuria and were included in the scoring scheme. We present a relatively simple point scoring scheme for calculating the risk of microalbuminuria in type 2 diabetes. The scores were derived from a stepwise logistic regression model calculated from case control studies.
The performance of the risk scoring scheme between derivation and validation set had statistical significance (p-Value < 0.001). Although because of the subject’s data in the derivation set was draw from the general hospital
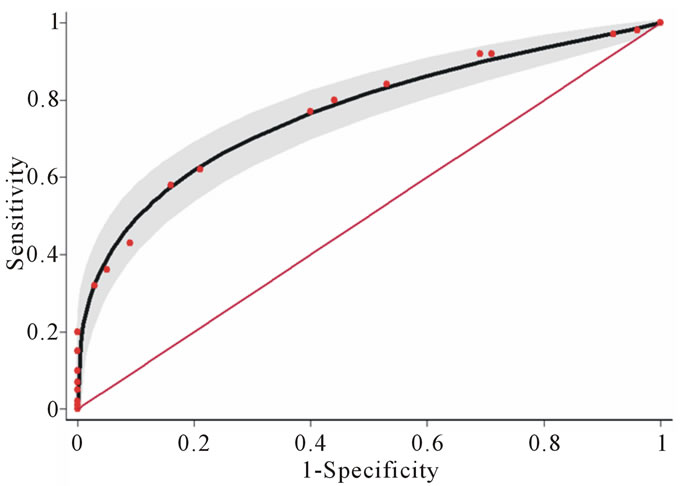
Figure 1. Areas under the receiver operating characteristic (ROC) curves of the derivation set: Solid line (0.768) and the validation set: Dashed line (0.758). Test for equivalence of the two areas under the ROC curves, p-Value 0.798. The gray areas represent the lower and upper 95% confidence interval. The diagonal line indicates no predictive ability.
that the most of patients were not complicates. The scoring for microalbuminuria in this group had more in the moderate level. Whereas in the validation set used the data of patients who’s received treatment in the tertiary hospital. The patients were complicated more than in general hospital. The risk score for predict microalbuminuria in the validation set were more in the high level.
The score was able to separate those who had the development of microalbuminuria and those who had normoalbuminuria. The total scores were categorized into three levels of occur proability of microalbuminuria; low level (scores ≤ 2), moderate level (scores 2.5 - 5.5) and high level (scores ≥ 6) as shown in Figure 2. The risk score performs moderately well at predicting microalbuminuria in type 2 diabetes, with an area under the ROC of 76.89%. The risk score appears to be a simple and effective tool for identification of those at risk of developing microalbuminuria using routinely collected biochemical information from patient records. We recommend that type 2 diabetes with risk scores less than or equal 2 and risk scores between 2.5 to 5.5 should be followed for progressing risks every 12 and 6 months respectively; these are the routine follow up times. Risk scores higher than five should be confirmed with a standard test before starting the treatment.
This study has several limitations. Firstly, our study design used case-control studies that had the possibility of recall bias. In the future, this score will need to be developed and validated in other prospective cohorts. Secondly, the validation set was small because of our limited study time and budget. The size of the sample should be increased next time. Thirdly, these scores were collected from both general and tertiary hospitals in Thai people. The results may not be generalizable to type 2
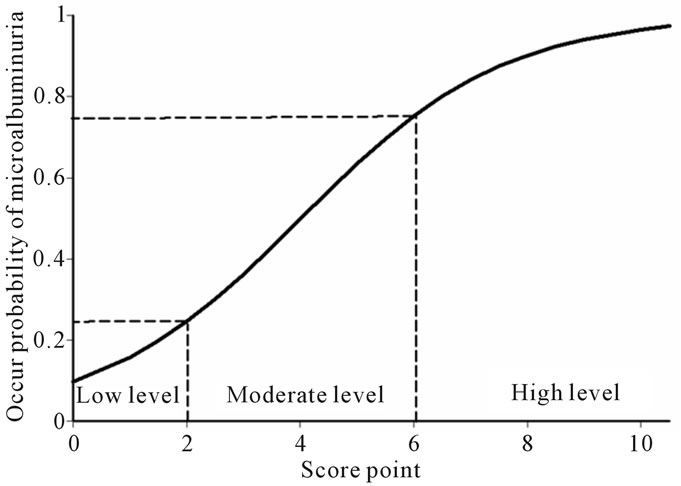
Figure 2. Score point and level of probability of microalbuminuria positive.
diabetes patients in all setting, especially those in primary care unit. Lastly, we developed a risk score to predict microalbuminuria in Thai type 2 diabetic patients. It is noteworthy that risk scores derived from one population may not adequately predict the event risk in other populations especially who not Asian peoples because have different incidences of the events of interest and demographics data.
5. CONCLUSION
A risk prediction score for microalbuminuria was developed in Thai type 2 diabetes patients. This score was fairly predictive for future microalbuminuria and may be more feasible than mass type 2 diabetes population screening with biochemical tests in defining target populations for prevention program.
6. ACKNOWLEDGEMENTS
This project was supported by grants from the Faculty of Medicine Research Fund, Chiang Mai University, Thailand.
![]()
![]()
REFERENCES
- Messent, J.W.C., Elliott, T.G., Hill, R.D., Jarrett, R.J., Keen, H. and Viberti, G. (1992) Prognostic significance of microalbuminuria in insulin-dependent diabetes mellitus: A twenty-three year follow-up study. Kidney International, 41, 836-839. doi:10.1038/ki.1992.128
- Mattock, M.B., Barnes, D.J., Viberti, G., Keen, H., Burt, D., Hughes, J.M., Fitzgerald, A.P., Sandhu, B. and Jackson, P.G. (1998) Microalbuminuria and coronary heart disease in NIDDM: An incidence study. Diabetes, 47, 1786-1792. doi:10.2337/diabetes.47.11.1786
- Bennett, P.H. (1989) “Microalbuminuria” and diabetes: A critique-assessment of urinary albumin excretion and its role in screening for diabetic nephropathy. American Journal of Kidney Disease, 13, 29-34.
- Kilaru, P. and Bakris, G.L. (1994) Microalbuminuria and progressive renal disease. Journal of Human Hypertension, 8, 809-817.
- Manaviat, M.R., Afkhami, M. and Shoja, M.R. (2004) Retinopathy and microalbuminuria in type II diabetic patients. BMC Ophthalmology, 4, 9. doi:10.1186/1471-2415-4-9
- American Diabetes Association. (2009) Standards of medical care in diabetes. Diabetes Care, 32, S13-S61. doi:10.2337/dc09-S013
- Mainous, A.G. and Gill, J.M. (2001) The lack of screening for diabetic nephropathy: Evidence from a privately insured population. Family Medicine, 33, 115-119.
- Ngarmukos, C., Bunnag, P., Kosachunhanun, N., Krittiyawong, S., Leelawatana, R., Prathipanawatr, T., Plengvidhya, N., Benjasuratwong, Y., Suwanwalaikorn, S., Deerochanawong, C., Chetthakul, T., Mongkolsomlit, S. and Rawdaree, P. (2006) Thailand diabetes registry project: Prevalence, characteristics and treatment of patients with diabetic nephropathy. Journal of the Medical Association Thailand, 89, S37-S42.
- Parikh, C.R., Fischer, M.J., Estacio, R. and Schrier, R.W. (2004) Rapid microalbuminuria screening in type 2 diabetes mellitus: Simplified approach with Micral test strips and specific gravity. Nephrology Dialysis Transplantation, 19, 1881-1885. doi:10.1093/ndt/gfh300
- Gall, M., Hougaard, P., Borch-Johnsen, K. and Parving, H. (1997) Risk factors for development in incipient and overt diabetic nephropathy in patients with non-insulin dependent diabetes mellitus: Prospective, observational study. British Medical Journal, 314, 783-788. doi:10.1136/bmj.314.7083.783
- Schmitz, A., Vaeth, M. and Mogensen, C. (1994) Systolic blood pressure relates to the rate of progression of albuminuria in NIDDM. Diabetologia, 37, 1251-1258. doi:10.1007/BF00399799
- Cederholm, J., Eliasson, B., Nilsson, P.M., Weiss, L. and Gudbjornsdottir, S. (2005) Microalbuminuria and risk factors in type 1 and type 2 diabetic patients. Diabetes Research and Clinical Practice, 67, 258-266. doi:10.1016/j.diabres.2004.07.021
- Varghese, A., Deepa, R., Rema, M. and Mohan, V. (2001) Prevalence of microalbuminuria in type 2 diabetes mellitus at a diabetes centre in southern India. Postgraduate Medical Journal, 77, 399-402. doi:10.1136/pmj.77.908.399
- Hsieh, F.Y., Bloch, D.A. and Larsen, M.D. (1998) A simple method of sample size alculation of linear and logistic regression. Statistic in Medicine, 17, 1623-1634. doi:10.1002/(SICI)1097-0258(19980730)17:14<1623::AID-SIM871>3.0.CO;2-S
- Moons, K.G.M. (2002) Should scoring rues be based on odds ratios or regression coefficients? Journal of Clinical Epidemiology, 55, 1054-1055. doi:10.1016/S0895-4356(02)00453-5
- Modebe, O. and Masoomi, M.A. (2000) Microalbuminuria and associated factors in Bahraini patients with type 2 diabetes mellitus. Annals of Saudi Medicine, 20, 157-160.
- Rodney, C.P.G., Renee, D., Jeffrey, M.R., David, S.H.B., Chotip, V. and Ronald, T.A. (2001) Prevalence and risk factors of microalbuminuria in a cohort of African-American women with gestational diabetes. Diabetes Care, 24, 1764- 1769. doi:10.2337/diacare.24.10.1764
- Kohler, K.A., McClellan, W.M., Ziemer, D.C., Kleinbaum, D.G. and Boring, J.R. (2000) Risk factors for microalbuminuria in Blick Americans with newly diagnosed type 2 diabetes. American Journal of Kidney Dissease, 36, 903-913. doi:10.1053/ajkd.2000.19080
- Bruno, G., Merletti, F., Biggeri, A., Bargero, G., Ferrero, S., Pagano, G. and Perin, P.C. (2003) Progression to overt nephropathy in type 2 diabetes. Diabetes Care, 26, 2150- 2155. doi:10.2337/diacare.26.7.2150
- Aekplakorn, W., Srivanichakorn, S. and Sangwatanaroj, S. (2009) Microabluminuria and metabolic risk factors in patients with type 2 diabetes in primary care setting in Thailand. Diabetes Research and Clinical Practice, 84, 92-98. doi:10.1016/j.diabres.2008.12.020
NOTES
*Grant support: This project was supported by grants from the Faculty of Medicine Research Fund, Chiang Mai University, Thailand.
Conflict of interest: The authors declare that they have no conflict of interest.