Advances in Chemical Engineering and Science
Vol. 2 No. 2 (2012) , Article ID: 18913 , 9 pages DOI:10.4236/aces.2012.22033
Unsteady Fluidynamic Behavior of Gas Bubbles Flowing in Curved Pipes: A Numerical Study
1Department of Chemical Engineering, Center of Sciences and Technology, Federal University of Campina Grande, Campina Grande, Brazil
2Department of Mechanical Engineering, Center of Sciences and Technology, Federal University of Campina Grande, Campina Grande, Brazil
Email: luis_gmarinho@yahoo.com.br, fariasn@deq.ufcg.edu.br, rdswarnakar@yahoo.com, gilson@dem.ufcg.edu.br
Received January 6, 2012; revised February 10, 2012; accepted March 9, 2012
Keywords: Slug Flow; Taylor Bubbles; Curved pipe; CFD; Oil; Simulation
ABSTRACT
Petroleum is considered as one of the factors for the development of a nation as well as a cause of economic and political conflicts around the world because of the diversity of products obtained with their derivatives such as fuel for automotives and aviation, and manufacturing plastic parts, among others. The crude petroleum (usually oil, water and gas) found in an underground reservoir is transported to the surface by pipes, and has drawn the attention of researchers because of the problems generated in the pipeline with particular attention to the loss of pressure, friction and bubbles. For a fluid flow in plug regime, where many of the bubbles formed coalesce and produce bigger ones of sizes almost equal to the pipe diameter (Taylor bubble), severe instability in the flow is caused. In this context, the objective of this research has been to study the Taylor bubble flow in curved ducts using the software CFX. Results of the transient effects of the air concentration on the bubble air volumetric fraction, of the viscosity on bubble format, and pipe angle of 90˚ on bubble symmetry are presented and interpreted.
1. Introduction
Petroleum is considered as an important factor for the development of a nation. It is extracted out of the underground reservoirs. It is generally composed of oil, air and water, which are carried up to the surface by pipes. To foresee the possible fluid flow instabilities in the pipes, researchers have been studying the behavior of the multiphase flow in the interior of pipes.
Slug flow is one of the most common and complex flow patterns in two-phase flow characterized by long gas bubbles almost filling the pipe cross-section, where liquid moves around the bubbles and in bulk between two successive bubbles. Slug flow exists over a broad range of gas and liquid flow rates and is encountered in a wide variety of industrial applications like oil and gas wells, process vaporizers and gas-liquid pipeline reactors [1-6].
The study of bubble behaviors, mainly that which consists of elongated bubbles, is one of the important aspects associated with two-phase flows.
Some authors who have reported, in literature, their studies on Taylor bubble behavior are [1-4] and [7-14].
Taylor bubble formation as the most dominant twophase flow pattern, in the miniature channels with stagnant liquids, has been reported by [13].
[14] proposed that elongated Taylor bubble can be divided into three parts according to the profile configuration of the acting forces (inertial forces, surface tension and viscosity). The first part is prolate spherical cap zone, the third part is the terminal cylinder zone with terminal constant thickness and velocity of fully developed falling liquid film. The second part is the transition zone between the prolate spherical cap and the terminal cylinder. The results of viscosity effect are interesting, with a significant effect on the streamlines in the Taylor bubble wake zone. It was found that the higher the viscosity, the lesser is the distortion and the smaller is the fluctuation of the bubble bottom. These authors have also observed the presence of small bubbles in the Taylor bubble tail (oblate spheroidal part).
The classical Taylor bubble often observed in the laboratory usually results from air rising in water and has a prolate spheroidal leading edge and a flat, or even concave, trailing edge, [1]. According to these authors, the Taylor bubble formation occurs when the gas flow increases in the system, increasing the number of bubbles that form and there is a tendency to coalesce and to form bubbles with dimensions close to the duct diameter.
[10] found that the pipe wall did not influence the shape or diameter of the breaking bubble. This is because the bubble breaking was influenced by the buoyancy force and surface tension between bubble and the nozzle. However, once the bubble got disconnected from the nozzle, the pipe wall influenced the bubble behavior, being reflected in the slow rise of the bubble in the tube. The experimental results for the larger diameter tubes (D = 6.35 and 4.36 mm) indicated that the departure diameter of bubble is not affected by the wall of the tube, but the velocities of the bubble rising in large diameter tube were higher than those obtained with the tube of D = 3.18 mm.
An experimental study for different stages of bubble formation, through a point of air injection, has been reported by [10]. The injection nozzle had an internal diameter of 0.556 mm. The pipe diameter ranging from 1.89 to 6.35 mm and length from 200 mm to 270 mm were used. These authors studied bubble formation with the aid of a high-resolution camera, in circular, triangular, quadratic and rectangular pipes. It was observed that as more gas is injected bubble tends to grow more, and its initial spherical shape changed to an elliptical shape. This behavior is due to buoyancy forces. As the bubble grows it narrows at the injection nozzle and the contact from nozzle is broken taking the shape of a nearly perfect sphere in the vertical direction.
[2] published an experimental investigation of flow patterns and characteristics of two-phase flow in upward inclined tubes of 2 - 8 mm diameter. These authors concluded that the shape and the radial position of the gas slug, in the tube, are influenced by the tube diameter, flow rate and inclination angle of tube. Furthermore, the length of gas slug increases with the superficial gas velocity. The length of gas slug in the inclined tube is longer than that in the vertical or horizontal tube, and the gas slug velocity in the inclined tube is faster than that in the vertical or horizontal tube. Observations made under various inclinations of tubes showed that the flow pattern was elongated bubble flow and no small dispersed bubbles existed in liquid slug.
[12], in their review paper, have reported CFD studies of Taylor bubbles in 3D and 2D geometries. The objective was to study slug flow in micro-channels (0.25, 0.5, 0.75, 1, 2 and 3 mm). They mentioned that in the computational region, the slug length slightly increases with the increase of surface tension. However, there is almost no influence of liquid viscosity. It was observed that there is no significant difference in the slug length obtained when 3D and 2D geometries were studied. These authors concluded that: 1) gas slug length increases by increasing the superficial gas velocity, and by decreasing the superficial liquid velocity; 2) liquid slug length increases by increasing the superficial liquid velocity, and decreasing superficial gas velocity.
The study on the flow regime for two-phase gas-liquid flow in an inclined tube with small diameter is still very little in literature. Therefore, in order to make a contribution in this area of knowledge, present research aimed to study the unsteady behavior of gas bubbles flowing in curved pipes (90˚ angle), with particular reference to Taylor bubbles, using the software CFX-3D.
2. Mathematical Modeling
2.1. Governing Equations
To study the two-phase flow (gas-oil) in curved pipes (Figure 1), following conditions were adopted: 1) twodimensional field domain in cylindrical coordinates; 2) isothermal flow; 3) no chemical reaction; 4) phases treated as incompressible fluid with physical properties being constant; 5) no gravity effect; and 6) no interfacial mass transfer. Thus, the conservation equations are described as:
- Equation of mass conservation;
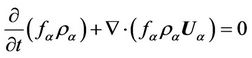 (1)
(1)
- Equation of momentum conservation;
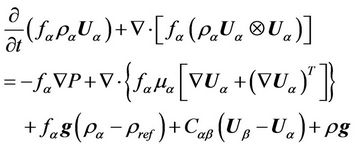 (2)
(2)
where Cαβ corresponds the interfacial drag term, given by:
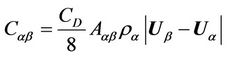 (3)
(3)
The indices α and β represent the continuous and dispersed phase; ƒ, ρ, μ, U are the volume fraction, density, dynamic viscosity and velocity vector respectively, P is the pressure, and Aαβ represents the density of interfacial area, which is given by:
 (4)
(4)
where ƒβ and dβ are volumetric fraction and air bubble diameter respectively.
The drag coefficient CD, was estimated by the Grace model [16]. This model considers the dispersed phase shape effect, a constant interfacial tension of the bubble and is given by:
 (5)
(5)
where UT is terminal velocity of a rising bubble, Δρ is density difference between phases, d is bubble diameter and ρc is density of continuous phase.
In the model, a constraint equation was used, where the sum of the volumetric fraction of the phases is unity. This equation is given by:
 (6)
(6)
The pressure field used was same for all the phases. In this case it is given by:
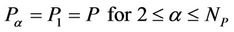 (7)
(7)
2.2. Initial and Boundary Conditions
a) Initial conditions:
At time t = 0, the pipe was completely full with oil, at pressure 101,325 Pa, and the velocity components of the two phases were considered void.
b) Boundary conditions:
b1) At inlet:
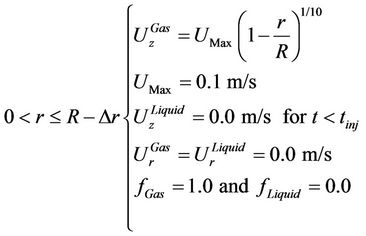

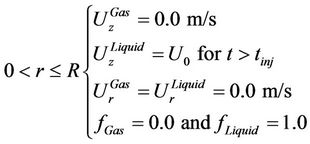
where Δr is the distance between the bubble and the pipe wall,  are respectively the and radial components for the gas and liquid speed,
  are the gas and liquid volume fractions respectively, and R is the radius of the pipe.
b2) At outlet:
 (8)
(8)
b3) At symmetry planes:
 (9)
(9)
where θ it is the angular coordinate.
b4) At pipe walls:
 (10)
(10)
2.3. Thermo Physical Properties and Data for Simulation
The physical properties of liquid and gas used in the simulations are presented in Table 1.
In Table 2 are given other details about the mathematical model and numerical treatment of governing equations.
The cases analyzed in the present work are shown in Table 3.
2.4. The Numerical Mesh
The geometry and the dimensions of the pipe used in the present work are shown in the Figure 1. Due to the observed symmetry of the fluid flow in tubes, this study has been realized in an unstructured two-dimensional mesh
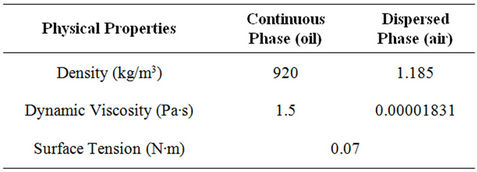
Table 1. Physical properties of fluids.

Figure 1. Geometrical shape and dimensions of pipe used in this study.

Table 2. General conditions of the physical problem and numerical treatment.
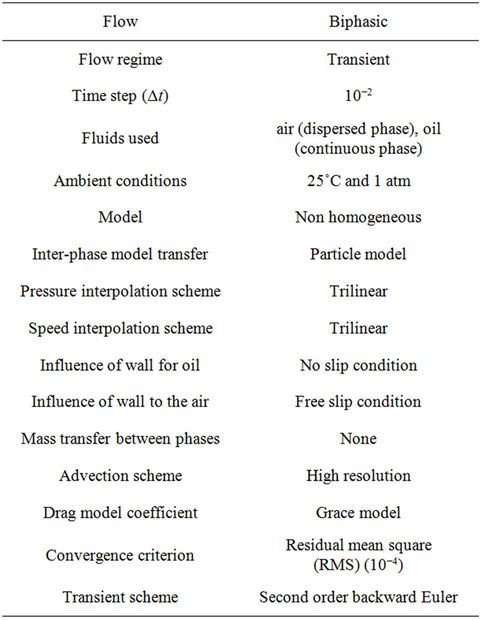
Table 3. Characteristic data of the cases studied.
obtained by using CFX® 5.6 software.
This mesh constituted of prismatic and pyramidal elements is illustrated in Figure 2.
The behavior of bubble flow in pipe with an angular junction of 90˚ was investigated numerically using Pentium 4 computers, Core 2 Duo 3.0 GHz, 2048 Mb RAM memory and a hard disk of 120 Gb. The total time of simulation for each case was of approximately of 11 hours.
3. Results and Discussion
The results of the numerical study of the fluidodynamics
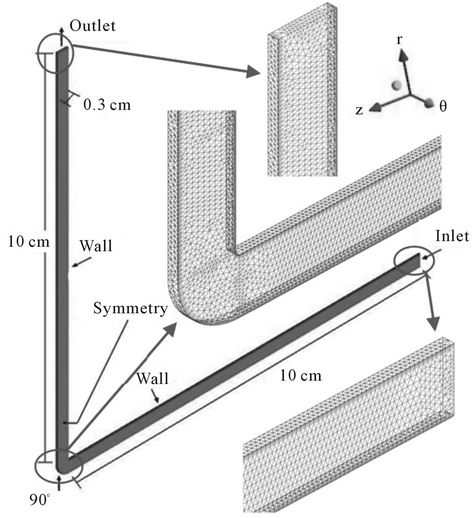
Figure 2. Numerical mesh and pipe boundary.
and geometric behavior of air bubbles during the cocurrent air-oil flow inside a pipe with a 90˚ curvature are presented. The effects of the parameters evaluated are: the air injection time (0.02, 0.1 and 0.5 s) in the horizontal and vertical sections of the pipe, the oil viscosity (0.5 to 5.0 Pa∙s) on the format of the bubble and pipe curvature of 90˚ on the symmetry of the formed bubbles. The details of the cases studied are shown in Table 3.
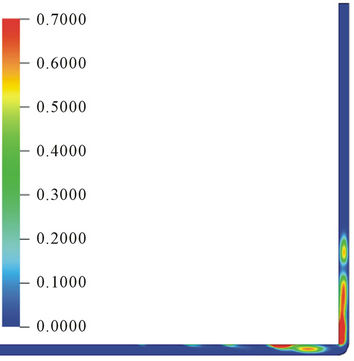
For representing the air bubble movement in the interior of the pipe, the air phase volumetric fraction distributions have been used. In all the figures, the blue color corresponds to the liquid phase, and other colors show the variation of the air fraction in the gas bubble. To facilitate the visualization and interpretation of the results the minimum and the maximum fractions of the gas were fixed at 0.0 and 0.7, respectively.
3.1. Effect of Air Injection Time (Air Concentration)
To analyze the effect of air concentration on the formation and movement of bubbles inside the pipe, certain quantity of gas, through a circular orifice of radius Rmax = 1 mm was injected into the pipe.
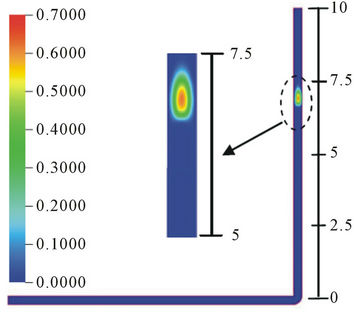
The behavior of the air bubble for the trajectory time of 0.4 s and 1.0 s are shown in Figures 3 and 4 respectively. It can be seen that, for all the three cases, Cases 1, 2 and 3, the diameters of the bubbles formed approach to the diameter of the pipe, and can be considered as Taylor bubbles ([1,2,4,10,12-13,15]).
For Cases 1 and 2, it can be noticed that the bubbles are practically at the same positions of the pipe (see Figure 3). The central parts of the bubbles are approximately at 6.5 cm of the distance. However, this did not happened for Case 3, where the central part of the first bubble is approximately at a distance of 4.5 cm. On further dislocation of the bubbles, in the tube, their frontal parts become more concave. This effect could be due to the friction of the wall contact area on the bubble, which is easily visualized in Case 3.
For Cases 1 and 2, in the horizontal section of the pipe, in the upper back side of the bubble, a formation of gas trail is notice (see Figure 3). This can be due to the release of the micro bubbles. Thus, at the end of 1s of trajectory time, when the Taylor bubble reaches the end of the vertical section of the pipe, its volume is reduced (see Figure 4).
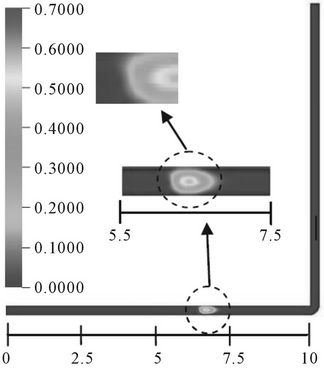
In Case 3, when the amount of air is increased by 25 times with respect to Case 1, formation of more bubbles, dislocating near the upper surface of the tube wall, can be observed (see Figures 3(c) and 4(c)). For this case 3, having 0.4 s of trajectory time, formation of a bigger bubble with three small nuclei, possessing approximately 70% of volumetric air fraction, can be seen. Also, in this case, as the trajectory time of 0.4 s, which is less than the air injection time of 0.5 s, an incomplete release of the bubble at the nozzle mouth is seen and the formation of a micro bubble trail, on the back side of the bubble, is noticed (see Figures 3(c) and 4(c)).
The positions of the first bubbles, in the pipe, for the trajectory time of 1.0 s, shown in Figure 4, are different but consistent with the air injection times. It is to be noted that in Case 3, the air fraction in the second bubble is higher. This phenomenon may be explained due to the reduction of bubble velocity, when it passes through the 90° angle of the pipe. This reduction of the velocity helps in merging of the last bubble with the second one and letting the tail of this bubble disappear. Thus, the size and format profiles of the two bubbles are different, (see Figure 4(c)). The movement of the bubbles in the vertical part of the pipe makes their frontal part neatly spherical.
 (a)
(a) (b)
(b)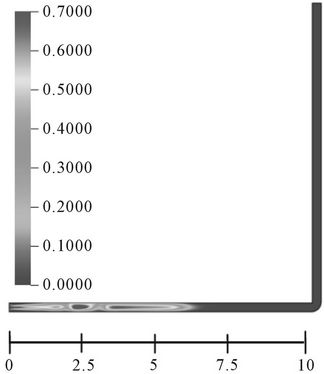 (c)
(c)
Figure 3. (a) Volumetric fraction of air in bubble and bubble position at 25˚C and t = 0.4 s (Case 1); (b) Volumetric fraction of air in bubble and bubble position at 25˚C and t = 0.4 s (Case 2); (c) Volumetric fraction of air in bubble and bubble position at 25˚C and t = 0.4 s (Case 3).
 (a)
(a)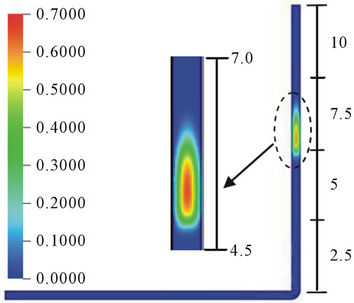 (b)
(b)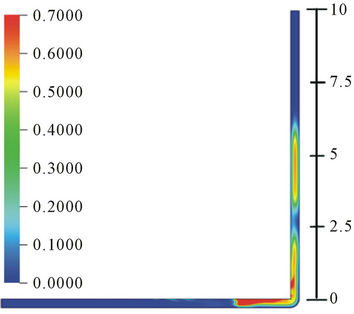 (c)
(c)
Figure 4. (a) Volumetric fraction of air in bubble and bubble position at 25˚C and t = 1.0 s (Case 1); (b) Volumetric fraction of air in bubble and bubble position at 25˚C and t = 1.0 s (Case 2); (c) Volumetric fraction of air in bubble and bubble position at 25˚C and t = 1.0 s (Case 3).
This observation is in agreement with the one reported by [10].
Comparing the results, shown in Figures 4(a)-(c), it becomes evident that the air injection time has great influence on the format and the length of the Taylor bubble, which is also mentioned by [10]. These authors commented that as the amount of air injected is increased, the bubble size increases while changing its format from spherical to elliptical due to the buoyancy forces. In all the cases, analyzed here, the asymmetry of the bubble in the horizontal section and symmetry in the vertical section of the pipe has been verified.
3.2. Effect of the Oil Viscosity
The oil phase viscosity has a strong effect on the bubble format and has been reported in works of [1,14-16], among others. In Figure 5, the results of the effect of the variation of the viscosity on the bubble, corresponding to Cases 4, 5, 6 and 7, for a 1.4 s of trajectory time and air injection time 0.5 s, are presented. It can be observed that, for all the four viscosities studied, the bubble formats are well defined. For 0.5 Pa∙s viscosity case, three bubbles of different sizes are formed, (see Figure 5(a)). For the first bubble a greater enlargement in the upper part of the bubble tail has occurred. The second bubble has a higher air concentration in the central part and the third bubble presents a small gas trail. The number of bubbles formed for viscosities 1.5 Pa∙s and 2.5 Pa∙s are four each and for 5.0 Pa∙s is five (Figures 5(b)-(d)).
These observed effects can be explained due to the variation of oil viscosity because it exerts different resistances to the bubble flow. Thus, the lower the viscosity, the easier the air bubble tends to deform, and the higher the viscosity, the more numbers of bubbles are formed.
3.3. Effect of Pipe Angular Geometry
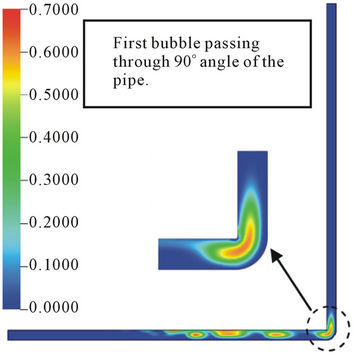
The effect of 90˚ angular geometry of the pipe on the behavior of the bubble, for Case 5, can be visualized in Figure 6. The trajectory times taken to reach the angular section, for each bubble, were registered. They were: 1.1 s; 1.29 s; 1.5 s and 1.65 s; for first, second, third and fourth bubble respectively.
When the air bubbles arrive at the angular section (the bent), they enter in contact with the vertical wall of the pipe, get deformed according to the bending but do not break. Then, bubbles move vertically upward, while maintaining their radial symmetry. Thus, when the first bubble passes through the pipe bending, it suffers a small deformation, gets elongated and molds itself to the angular geometry of the pipe. Due to superficial tension between the bubble and the fluid and lower fluid velocity, the bubble does not break. It regains its format in the vertical section of the pipe.
This behavior of the bubble is in agreement with the results reported by [12]. According to these authors, when the speed of the continuous fluid is equal of the dispersed fluid, the format of the bubble is maintained during their flow in horizontal and vertical sections of the pipe.
 (a)
(a) (b)
(b)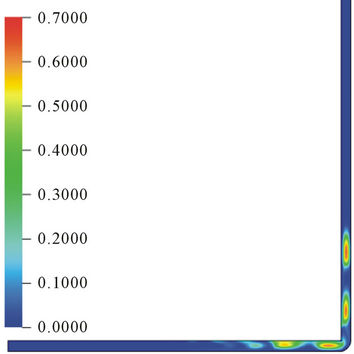 (c)
(c) (d)
(d)
Figure 5. (a) Volumetric fraction of air in bubble at 25˚C, t = 1.4 s and for viscosity of 0.5 Pa∙s; (b) Volumetric fraction of air in bubble at 25˚C, t = 1.4 s and for viscosity of 1.5 Pa∙s; (c) Volumetric fraction of air in bubble at 25˚C, t = 1.4 s and for viscosity of 2.5 Pa∙s; (d) Volumetric fraction of air in bubble at 25˚C, t = 1.4 s and for viscosity of 5.0 Pa∙s.
From the volumetric air fraction point of view the first and second bubbles have between 40% to 70% of the gas fraction, Figure 6(a). However, the second bubble is adhered to the upper side of the horizontal section of the pipe due to the buoyancy force and has less concentration of air in its central region. The volumetric fraction of the air in the last bubble is reduced to about 40%. During the trajectory of the bubbles passing through the 90˚ angular pipe, the concentration of the air reduces from first to last bubble but air fraction in the central region is maintained practically constant, (Figures 6(a)-(d)).
4. Conclusions
Based on the results of numerical simulation of the unsteady fluid dynamics of gas bubble flow in 90˚ curved pipes, following general conclusions can be made.
The format and the length of the Taylor bubble have dependence on the duration of the gas injection time. Higher is the gas injection time, larger is the length of the bubble and more are the bubbles formed.
The air bubble flow, in the pipe, tends to be asymmetrical with reference to the central axis of horizontal section, because of the lower fluid density, and is symmetrical in vertical section, due to the buoyancy effect.
At lower fluid viscosity, the air bubble deforms easily and at higher viscosity more number of bubbles is formed.
The bubble format is molded to the angular geometry of the pipe, while passing through the 90˚ section, and is regained to the original form in the vertical section, without breaking. It happens due to the superficial tension and lower velocity of the fluids.
5. Acknowledgements
The authors would like to give thanks to CAPES, CNPq, FINEP, PETROBRAS, RPCMOD and JBR Engen-
 (a)
(a)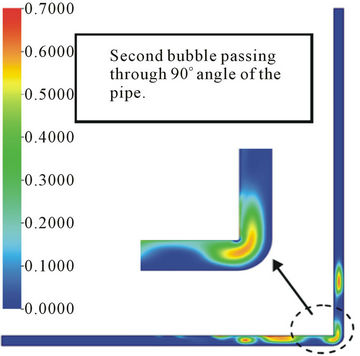 (b)
(b)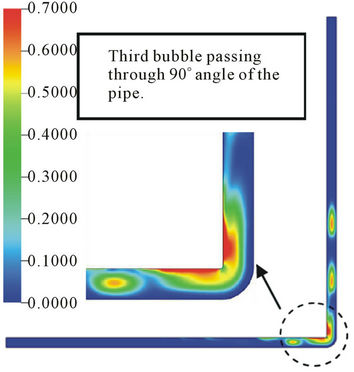 (c)
(c)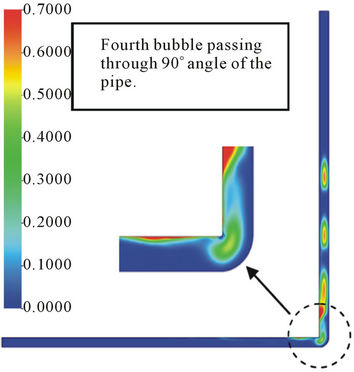 (d)
(d)
Figure 6. Volumetric fraction of air in bubble at 25˚C and t = 0.5 s , for Case 4 at different trajectory time: (a) 1.1 s; (b) 1.29 s; (c) 1.5 s and (d) 1.65 s.
haria LTDA for providing financial support.
REFERENCES
- J. D. Bugg, K. Mack and K. S. Rezkallah, “A numerical Model of Taylor Bubbles Rising through Stagnant Liquids in Vertical Tubes,” International Journal of Multiphase Flow, Vol. 24, No. 2, 1998, pp. 271-281. doi:10.1016/S0301-9322(97)00047-5
- T. Cheng and T. Lin, “Characteristics of Gas-Liquid Two-Phase Flow in Small Diameter Inclined Tubes,” Chemical Engineering Science, Vol. 56, No. 21-22, 2001, pp. 6393-6398. doi:10.1016/S0009-2509(01)00251-2
- S. Madani, O. Caballina and M. Souhar, “Unsteady Dynamics of Taylor Bubble Rising in Vertical Oscillating tubes,” International Journal of Multiphase Flow, Vol. 35, No. 4, 2009, pp. 363-375. doi:10.1016/j.ijmultiphaseflow.2009.01.002
- T. R. Nigmatulin and F. J. Bonetto, “Shape of Taylor Bubbles in Vertical Tubes,” Heat Mass Transfer, Vol. 24, No. 8, 1997, pp. 1177-1185. doi:10.1016/S0735-1933(97)00112-7
- A. M. F. R. Pinto, M. N. C. Pinheiro and J. B. Campos, “On the Interaction of Taylor Bubbles Rising in TwoPhase Co-Current Slug Flow in Vertical Columns: Turbulent Wakes,” Experiments in Fluids, Vol. 31, No. 6, 2001, pp. 644-652. doi:10.1007/s003480100310
- A. M. F. R. Pinto and J. B. L. M. Campos, “Coalescence of Two Gas Slugs Rising in a Vertical Column of Liquid,” Chemical Engineering Science, Vol. 51, No. 1, 1996, pp. 45-54. doi:10.1016/0009-2509(95)00254-5
- G. H. Abdul-Majeed and T. M. Al-Masha, “A Mechanistic Model for Vertical and Inclined Two-Phase Slug Flow,” Journal of Petroleum Science and Engineering, Vol. 27, No. 1-2, 2000, pp. 59-67. doi:10.1016/S0920-4105(00)00047-4
- E. Al-Safran, “Investigation and Prediction of Slug Frequency in Gas/Liquid Horizontal Pipe Flow,” Journal of Petroleum Science and Engineering, Vol. 69, No. 1-2, 2009, pp. 143-155. doi:10.1016/j.petrol.2009.08.009
- G. Bercic and A. Pintar, “The Role of Gas Bubbles and Liquid Slug Lengths on Mass Transport in the Taylor Flow through Capillaries,” Chemical Engineering Science, Vol. 52, No. 21-22, 1997, pp. 3709-3719. doi:10.1016/S0009-2509(97)00217-0
- Q. C. Bi and T. S. Zhao, “Taylor Bubbles in Miniaturized Circular and Noncircular Channels,” International Journal of Multiphase Flow, Vol. 27, No. 3, 2001, pp. 561- 570. doi:10.1016/S0301-9322(00)00027-6
- R. Clift, J. R. Grace and M. E. Weber, “Bubbles, Drops and Particles,” Academic Press, California, 1978.
- D. Qian and A. Lawal, “Numerical Study on Gas and Liquid Slugs for Taylor Flow in a T-Junction Microchannel,” Chemical Engineering Science, Vol. 61, No. 23, 2006, pp. 7609-7625. doi:10.1016/j.ces.2006.08.073
- W. Salman, A. E. Gavriilidis and P. Angeli, “A Model for Predicting Axial Mixing During Gas-Liquid Taylor Flow in Microchannels at Low Boden-Stein Numbers,” Chemical Engineering Science, Vol. 101, No. 1-3, 2004, pp. 391-396. doi:10.1016/j.cej.2003.10.027
- D. Zheng, X. He and D. Che, “CFD Simulations of Hydrodynamic Characteristics in a Gas-Liquid Vertical Upward Slug Flow,” International Journal of Heat Mass Transfer, Vol. 50, No. 21-22, 2007, pp. 4151-4165. doi:10.1016/j.ijheatmasstransfer.2007.02.041
- E. T. White and R. H. Beardmore, “The Velocity of Rise of Single Cylindrical Air Bubbles through Liquid Contained in Vertical Tubes,” Chemical Engineering Science, Vol. 17, No. 5, 1962, pp. 351-361. doi:10.1016/0009-2509(62)80036-0
- ANSYS CFX, “User Manual Theory,” USA, 2006.