International Journal of Geosciences
Vol.4 No.10(2013), Article ID:41372,5 pages DOI:10.4236/ijg.2013.410138
Applicability of Phase Synchronization Clustering to Detect the Process of Climate Events
College of Physical Science & Technology, Yangzhou University, Yangzhou, China
Email: qianzh@yzu.edu.cn
Copyright © 2013 Zhonghua Qian et al. This is an open access article distributed under the Creative Commons Attribution License, which permits unrestricted use, distribution, and reproduction in any medium, provided the original work is properly cited. In accordance of the Creative Commons Attribution License all Copyrights © 2013 are reserved for SCIRP and the owner of the intellectual property Zhonghua Qian et al. All Copyright © 2013 are guarded by law and by SCIRP as a guardian.
Received September 9, 2013; revised October 5, 2013; accepted November 4, 2013
Keywords: Climate Events; Process; Phase Synchronization
ABSTRACT
Phase synchronization clustering method is used to detect the process of extreme weather events rather than extreme values events mathematically. The applicability is discussed from the aspects of noise intensity and sequence length and the observed data are applied practically. The detection process shows that clustering measure difference can detect the temporal process objectively to a certain degree and it has certain application to detect the temporal process of extreme weather events.
1. Introduction
With global warming, extreme weather events have become increasingly common. The third and fourth assessment reports by the IPCC both gave a definite definition about extreme weather events: for a particular place at a particular time, extreme weather events are small probability ones, whose occurring probability is about 10% or even more lower [1]. Then based on probability distribution curve of meteorological elements, extreme weather events are defined and researched [2-9], which are strictly extreme values events mathematically. In fact, what damage every extreme weather event amount could cause to society and economy depends on its strength, affected area and duration. So it is very significant to focus on the process, i.e., the rise, the development and the fall of extreme weather events. Recently, some researchers have concerned about this issue [10,11], while these methods are not objective enough and need some artificial judgment.
A. Hutt and co-workers proposed a method to detect mutual phase synchronization [12], which provided a kind of thought to detect the process of weather events. The data recorded in certain open systems are considered to be split into temporal sequences of fast transients on the one hand and time windows of narrow-band time scales on the other. The part of phase synchronization is considered to be a state or a cluster about time windows, presenting temporal partition, i.e., the temporal process. Here, the applicability about phase synchronization to detect temporal process of weather events is studied in detail.
2. Method of Detecting the Process
2.1. Definition of Phase
In physics, phase reflects the state of a signal. Phase synchronization analysis is to separate the information about amplitude and phase from signal and only phase information and phase relativity are considered. The phase  of a real signal s(t) can be defined via its corresponding analytical signal
 .
.
 (1)
(1)
 is Hilbert transform about
 ,
,
 (2)
(2)
where , the integral in Equation (2) refers to the Cauchy principal value. Then
 (3)
(3)
is the phase of signal.
2.2. Phase Clustering and Cluster Quality Measure
In order to detect temporal process objectively, temporal phase sequences are clustered by K-means cluster algorithm and cluster quality measure is used to give the proper number of clusters [12]. The following is mainly about the method of detection of phase synchronization approached by A. Hutt and co-workers. Because the phase data represent time series and all the data are well ordered in time. Therefore, clusters can be considered as temporal segments as the K-means algorithm maps data points to their nearest cluster centers. For every number of clusters K, each data point i is associated with a cluster measure ,
,
 (4)
(4)
where  is the normalized factor.
  and
and
 denote the nearest and the second-nearest cluster center of data point i, respectively.
  represents a subset of members of the cluster to which data point i is associated. The dataset is partitioned into distinct subsets
  reflecting consecutive time segments each. For every number of clusters K the subsets
  represent consecutive time segments. Usually the optimal number of clusters is unknown resulting in an uncertainty about a proper choice of K. To minimize this uncertainty a statistical approach and average different cluster measures with increasing K are used and yields the so so-called cluster quality measure,
 (5)
(5)
where ,
, . R is the maximum number of clusters. An increasing number of clusters K yields an increasing number of subsets
  and subsequently, it diminishes the cluster measures
 . In general, an optimal value of the upper bound R depends on the real number of clusters in the data but R is usually in the range of tens.
In order to compare cluster qualities across different datasets, a reference system is introduced by randomizing the examined dataset with respect to its temporal order. Because the surrogates  do not contain any temporal structure they can be used to normalize the original values
  [13]. An effective clustering measure
  is defined by means of
 (6)
(6)
The difference
 (7)
(7)
reveals significant peaks at segment borders between different clusters [13].
Based on the above analysis, the detection of phase synchronization can classify the temporal phase sequences. A cluster means a temporal phase window, i.e., a state of some event, so the method provides a kind of way to give the process of event.
3. Numerical Simulation of Phase Synchronization
3.1. Detection of One-Dimensional Data
In order to compare with the result of A. Hutt and coworkers’, the following stochastic dynamical system is also discussed,
 (8)
(8)
where ,
,  ,
,
 . The values
  represent phases that evolve along the gradient of a potential,
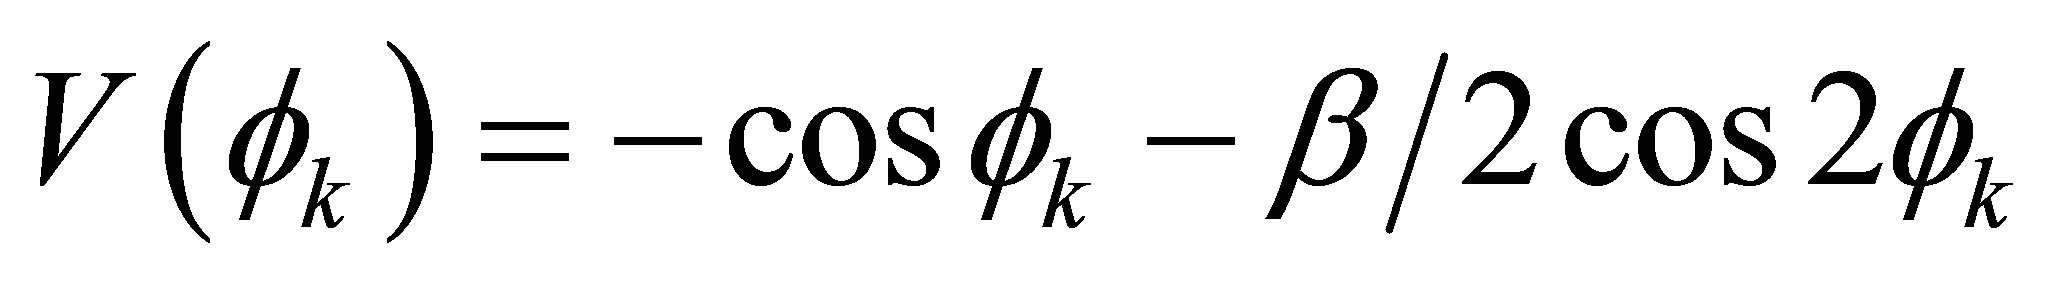 (9)
(9)
Considering the complexity of practically observed meteorological elements data, N = 1 is chosen. Equation (8) is simulated solution as a trial being obtained by decreasing β from −1 to 1 for Q = 0.001 in 500 equidistant steps. At each step the system relaxes for 1000 integrations and the final one is stored. The initial phase angles were . Figure 1 shows the detection result. The phase changes show that this system switches at about β = 0.5 and about β = −0.5 which is in accord with potential change of the system [14,15].
  values reveal significant peaks at corresponding β value, which indicates
  can distinguish different state objectively.
3.2. Sensitive Numerical Simulation of Noise Intensity Q
It can be known from Equation (8) that this system shows various forms of phase locking and/or bifurcation patterns depending on parameters β and Q for N = 1. Here how noise intensity Q affects the result of detection is considering. Figure 2 is phase changing for Q = 0.001, 0.01, 0.05, 1 respectively and Figure 3 is the corresponding detection result. It indicates that enough strong noise intensity makes phase distortion which leads not to detect different clusters with phase synchronization.
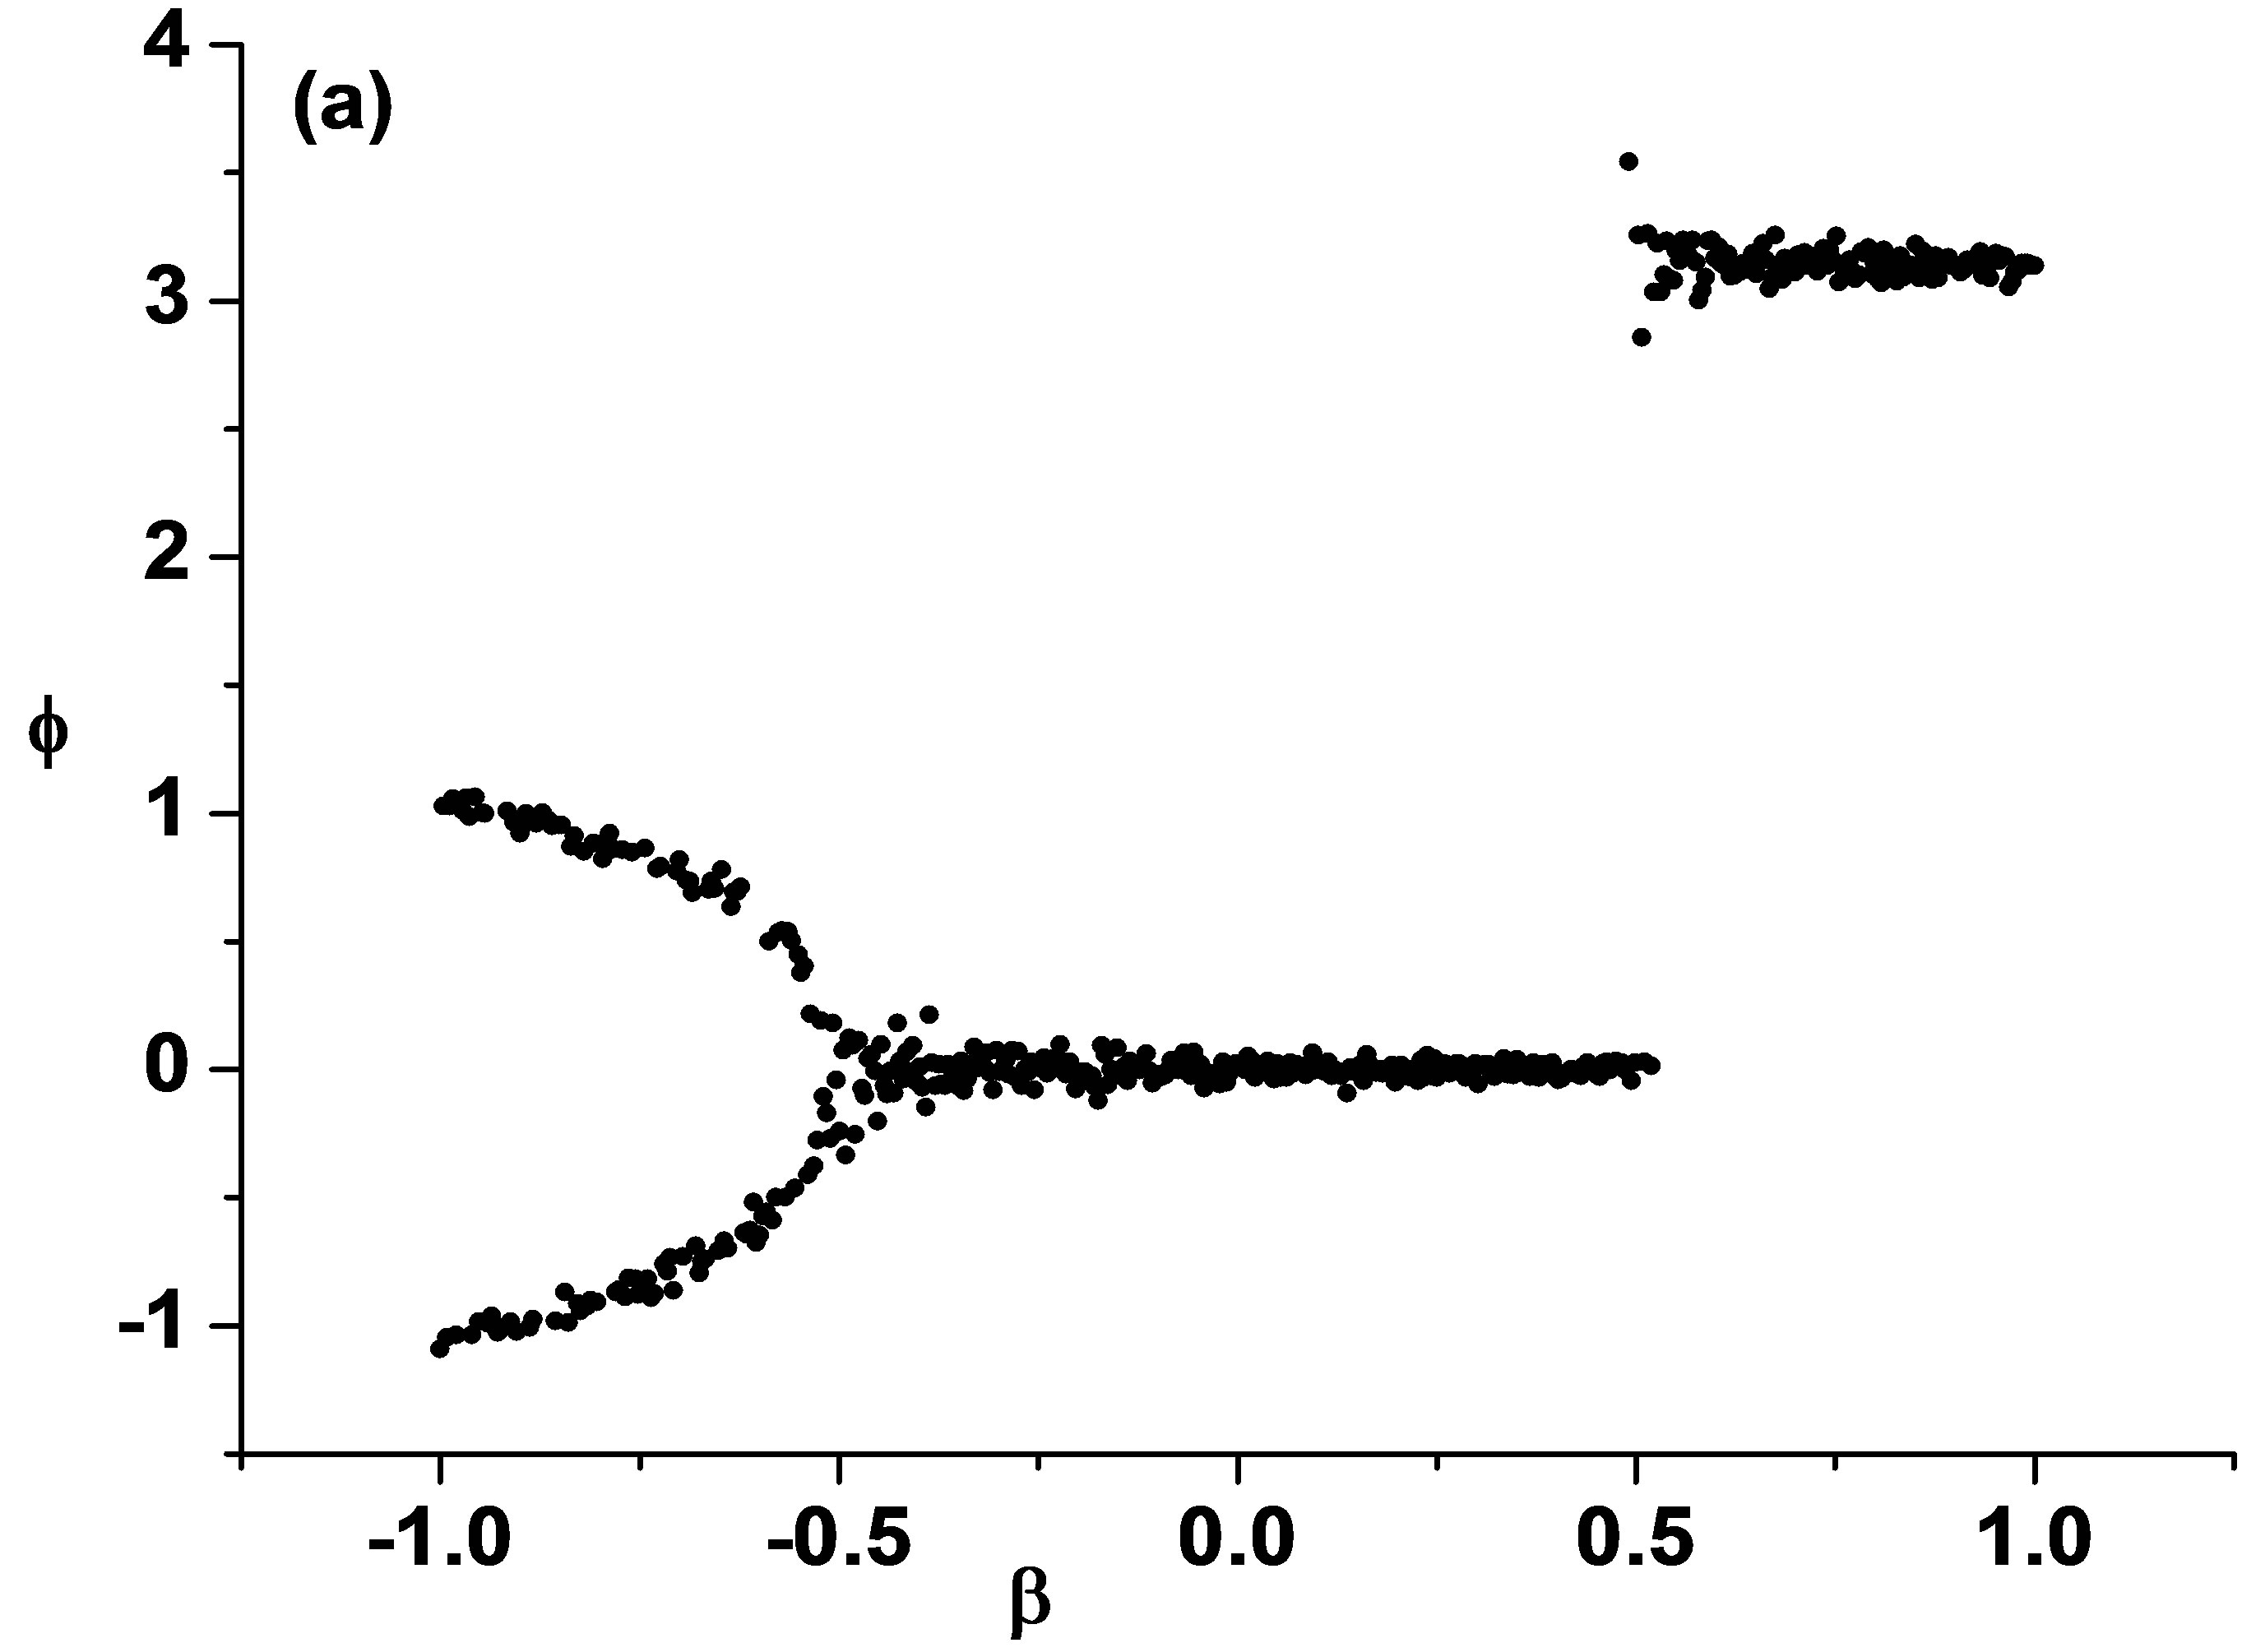
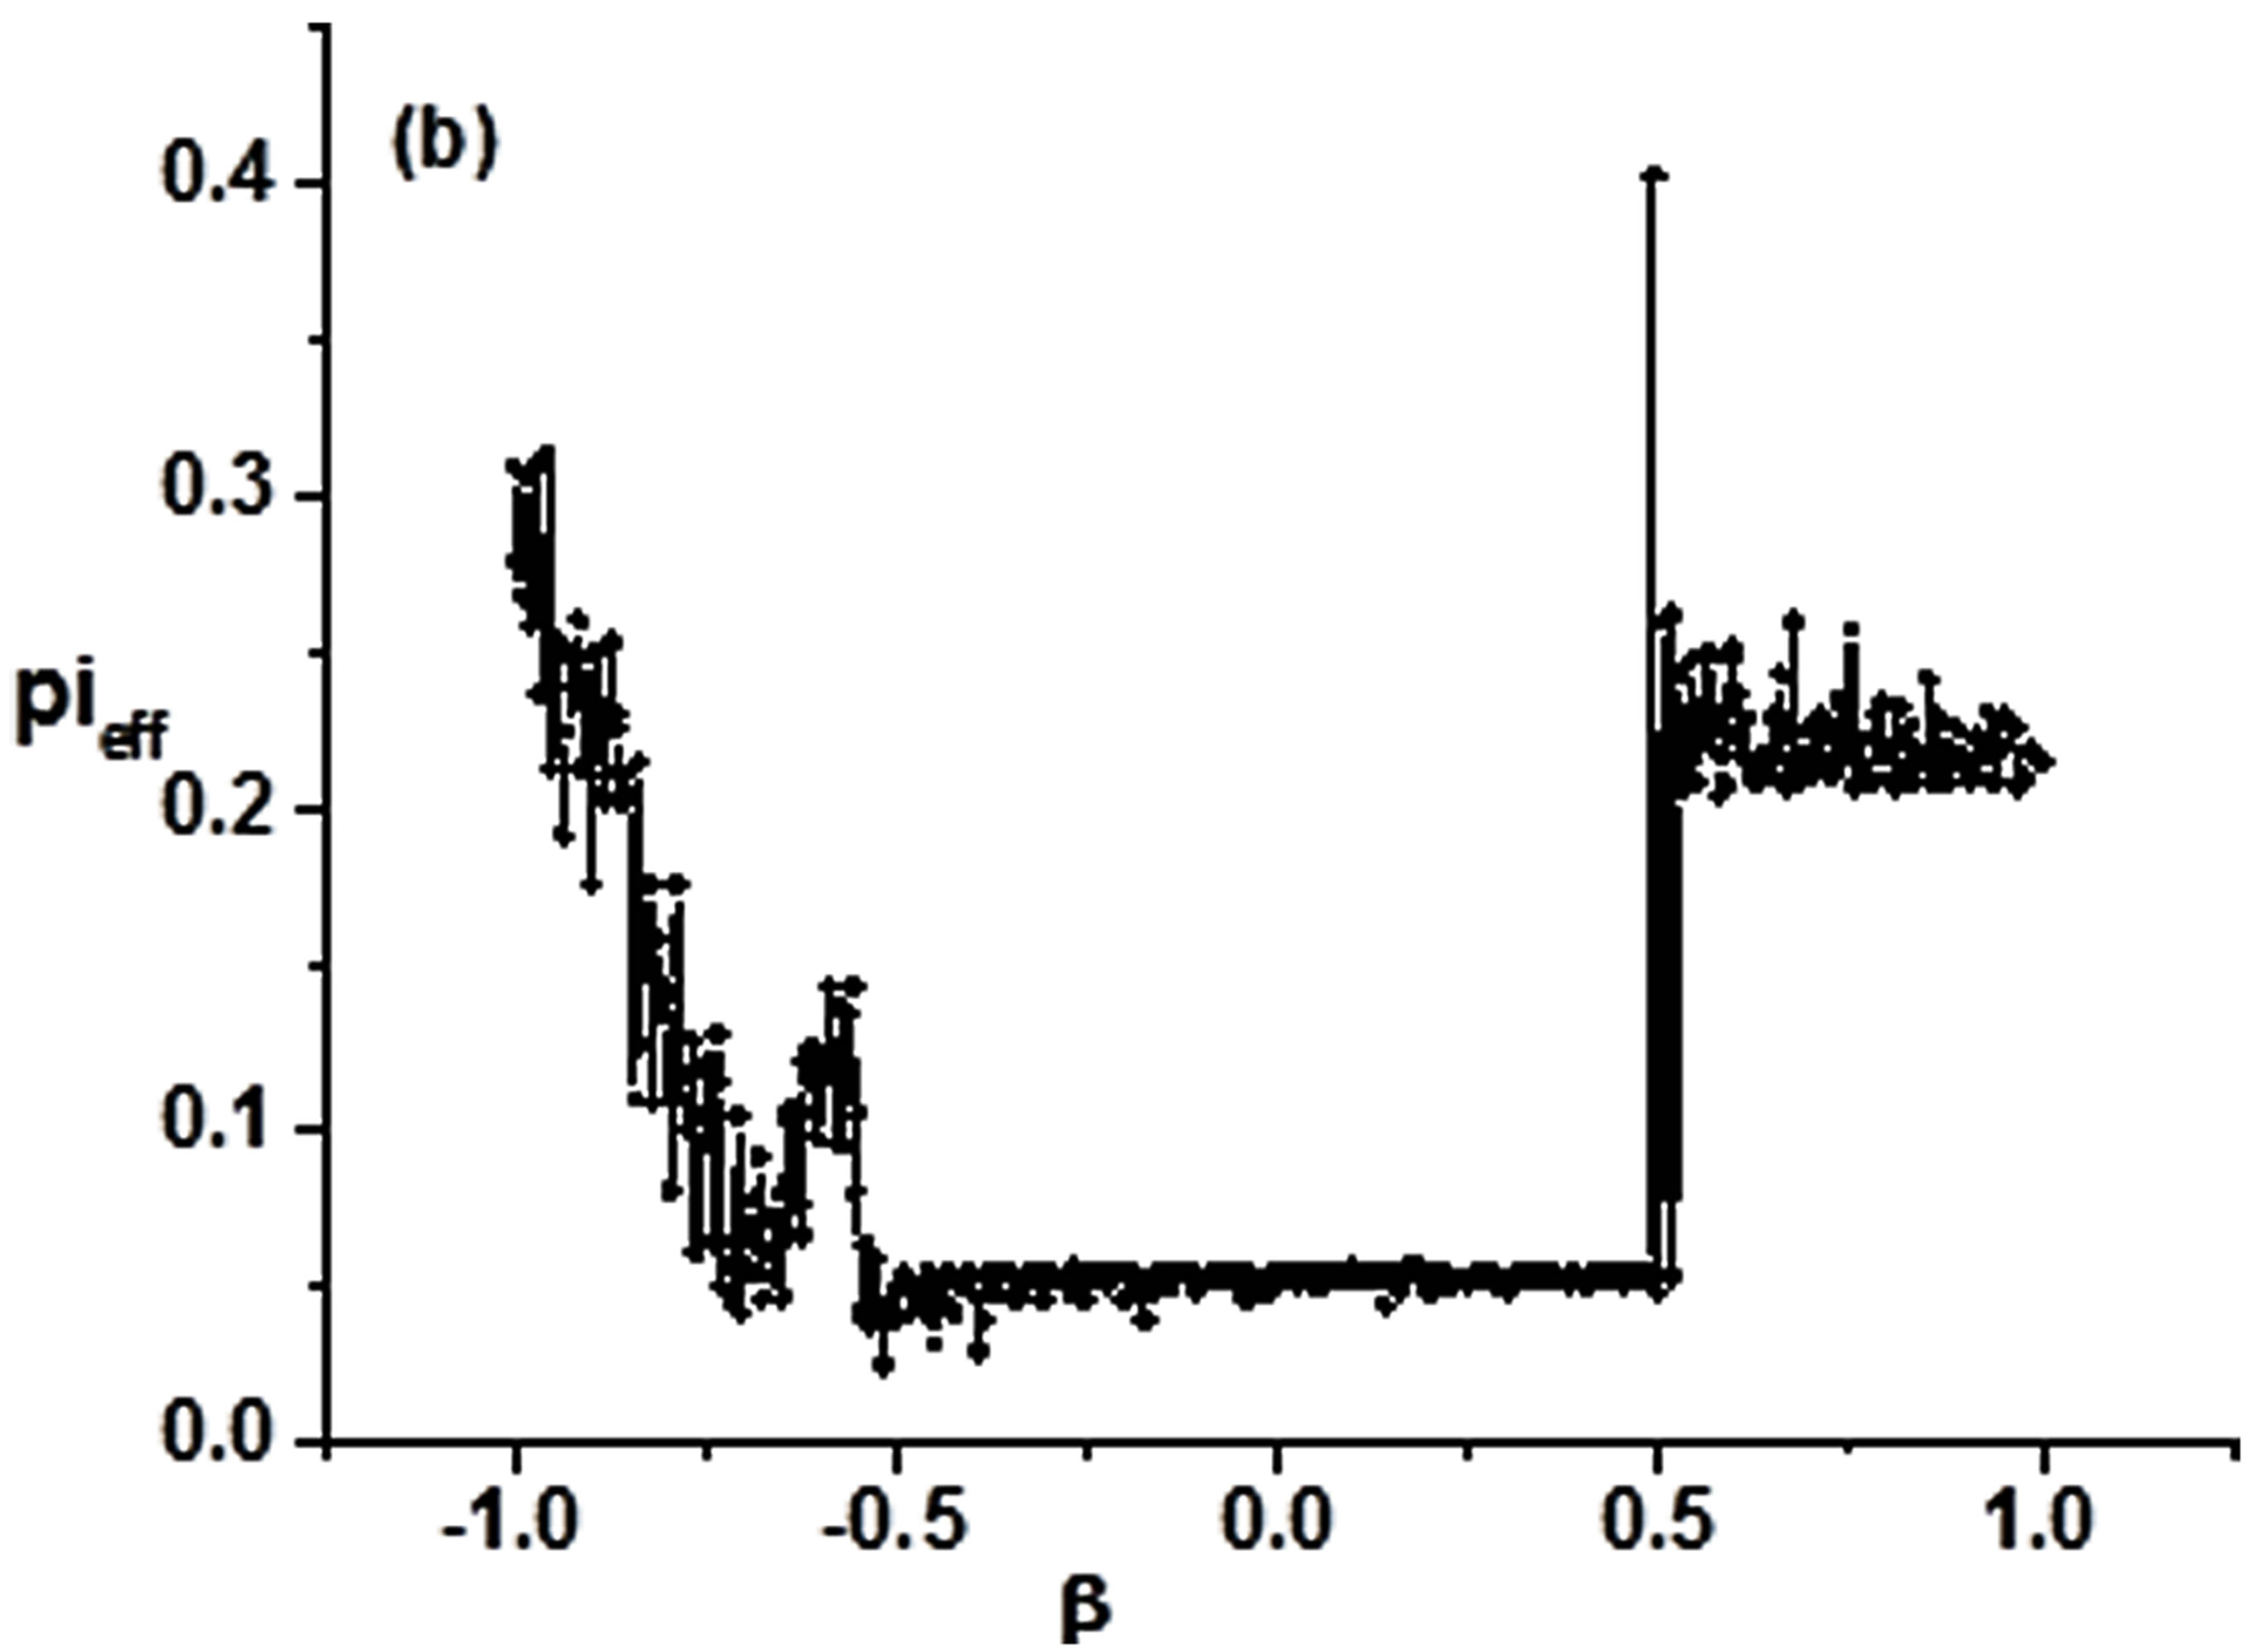
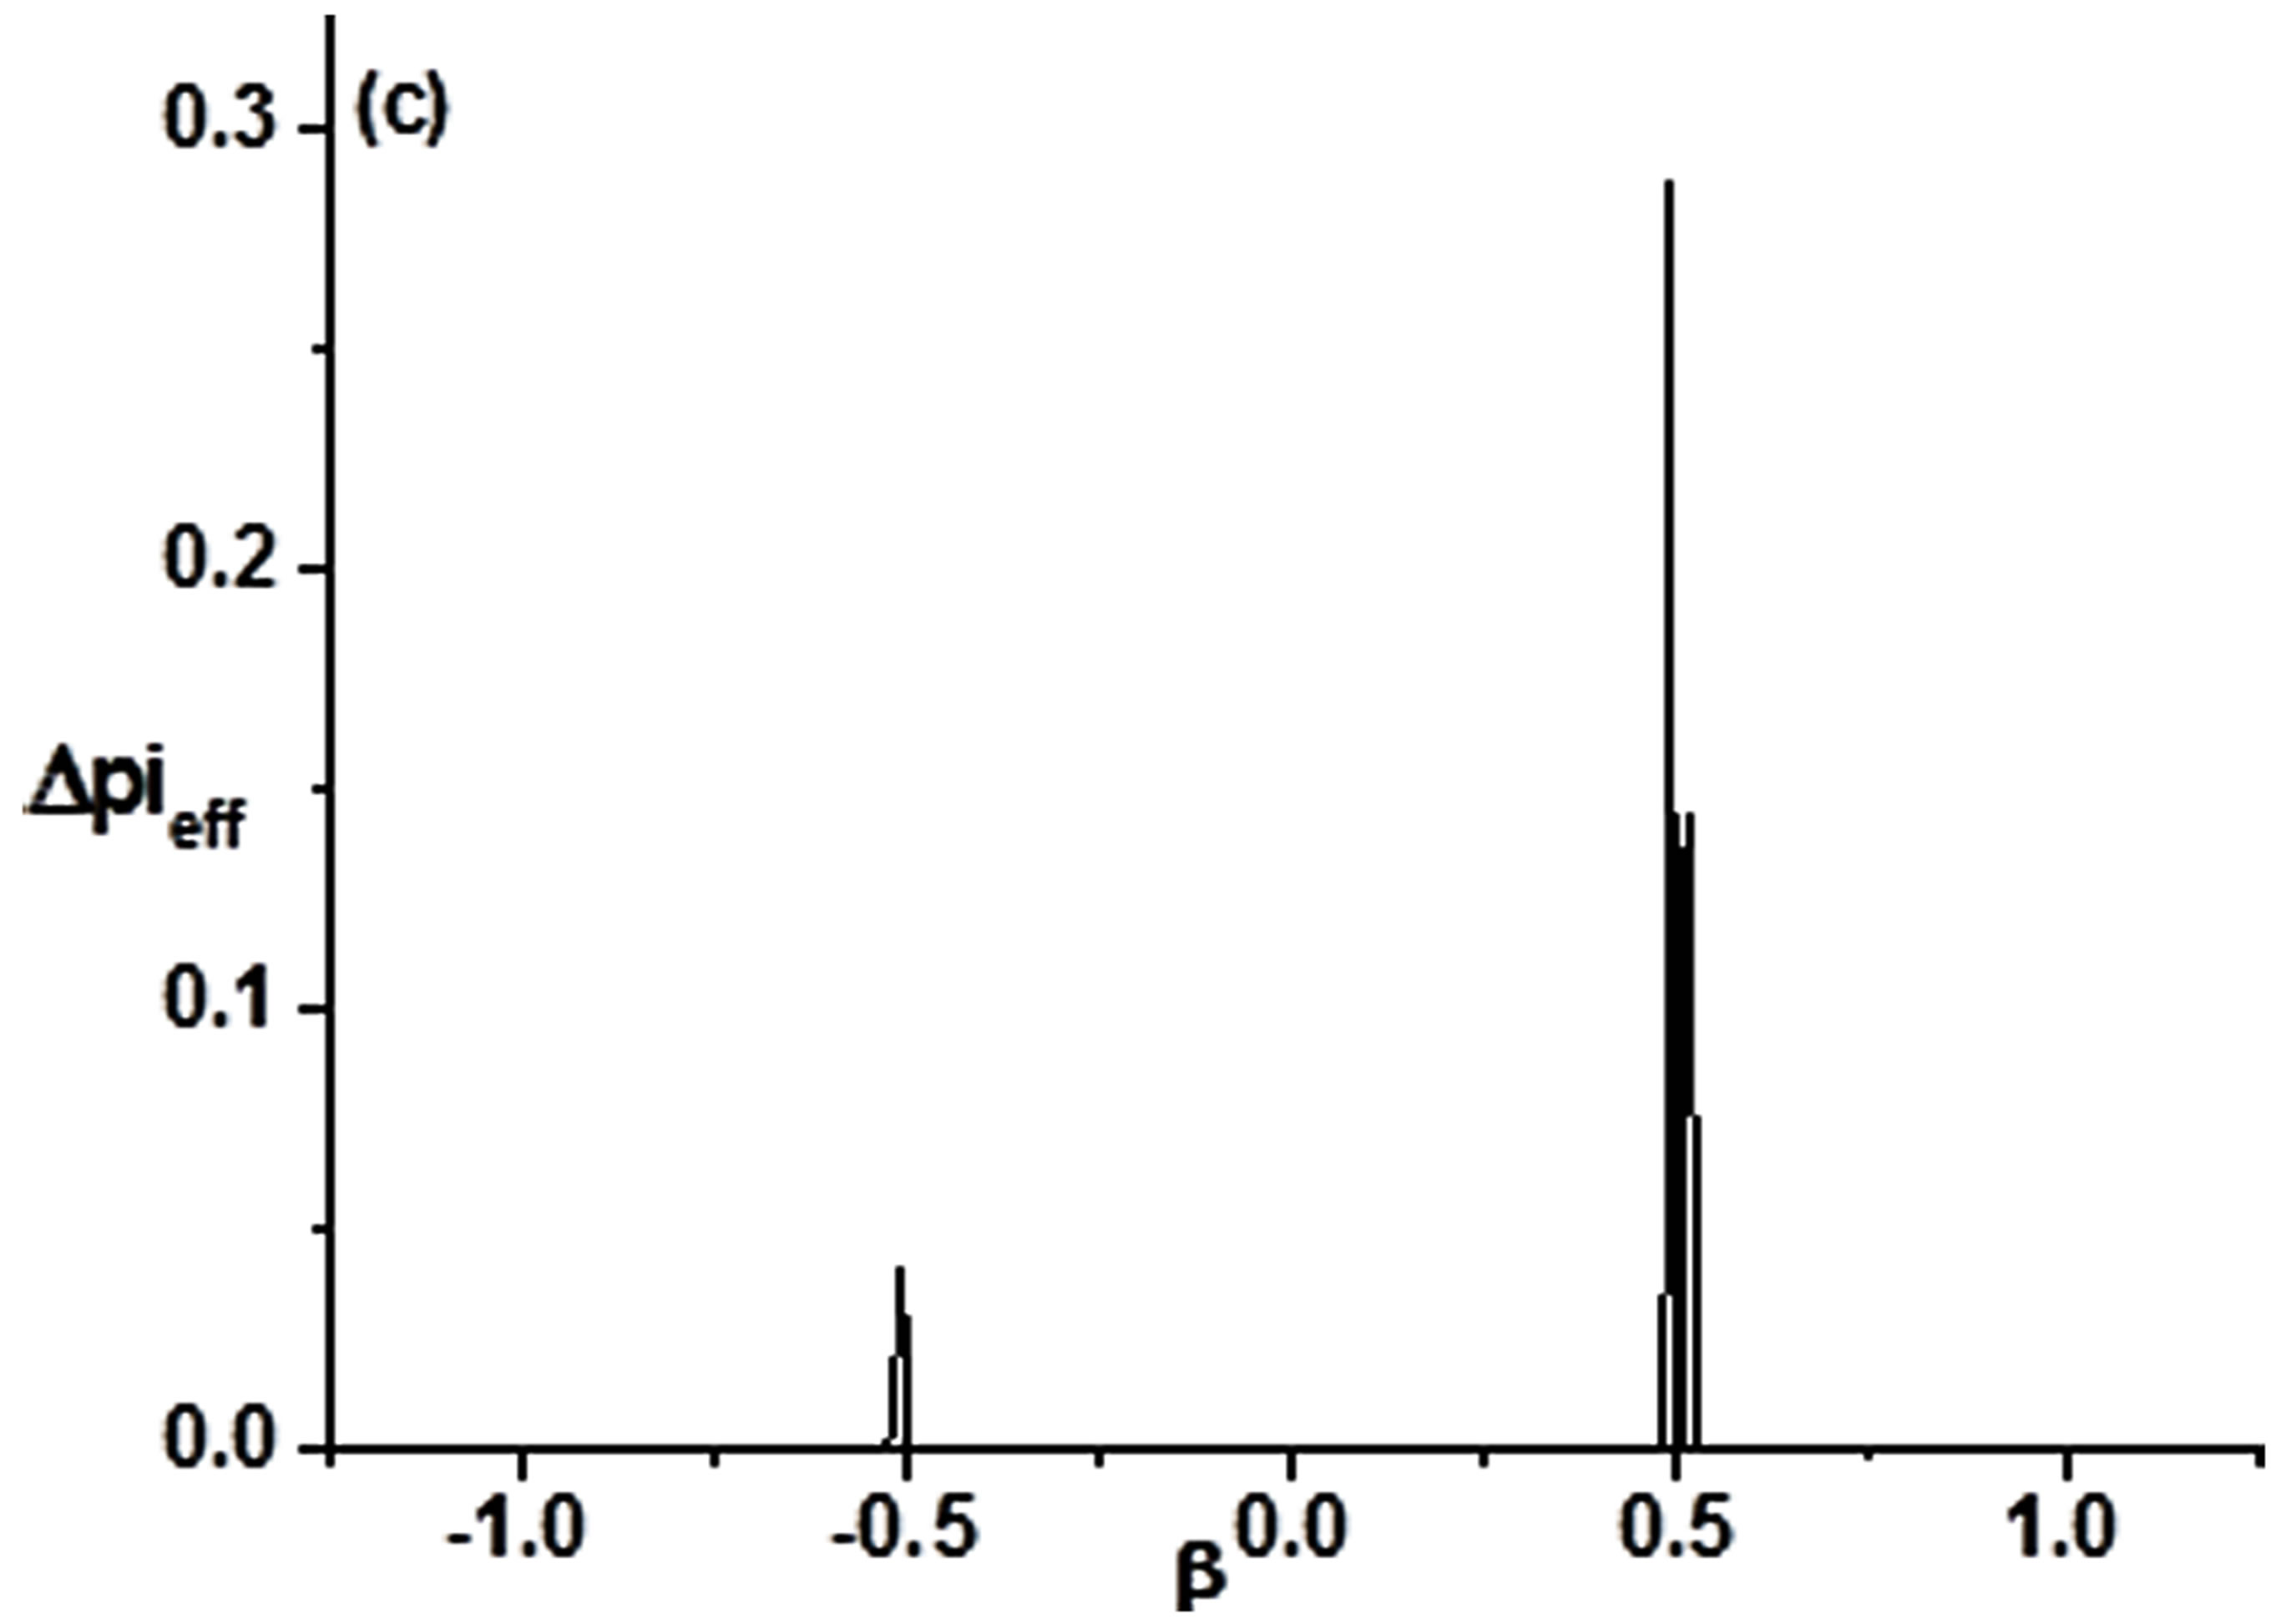
Figure 1. Phase clustering for Q = 0.001.
3.3. Sensitive Numerical Simulation of Sequence Length
Because small noise intensity is better for the detection, Q = 0.001 is chosen. Then the influence of sequence length is considered. For the phase system, it is assumed that phase changes as the same with the time changing. Figure 4 is the clustering result for different sequence length. It shows that with sequence length n increasing, 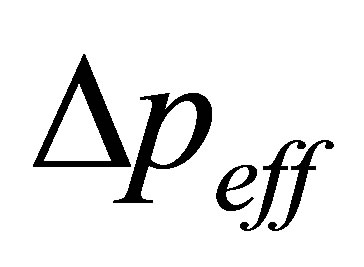 reveals significant peaks at the borders of different states and
  value becomes smaller. Because of unchanged dynamic mechanisms of phase system, time points of segment borders are unchanged too, while
  value means the ratio of some cluster to all possible clusters, hence its value should get smaller over time which is in accord with physical meanings of
 .
.
4. Application of Practically Observed Data
For the sake of the adaptability of practically observed data to phase clustering, MSPI (Multi-scales Standardized Precipitation Index) [16] January 2009-December 2012 of 31 observation stations in southwest China is analyzed on Southwest Drought Event in fall 2009. Figure 5 shows the clustering result of Bijie station in Guizhou province as an example. It shows that this station experienced total three processes, i.e., increasing drought, oscillating continuous drought and gradually getting moist. Phase clustering method can detect the temporal process objectively to a certain degree. For this drought event, some station in southwest China began getting drought from January 2009.

Figure 2. Phase changes for different noise intensity Q.

Figure 3. Phase clustering for different noise intensity Q.


Figure 4. Phase clustering for sequence length n.
5. Summary and Discussion
In view of extreme values events mathematically rather than the process about extreme weather events, phase synchronization clustering method is introduced and the applicability of the method is discussed from the aspects of noise intensity and sequence length. At last the observed data are applied. The results show that clustering measure difference  can detect the temporal process objectively to a certain degree and it has certain application to detect the temporal process of extreme weather events. For simplicity, we only study one-dimension data and multi-dimensions data deserve further research which our future research would focus on.
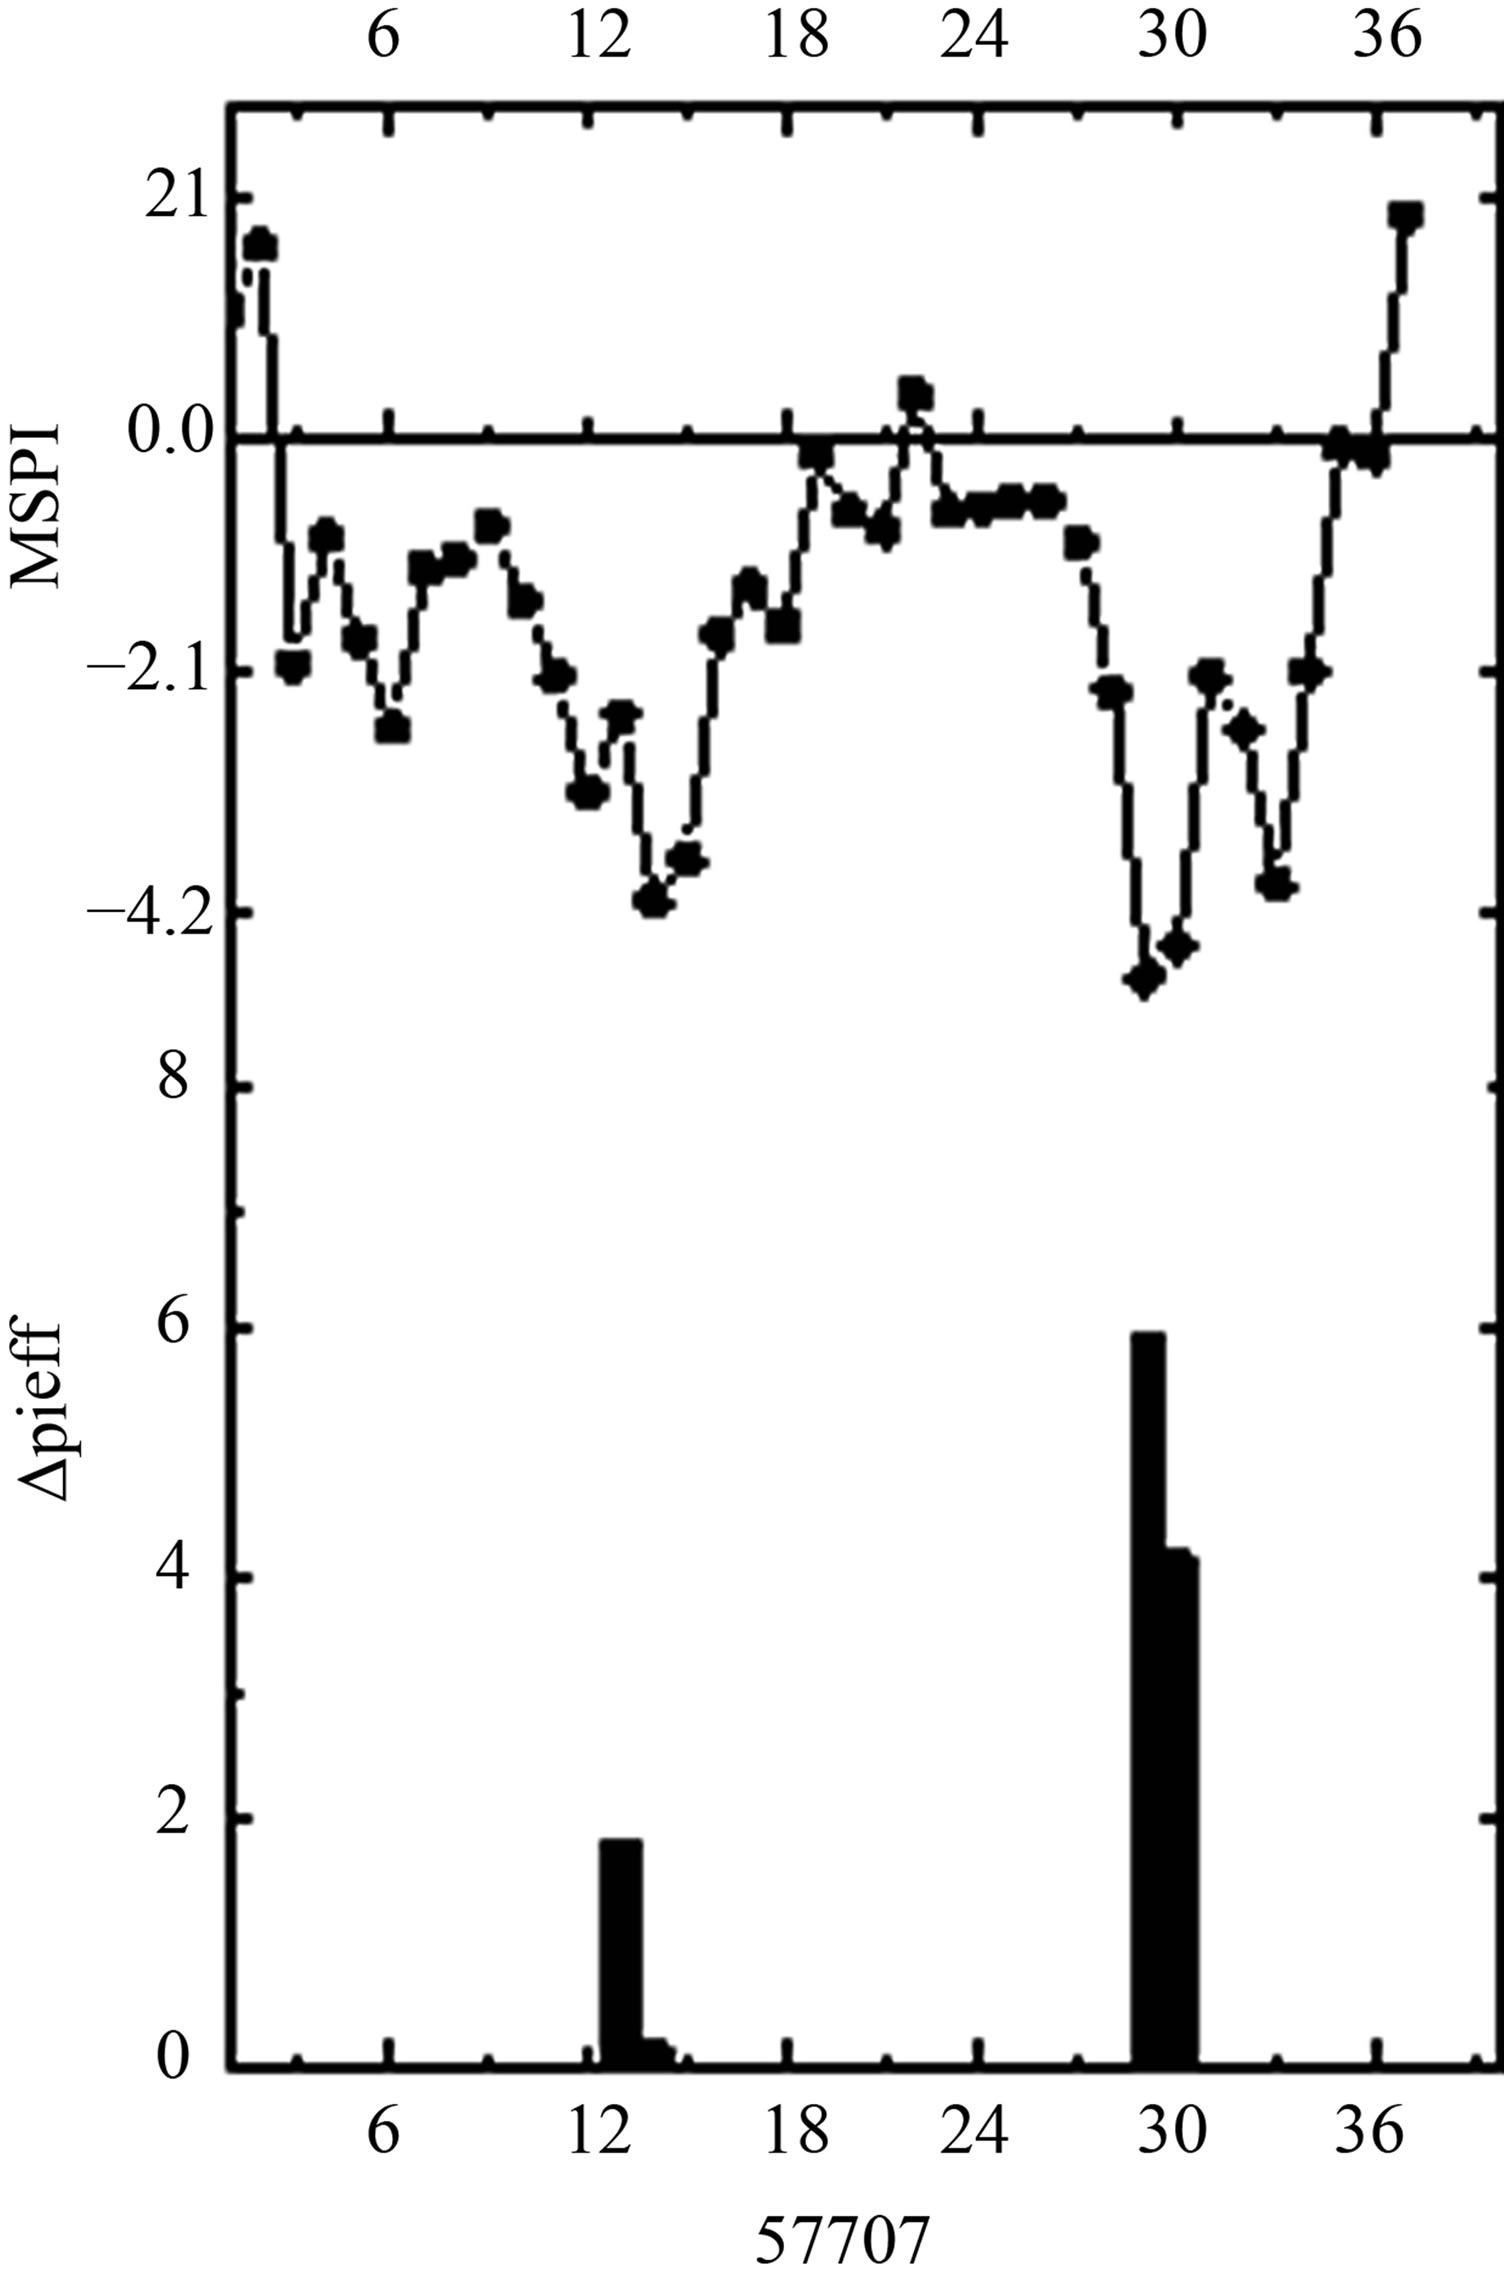
Figure 5. Phase clustering detection in Bijie station.
6. Acknowledgements
Funding was obtained from National Science and Technology Support program under Grant No. 2012CB955901 and National Natural Science Foundation of China under Grant No.41105033.
REFERENCES
- IPCC, “Summary for Policymakers of the Synthesis Report of the IPCC Fourth Assessment Report,” Cambridge University Press, Cambridge, 2007, pp. 1-15
- P. Frich, L. V. Alexander and P. M. Della-Marta, “Observed Coherent Changes in Climatic Extremes during the Second Half of the 20th Century,” Climate Research, Vol. 19, No. 3, 1993, pp. 193-212. http://dx.doi.org/10.3354/cr019193
- M. J. Manton, P. M. Della-Marta and M. R. Haylock, “Trend in Extrmeme Daily Rainfall and Temperature in Southeast Asia and the South Pacific 1961-1998,” International Journal of Climatology, Vol. 2, No. 3, 2001, pp. 269-284. http://dx.doi.org/10.1002/joc.610
- P. M. Zhai and X. H. Pan, “Change in Extreme Temperature and Precipitation over Northern China during the Second Half of the 20th,” Acta Geologica Sinica, Vol. 58, No. 1, 2003, pp. 1-9.
- X. H. Pan, “The Study of Extreme Temperature and Rainfall about 50 Years over China,” Chinese Academy of Meteorological Sciences, Beijing, 2002, pp. 32-40.
- Y. F. Qian and D. Q. Huang, “The Definition of Daily Mean Temperature Extreme over China and Its Trend,” Acta Scientiarum Naturalium Univeisitatis Sunyatseni, Vol. 47, No. 3, 2008, pp. 112-116.
- Z. B. Sun and N. Zhang, “Change of Extreme Temperature in China during 1955-2005,” Journal of Nanjing Institute of Meteorology, Vol. 31, No. 1, 2008, pp. 123-128.
- Y. Ping, W. D. Liu and Q. G. Wang, “The Climatic Change Trend and Seasonal Characteristics of Daily Temperature Extremes in China for the Latest 40 Years,” Journal of Applied Meteorology, Vol. 21, No. 29, 2010, pp. 29-35.
- Z. Q. Gong, X. J. Wang and Z. Rong, “Regional Characteristics of Temperature Changes in China during the Past 58 Years and Its Probable Correlation with Abrupt Temperature Change,” Acta Physica Sinica, Vol. 58, No. 6, 2009, pp. 4342-4353.
- D. Q. Zhang and G. L. Feng, “The Relationship between Spatial Extent and Duration of Severe Droughts in China over the Last 50 Years,” 2010 Second IITA Conference on Geoscience and Remote Sensing, Qingdao, 28-31 August 2010, pp. 345-348.
- Z. J. Zhang and W. H. Qian, “Identifying Regional Prolonged Low Temperature Events in China,” Advance in Atmosphere Science, Vol. 28, No. 2, 2011, pp. 338-351. http://dx.doi.org/10.1007/s00376-010-0048-6
- A. D. Hutt and U. Steinmetz., “Detection of Mutual Phase Synchronization in Multivariate Signals and Application to Phase Ensembles and Chaotic Data,” Physical Review E, Vol. 68, No. 3, 2003, Article ID: 036219. http://dx.doi.org/10.1103/PhysRevE.68.036219
- A. Hutt and H. Riedel, “Analysis and Modeling of QuasiStationary Multivariate Time Series and Their Application to Middle Latency Auditory Evoked Potentials,” Physica D, Vol. 177, No. 1-4, 2003, pp. 203-215. http://dx.doi.org/10.1016/S0167-2789(02)00747-9
- G. Schner, H. Haken and J. Kelso, “A Stochastic Theory of Phase Transitions in Human Hand Movement,” Biological Cybernetics, Vol. 53, No. 4, 1986, pp. 247-257. http://dx.doi.org/10.1007/BF00336995
- H. Haken, J. A. S. Kelso and H. Bunz, “A Theoretical Model of Phase Transitions in Human Hand Movements,” Biological Cybernetics, Vol. 51, No. 5, 1985, pp. 347-356. http://dx.doi.org/10.1007/BF00336922
- W. Hou, C. J. Zhang and G. Gao, “Research on the Meteorological Drought Index Based on the Hierarchy of Climate System,” Meteorological Monthly, Vol. 38, No. 6, 2012, pp. 707-717.